ORIGINAL PAPER
Compositional analysis of bacterial communities in seawater,
sediment, and sponges in the Misool coral reef system, Indonesia
Daniel Francis Richard Cleary1&Ana Rita Moura Polónia1&Leontine E. Becking2,3,4&
Nicole Joy de Voogd2&Purwanto5&Helder Gomes1&Newton Carlos Marcial Gomes1
Received: 31 January 2016 / Revised: 13 March 2017 / Accepted: 3 April 2017 / Published online: 23 April 2017 # Senckenberg Gesellschaft für Naturforschung and Springer-Verlag Berlin Heidelberg 2017
Abstract Sponge species have been deemed high microbial abundance (HMA) or low microbial abundance (LMA) based on the composition and abundance of their microbial symbi-onts. In the present study, we evaluated the richness and com-position of bacterial communities associated with one HMA sponge (Xestospongia testudinaria; Demospongiae: Haplosclerida: Petrosiidae), one LMA sponge (Stylissa carteri; Demospongiae: Scopalinida - Scopalinidae), and one sponge with a hitherto unknown microbial community (Aaptos suberitoides; Demospongiae: Suberitida: Suberitidae) inhabiting the Misool coral reef system in the West Papua province of Indonesia. The bacterial communities of these sponge species were also compared with seawater and sedi-ment bacterial communities from the same coastal coral reef habitat. Using a 16S rRNA gene barcoded pyrosequencing
approach, we showed that the most abundant phylum overall was Proteobacteria. The biotope (sponge species, sediment or seawater) explained almost 84% of the variation in bacterial composition with highly significant differences in composition among biotopes and a clear separation between bacterial com-munities from seawater and S. carteri; X. testudinaria and A. suberitoides and sediment. The Chloroflexi classes SAR202 and Anaerolineae were most abundant in A. suberitoides and X. testudinaria and both of these species shared several OTUs that were largely absent in the remaining biotopes. This suggests that A. suberitoides is a HMA sponge. Although similar, the bacterial communities of S. carteri and seawater were compositionally distinct. These results confirm compositional differences between sponge and non-sponge biotopes and between HMA and LMA sponges.
Keywords Aaptos suberitoides . Microbial abundance . Stylissa Carteri . 16S rRNA gene, Xestospongia testudinaria
Introduction
Coral reefs are highly diverse, but also globally threatened ecosystems. Local perturbations including overfishing and pollution combined with global phenomena such as coral bleaching have had a disastrous effect on coral reefs (Bruno
and Selig2007; De’ath et al.2012; Pandolfi et al.2003). Coral
cover in certain reefs has virtually disappeared leading to the loss of important ecosystem services such as renewable re-sources (e.g., fisheries), protection against erosion, and
nutri-ent cycling (Moberg and Folke1999). The loss of coral cover
also leads to the loss of dependent species such as numerous fish species and shifts in composition to reefs dominated by non-coral taxa such as algae or sponges (Bellwood et al. 2004).
Communicated by P. Martinez Arbizu
Electronic supplementary material The online version of this article (doi:10.1007/s12526-017-0697-0) contains supplementary material, which is available to authorized users.
* Daniel Francis Richard Cleary [email protected]; [email protected]
1
Department of Biology, CESAM, Universidade de Aveiro, Campus Universitário de Santiago, 3810-193 Aveiro, Portugal
2 Marine Biodiversity, Naturalis Biodiversity Center, Darwinweg 2,
2333 CR Leiden, The Netherlands
3
Marine Animal Ecology, Wageningen UR, P.O. Box 338, 6700 AH Wageningen, The Netherlands
4
Department of Environmental Science, Policy, and Management, University of California Berkeley, 130 Mulford Hall,
Berkeley, CA 94720-3114, USA
5 Department of Fisheries and Marine Science, University of
Sponges (Phylum Porifera) are ancient metazoans (van Soest
et al.2012) with a fossil record dating back to the Precambrian
(Li et al.1998). The majority of the 8826 valid living species
belong to the class Demospongia (demosponges) (Borchiellini
et al.2001; van Soest et al.2012). The remaining species
repre-sent the classes Hexactinellida (glass sponges), Calcarea (calcar-eous sponges), and Homoscleromorpha. They have successfully colonised a range of aquatic environments from tropical to polar, shallow to deep water, and marine and freshwater (Rützler
2004). They are also structurally important components of coral
reefs where they provide shelter for numerous organisms and contribute to reef regeneration and stabilisation (de Voogd et al.
2006). In addition to the above, they are one of the most
impor-tant marine sources of promising pharmaceutical compounds
(Faulkner2002; Taylor et al.2007).
Sponges are known to host large communities of microbial symbionts of known ecological and biotechnological importance
(Freeman and Thacker2011). They are also unique and,
depend-ing on the species, highly selective environments for microbes
(Cleary et al.2013,2015; Freeman and Thacker2011; Hentschel
et al.2006). The prokaryote metabolism requires nitrogen and
carbon; sponges produce both, often in ample quantities, by releasing ammonia, as an end product of their metabolism, and carbohydrates and amino acids, as a consequence of
phagocyto-sis (Hentschel et al.2006). Microbial symbionts, in turn, provide
sponges with important nutrients (Flatt et al.2005), process
met-abolic waste, improve host defence and stabilise the host
skele-ton (Hentschel et al.2006). Some sponge species also house
specific microbial communities that may be similar over large
geographical distances (Flatt et al.2005).
Microbes inhabit the mesophyll-matrix of most
desmosponges (Hentschel et al.2003). The abundance and
composition of sponge-associated microorganisms can vary greatly among sponge species, including those inhabiting the
same habitat (Cleary et al.2013,2015; de Voogd et al.2015).
High microbial abundance (HMA) sponges can contain
around 1010bacterial cells g−1wet weight of sponge (2 to 4
orders of magnitude higher than concentrations in sea water)
(Hentschel et al. 2006), while low microbial abundance
(LMA) sponges contain around 106cells g−1(similar to
con-centrations in sea water) (Kamke et al.2010).
HMA sponges also tend to host more diverse bacterial com-munities including Proteobacteria, Chloroflexi, Acidobacteria,
and Actinobacteria (Gloeckner et al.2014). Previously, the
de-termination of HMA or LMA status was made on the basis of electron microscopy and morphotype with HMA sponges con-taining more densely packed microbial communities and small-er canals and choanocyte chambsmall-ers compared to LMA sponges
(Schlappy et al.2010; Vacelet and Donadey1977). Gloeckner
et al. (2014), however, showed that electron microscopy was
not always sufficient to determine HMA or LMA status and that sponges existed with intermediate microbial abundances. They, therefore, suggested combining electron microscopy
with 16S rRNA gene sequence data. The latter may in fact be a better determinant given the sometimes ambiguous results
obtained by Gloeckner et al. (2014).
In the present study, we compared the richness and com-position of bacteria in three sponge species inhabiting open coastal habitat, sediment and seawater from a coral reef sys-tem in South East Misool, Raja Ampat, West Papua, Indonesia. Located on the northwestern tip of Papua, eastern Indonesia, the Raja Ampat region consists of nearly 1500 islands and is considered an area with a global priority for
conservation (Roberts et al.2002). It is among the most
bio-diverse regions on Earth possessing over 75% of the world’s coral species and almost a thousand species of reef fish (e.g.,
Allen 2008; Allen and Erdmann 2009; Mangubhai et al.
2012). The reefs and mangrove systems in SE Misool
encom-pass an area of outstanding marine biological diversity (e.g.,
Allen2008; Becking et al.2014; Mangubhai et al.2012) and
harbour some of the most pristine reefs in Indonesia
(Grantham et al.2013; Mangubhai et al.2012). As a result,
a Marine Protected Area of 343,200 ha was established in SE Misool in 2009 (KKPD Misool Timur-Selatan).
We mainly focused our analysis on bacterial communi-ties of the LMA sponge Stylissa carteri (Dendy, 1889) and the HMA giant barrel sponge Xestospongia testudinaria (Lamarck, 1815) in addition to the sponge Aaptos
suberitoides (Brøndsted, 1934). Stylissa carteri (Fig.1) is
a common Indo-Pacific bright orange flabelliform sponge that occurs from the Red Sea to Taiwan (de Voogd and
Cleary 2008; Giles et al.2015). Numerous bromopyrolle
alkaloids with promising antiviral, antibacterial, and anti-cancer properties have been isolated from species
belong-ing to the genus Stylissa (Ebada et al. 2015; Rohde et al.
2012).
Xestospongia testudinaria (Fig. 2) is one of the largest
known sponges. It usually has an erect and barrel-shaped
Fig. 1 Photograph of Stylissa carteri (Dendy, 1889) taken by LE Becking in Misool
structure that can measure up to 2.4 m in height and width. The surface texture varies from smooth to highly digitate or
lamellate (Swierts et al.2013). It also has an incredible life
span that may exceed 2000 years (McMurray et al.2008). It
can be found from the Red Sea to the Great Barrier Reef (de
Voogd et al.2006; Moitinho-Silva et al.2014; Pham et al.
1999) and can be locally abundant in coral reefs, usually at
depths greater than 10 m, but can also occur at shallower
depths in certain reefs (de Voogd and Cleary2009; Huang
et al.2016; Swierts et al.2013). Xestospongia species are
among the richest sources of pharmacologically active chem-ica l comp ound s isola ted fr om marin e organ isms. Xestospongia testudinaria has been shown to produce com-pounds with potential applications in the treatment of obesity, diabetes mellitus, arteriosclerosis, and Alzheimer’s disease
(Akiyama et al.2013; Liang et al.2014).
Aaptos suberitoides (Fig.3) occurs in shallow coral reefs in
the coral triangle (de Voogd and Cleary2008). It forms thick
irregular lobate masses that can occupy large parts of the reef. Its exterior is dark brown, but the interior is canary yellow and stains dark brown after preservation. It has been shown to produce compounds with antitumor, antimicrobial, and
anti-viral activity (Aoki et al.2006; Jin et al.2011; Larghi et al.
2008; Liu et al. 2012; Pham et al. 2013; Tsukamoto et al.
2010).
The main objectives of this study were to identify the most abundant higher bacterial taxa, compare bacterial richness and composition among sponge hosts and non-sponge biotopes (sediment and seawater), and identify dominant bacterial OTUs and their closest known relatives.
Material and methods
Study site
Samples of S. carteri, A. suberitoides, and X. testudinaria were collected by snorkelling and SCUBA diving from the 13th to the 18th of September 2013 in Southeast Misool, Raja
Ampat region, West Papua province in Indonesia (Fig.4). SE
Misool is part of a marine protected area of 343,200 ha established in 2009 (KKPD Misool Timur-Selatan). The equa-torial location of Misool means that the main seasonal
influ-ence is driven by monsoons (Prentice and Hope2007). Misool
is most influenced by the southeast monsoon from May to October, which is characterised by cooler sea surface temper-atures (SSTs), persistent winds and strong ocean swell. The
annual rainfall in Papua averages 2500–4500 mm with
inter-annual variability in rainfall due to the El Niño Southern
Oscillation (ENSO; Prentice and Hope2007). There are
sea-sonal differences in SSTs with an average SST of 29.0 °C,
ranging from 19.3 to 36.0 °C (Mangubhai et al.2012).
Data collection
In the study area, small fragments of the interior and exterior parts of the sponges S. carteri (Demospongiae: Scopalinida -Scopalinidae), A. suberitoides (Demospongiae: Suberitida: Suberitidae), and X. testudinaria (Demospongiae: Haplosclerida: Petrosiidae) were sampled in order to sample, as much as possible, the whole bacterial community. Specimens were collected from shallow water reefs (depth range: 7–17 m) and identified in the field. Voucher specimens of sponges have been deposited in the sponge collection of Naturalis Biodiversity Center, the Netherlands (RMNH Porifera). Sediment samples were taken using mini cores; this consisted of sampling the top 5 cm of sediment with a plastic disposable syringe from which
Fig. 2 Photograph of Xestospongia testudinaria (Lamarck, 1815) taken by LE Becking in Misool
Fig. 3 Photograph of Aaptos suberitoides (Brøndsted, 1934) taken by LE Becking in Misool
the end had been cut in order to facilitate sampling (Capone et al.
1992). Seawater samples were collected by filtering 1 L of
sea-water through a Millipore® White Isopore Membrane Filter
(GTTP04700, 47 mm diameter, 0.22μm pore size). Samples
were stored in 96% EtOH. After sampling, tubes containing the samples were frozen or carried in ice during travel between field-work lodging and the Netherlands and Portugal, where the
sam-ples were stored at−80. °C until processing. For the present
study, three samples each of the sponges S. carteri, A. suberitoides, and X. testudinaria, sediment and seawater were assessed for bacterial community analysis.
DNA extraction and pyrosequencing
Total community-DNA extraction and 16S rRNA gene barcoded-pyrosequencing
We isolated PCR-ready total community DNA (TC-DNA) from sediment, seawater, and sponge samples using the FastDNA® SPIN Kit (MP Biomedicals) following the manufacturer’s in-structions. Briefly, we prepared sediment samples by centrifug-ing each one for 30 min at 4400 rpm and 4 °C; the membrane filter (seawater sample) and sponge samples were each cut into small pieces. The whole membrane filter and 500 mg of sediment or sponge were transferred to Lysing Matrix E tubes containing a mixture of ceramic and silica particles. The microbial cell lysis was performed in the FastPrep® Instrument (Q Biogene) for 80 s at speed 6.0. Extracted DNA was eluted into
DNase/Pyrogen-Free Water to a final volume of 50μL and stored at −20 °C until
use. Prior to pyrosequencing, the amplicons of the bacterial 16S rRNA gene were obtained using bacterial specific primers 27F
and 1494R (Gomes et al.2001). After a denaturation step at
94 °C for 5 min, 25 thermal cycles of 45 s at 94 °C, 45 s at
56 °C, and 1:30 min at 72 °C were carried out, followed by an extension step at 72 °C for 10 min. With the amplicons of the bacterial 16S rRNA gene as template, the V3V4 region was amplified using barcoded fusion primers with the Roche-454 A Titanium sequencing adapters, a six-base barcode sequence, for-ward V3 primer 5′-ACTCCTACGGGAGGCAG-3′ (Yu et al. 2 0 0 5) , a n d V 4 r e v e r s e d e g e n e r a t e p r i m e r
5′-TACNVRRGTHTCTAATYC-3′ (Vaz-Moreira et al.2011).
Sequence analyses were performed using previously
de-scribed methods (Cleary et al.2015; de Voogd et al.2015).
Briefly, in QIIME, fasta and qual files were used as input for the split_libraries.py script. OTUs were selected using UPARSE
with usearch7 (Edgar2013). Chimera checking was performed
using the UCHIME algorithm, which is the fastest and most sensitive chimera checking algorithm currently available (Edgar
et al. 2011). OTU clustering was performed using the
cluster_otus command (cut-off threshold at 97%). (see Online
Resource1for a detailed description). Closely related organisms
of numerically abundant OTUs (≥ 200 sequences) were identi-fied using the NCBI Basic Local Alignment Search Tool
(BLAST) command line“blastn” tool with the -db argument
set to nt (Zhang et al.2000). The DNA sequences generated in
this study can be downloaded from the NCBI SRA: SRP069346. Phylogenetic tree
Selected 16S rRNA gene sequences of the most dominant OTUs and representative cultured and uncultured closest
rel-atives in GenBank [http://www.ncbi.nlm.nih.gov/] were
aligned using ClustalW and a phylogenetic analysis
c o n d uc t e d u s i ng M E G A 6 s o f t w a r e (h t tp : // w w w.
megasoftware.net/; last checked 2014 07 09) (Tamura et al.
2013). A phylogenetic tree was constructed using the
Fig. 4 Map of study area showing the location of the study sites
neighbour-joining method and evolutionary distances were computed using the maximum composite likelihood method with a discrete Gamma distribution. In the results, we present a bootstrap consensus tree based on 1000 replicates. The boot-strap value is shown next to each branch when this exceeds 49%. This value represents the percentage of replicate trees in which the associated taxa clustered together.
Statistical analysis
A table containing the presence and abundance of all OTUs per sample was imported into R using the read.table() function. Plant organelles, mitochondria and sequences not classified as Bacteria (e.g., Archaea) were removed prior to statistical analysis.
0 20 60 100 a − Gammaproteobacteria F4, 10= 3.52 P = 0.049 0 20 60 100 b − Deltaproteobacteria F4, 10= 15.59 P < 0.001 0 20 60 100 c − Alphaproteobacteria F4, 10= 8.68 P = 0.003 0 20 60 100 d − Acidimicrobiia F4, 10= 38.72 P < 0.001 0 20 60 100 e − SAR202 F4, 10= 30.59 P < 0.001 0 20 60 100 f − Anaerolineae F4, 10= 10.56 P = 0.001 0 20 60 100 g − Synechococcophy. F4, 10= 5.01 P = 0.018 0 20 60 100 h − Nitrospira F4, 10= 18.76 P = 0.001 0 20 60 100 i − Chromatiales F4, 10= 8.68 P = 0.003 0 20 60 100 j − NB1−j F4, 10= 21.83 P < 0.001 0 20 60 100 k − Thiotrichales F4, 10= 8.52 P = 0.003 0 20 60 100 l − Rhodospirillales F4, 10= 28.27 P < 0.001 02 0 60 100 m − Caldilineales F4, 10= 8.67 P = 0.003 02 0 60 100 n − Rhodobacterales F4, 10= 8.87 P = 0.003 02 0 60 100 o − Clostridiales F4, 10= 8.75 P = 0.003 Sc Ap Xt Sd Wt 02 0 60 100 p − Rickettsiales F4, 10= 14.71 P < 0.001 Sc Ap Xt Sd Wt 02 0 6 0 1 0 0 q − Flavobacteriales F4, 10= 9.56 P = 0.002 Sc Ap Xt Sd Wt 02 0 6 0 1 0 0 r − HTCC2188 F4, 10= 47.89 P < 0.001 Sc Ap Xt Sd Wt 02 0 6 0 1 0 0 s − Desulfobacterales F4, 10= 8.96 P = 0.002 Sc Ap Xt Sd Wt 02 0 6 0 1 0 0 t − Dominant OTU F4, 10= 39.5 P < 0.001 Relative abundance (%)
Fig. 5 Mean (error bars represent a single standard deviation) relative abundance of the most abundant bacterial classes and orders and the most abundant OTU (dominant OTU) for samples from S. carteri (Sc), A. suberitoides (Ap), X. testudinaria (Xt), sediment (Sd), and seawater (Wt). Note that the abundance of the dominant OTU refers to the abundance of the most abundant OTU per sample and thus not the most abundant OTU overall. a Gammaproteobacteria, b Deltaproteobacteria, c
Alphaproteobacteria, d Acidimicrobiia, e SAR202, f Anaerolineae, g Synechococcophysidae, h Nitrospira, i Chromatiales, j NB1 − j, k Thiotrichales, l Rhodospirillales, m Caldilineales, n Rhodobacterales, o Clostridiales, p Rickettsiales, q Flavobacteriales, r HTCC2188, s Desulfobacterales, and t the dominant OTU. Results of the GLM analyses for each taxon are presented in the top right of each subfigure
Richness and higher taxon abundance
We used a self-written function in R (Gomes et al.2010) to
estimate rarefied OTU richness for each sample. Care, howev-er, should be taken in the interpretation of richness estimates based on sequence data given the prevalence of sequencing
errors (Edgar2013). We tested for significant differences in
the relative abundance of selected higher taxon groups (classes and orders) among habitats with an analysis of deviance using the glm() function in R. As data were proportional, we first applied a GLM with the family argument set to binomial. However, the ratio of residual deviance to residual degrees of freedom in the models substantially exceeded one so we set
family to“quasibinomial”. In the “quasibinomial” family, the
dispersion parameter is not fixed at one so that it can model over-dispersion. Using the GLM model, we tested for signifi-cant variation among habitats using the anova() function in R with the F test, which is most appropriate when dispersion is estimated by moments as is the case with quasibinomial fits.
Composition
The OTU abundance matrix was loge(x + 1) transformed (in
order to normalise the distribution of the data), and a distance matrix was constructed using the Bray-Curtis index with the vegdist() function in the VEGAN package (Oksanen et al.
2009) in R. The Bray–Curtis index is one of the most
frequent-ly applied (dis)similarity indices used in ecology (Cleary2003;
Legendre and Gallagher2001; Polónia et al.2014). Variation in
OTU composition among biotopes (S. carteri, A. suberitoides, X. testudinaria, sediment, and seawater) was assessed with principal coordinates analysis (PCO) using the cmdscale() function in R with the Bray–Curtis distance matrix as input. Variation among biotopes was tested for significance using the adonis() function in VEGAN. In the adonis analysis, the Bray– Curtis distance matrix of species composition was the response variable with the biotope as independent variable. The number of permutations was set at 999; all other arguments used the
default values set in the function. Weighted averages scores were computed for OTUs on the first four PCO axes using the wascores() function in the vegan package. Detailed descrip-tions of the funcdescrip-tions used here can be found in R
(e.-g.,?cmdscale) and online in reference manuals (
http://cran.r-project.org/web/packages/vegan/index.html; 2015/05/29).
Results
The sequencing effort yielded 50,223 sequences, which were assigned to 3797 OTUs after quality control, OTU picking and removal of chimeras, chloroplasts, mitochondria, and sequences not assigned to the Bacteria domain. OTU richness was by far highest in the sediment biotope and lowest in S. carteri (Online
Resource 2). The most abundant phylum overall was
Proteobacteria where mean relative abundance ranged from 23.6 ± 2.9% in X. testudinaria to 80.3 ± 1.8% in S. carteri
(Online Resource 3). Chloroflexi were most abundant in
A. suberitoides (30.5 ± 10.6%) and X. testudinaria (33.0 ± 6.0%), but represented less than 1% of sequences in S. carteri, sediment, and seawater. The same held for Actinobacteria, which represented 16.0 ± 7.8 of A. suberitoides sequences and 22.7 ± 3.2% of X. testudinaria sequences. The mean abundance of Actinobacteria in the other biotopes ranged from 0.1 ± 0.1 in S. carteri to 2.4 ± 1.5 in sediment. Bacteroidetes were most abundant in sediment (8.2 ± 2.4) and seawater (20.8 ± 26.6) but represented less than 1% of sequences in all sponge biotopes. Although highly variable within biotope sam-ples, Cyanobacteria abundance was highest in S. carteri (9.0 ± 6.9) and seawater (9.9 ± 11.9) and much lower in sediment (1.5 ± 0.1), A. suberitoides (0.7 ± 0.6), and X. testudinaria (1.5 ± 1.5).
Higher taxon abundance
In line with the phylum-level results, there were marked dif-ferences in the abundance of selected classes and orders
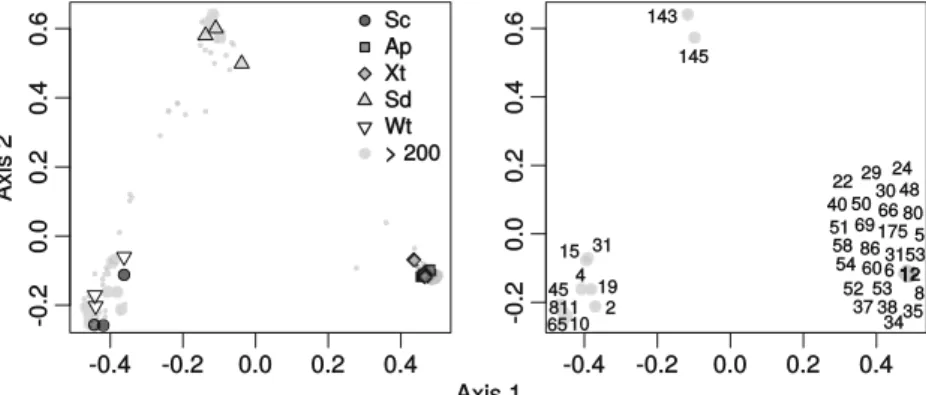
Fig. 6 Ordination showing the first two axes of the PCO analysis. a. Symbols represent samples from S. carteri (Sc), A. suberitoides (Ap), X. testudinaria (Xt), sediment (Sd), and seawater (Wt). b. Ordination
showing only the most abundant OTUs. Numbers represent dominant (≥ 200 sequence reads) OTUs referred to in Table1. Small circles represent OTUs <200 sequence reads
Ta b le 1 List of abundant (≥ 200 seq u ence re ad s) OT Us an d close ly re la te d o rg an isms ident ifi ed using BLA ST se ar ch. OT U : O TU number; Sum: number of sequence reads; Gr oup : biotop e o r b iotopes wh ere the OTUs were found; GI : G enInfo sequence identifiers of closely related or ganisms identified u sing BLAS T ; Se q : sequence similarity of these o rganis m s w ith our repres entative O TU se quences; Sou rce : isolation source of or ganis m s identified us ing BLAST ; Loc a ti on: sampling location of or gani sms identified u sing BLAST OTU Sum Gro u p P hylum Clas s O rder Fa mily Genus GI Seq S ource Location 2 4 30 Ge n C y ano ba ct er ia Syn ec ho coc coph yc ide ae S yne ch oc oc ca le s S yne ch oc oc ca ce ae Syn ec ho coc cus 28, 557 ,44 3 9 9.7 6 O li gotr op hic oc ea nic water ? 44 1 1 0 S c a Pr ote oba ct er ia De lta pr ote o b ac te ria NB1-j N B1-i Un as sign ed 4 07, 912 ,99 2 9 9 .5 4 S pon ge : S ty lis sa ca rte ri S audi Ara b ia 10 27 42 Sc a Pr ote oba ct er ia Ga mm ap rot eob ac te ria C hr oma tia le s U na ssi gne d U n as sign ed 4 07, 913 ,00 0 1 0 0 S pon ge : S ty lis sa ca rte ri S audi Ara b ia 12 29 79 Ap Xt a Ac tin o b ac te ria A cidim icr ob iia Acid imic ro bia le s wb 1_ P0 6 U na ss ig ne d 7 6 8 ,0 2 8 ,4 76 99 .7 7 Co ra l: P or ite s lu tea C hin a: H ain an 15 2 8 7 W t B ac te ro id ete s Fla v o b ac te ri ia Flav oba ct er ia les C ry omor ph ac ea e U n as sign ed 3 47, 439 ,96 7 1 0 0 S ea wat er C h ina : F ujia n 19 1 1 45 Sc Nitro spi ra e N it ro spi ra N itr os pir ale s N itr os pir ac ea e Un as sign ed 5 97, 437 ,72 4 1 0 0 S pon ge : A xin ell a sp C h ina 22 14 97 Ap Xt Pr ote oba ct er ia Ga mm ap rot eob ac te ria T hio tr ich ale s Pisc iri ck ett sia ce ae U n as sign ed 5 1 1 ,630 ,20 6 9 9 .5 5 S pon ge : V ac el etia cr ypt a A ust ralia:Great Barrier Re ef 2 4 87 1 A pXt a Acti nob ac ter ia A ci d imic ro b iia Ac idim icr o b ial es TK06 Un as sign ed 7 68, 028 ,61 3 9 9 .5 3 C or al: P o rit es lu te a C h ina : H ai na n 29 14 47 Ap Xt Ch lor o fl ex i S AR202 Una ssi gne d U na ssi gne d U n as sign ed 3 50, 627 ,60 3 9 9 .2 9 S pon ge : X es tosp ong ia testudinaria Ind one si a: M an ado 30 6 4 2 A p P ro te oba ct er ia Al pha pr ote o b ac ter ia Una ssi gne d U na ssi gne d U n as sign ed 3 45, 330 ,45 1 9 9 .7 6 S pon ge : R hop alo eid es od or ab ile Australia: Gre at Ba rr ie r Re ef 31 4 3 9 W t B ac te ro id ete s Fla v o b ac te ri ia Flav oba ct er ia les C ry omor ph ac ea e U n as sign ed 5 86, 599 ,15 2 1 0 0 S hr imp p ond Ch ina : Fujia n P ro vin ce 3 4 48 8 A pXt a Ch lor ofl ex i T K1 7 ml e1 –48 Una ssi gne d U n as sign ed 5 26, 300 ,04 0 9 8 .8 2 S pon ge : A ply sin a cauliformis Be liz e: Ca rr ie Bo w C ay 3 5 50 1 A pXt a Ch lor o fl ex i S AR202 Una ssi gne d U na ssi gne d U n as sign ed 6 78, 605 ,86 1 9 9 .7 6 S pon ge : A str o sc le ra wil ley an a Australia:Gre at Ba rr ie r Re ef 3 7 61 6 A pXt a Chlorofl exi Anaerolinea e C aldilineales C ald ilineaceae Unas sign ed 526, 299,835 99.7 6 S ponge: A plysina cauliformis Be liz e: Ca rr ie Bo w C ay 38 5 0 4 A p X t A cid oba ct er ia Ac id oba ct er ia-6 BPC01 5 Una ssi gne d U n as sign ed 4 51, 354 ,03 0 9 9 .3 3 S pon ge : Ir ci n ia str obi lina B ah am as:Swee tin g’ sC ay 40 4 30 X t a Gemm at imon ad ete s Ge mm -4 Una ssi gne d U na ssi gne d U n as sign ed 4 00, 269 ,35 2 9 9 .5 5 S pon ge : X es tosp ong ia testudinaria Australia: Gre at Ba rr ie r Re ef 45 8 2 9 S cW t P ro te oba ct er ia Al pha pr ote o b ac ter ia Rick et tsia le s P ela g ib ac te ra ce ae Un as sign ed 7 32, 664 ,60 4 1 0 0 B ott o m se aw ate r Atla ntic se dim en ta ry ab yssal p la in 48 2 84 X t a Pr ote oba ct er ia Ga mm ap rot eob ac te ria T hio tr ich ale s Pisc iri ck ett sia ce ae U n as sign ed 3 50, 627 ,62 0 9 9 .7 8 S pon ge : X es tosp ong ia testudinaria Ind one si a: M an ado 50 6 0 9 A p X t P ro te oba ct er ia Ga mm ap rot eob ac te ria C hr oma tia le s E ct oth ior hod osp ira ce ae Un as sign ed 4 51, 353 ,95 4 9 9 .7 8 S pon ge : Ir ci n ia str obi lina B ah am as:Ex u m as 5 1 28 6 A pXt a Pr ote oba ct er ia Al pha pr ote o b ac ter ia Rhod osp iri lla les R hod osp iri lla ce ae Un as sign ed 4 51, 354 ,03 7 9 9 .7 6 S pon ge : Ir ci n ia fe lix Ba ha ma s:Exu ma s 52 4 8 4 A p X t P ro te oba ct er ia Ga mm ap rot eob ac te ria C hr oma tia le s U na ssi gne d U n as sign ed 6 78, 605 ,84 8 9 9 .3 3 S pon ge : A str o sc le ra wil ley an a Australia:Gre at Ba rr ie r Re ef 5 3 43 2 A pXt a Pr ote oba ct er ia Al pha pr ote o b ac ter ia Rhod osp iri lla les R hod osp iri lla ce ae Un as sign ed 6 78, 605 ,87 6 9 9 .5 3 S pon ge : A str o sc le ra wil ley an a Australia:Gre at Ba rr ie r Re ef 54 2 88 A p a Gemm at imon ad ete s Ge mm -4 Una ssi gne d U na ssi gne d U n as sign ed 2 88, 730 ,91 5 9 8 .6 6 S pon ge : T he one lla swi nho ei Ch ina :South C h ina Sea 5 8 51 2 A pXt a Acti nob ac ter ia A ci d imic ro b iia Ac idim icr o b ial es Una ssi gne d U n as sign ed 3 50, 627 ,57 8 9 9 .2 9 S pon ge : X es tosp ong ia testudinaria Ind one si a: M an ado 60 3 1 7 A p X t S BR109 3 E C21 4 Una ssi gne d U na ssi gne d U n as sign ed 3 15, 020 ,32 7 9 9 .5 4 S pon ge : X es tosp ong ia testudinaria Ind one si a: M an ado 65 2 73 S c a Pr ote oba ct er ia Ga mm ap rot eob ac te ria T hio h al or ha bda le s U na ssi gne d U n as sign ed 4 07, 912 ,99 3 9 7 .9 1 S pon ge : S ty lis sa ca rte ri S audi Ara b ia 66 5 3 2 A p X t P ro te oba ct er ia Al pha pr ote o b ac ter ia Rhod osp iri lla les R hod osp iri lla ce ae Un as sign ed 6 78, 605 ,85 1 9 9 .7 6 S pon ge : A str o sc le ra wil ley an a Australia:Gre at Ba rr ie r Re ef 6 9 26 7 A pXt a Ch lor o fl ex i S AR202 Una ssi gne d U na ssi gne d U n as sign ed 3 50, 627 ,63 5 9 9 .5 3 S pon ge : X es tosp ong ia testudinaria Ind one si a: M an ado
(Fig. 5). Sequences assigned to the Chloroflexi classes SAR202 and Anaerolineae and the order Caldilineales were largely restricted to A. suberitoides and X. testudinaria. The abundance of Gammaproteobacteria was greatest in S. carteri, largely due to the prevalence of OTUs assigned to the order Chromatiales. The class Deltaproteobacteria was most abun-dant in S. carteri and sediment, largely due to the order
NB1− j in both biotopes and Desulfobacterales in sediment.
Dominance was by far greatest in S. carteri with a mean of 47.4% ± 15.5 of sequences assigned to the most abundant OTU. In contrast, dominance was lowest in sediment with a mean of only 4.4% ± 1.7 of sequences assigned to the most abundant OTU.
Importance of biotopes in structuring composition There was a highly significant difference in bacterial
compo-sition among biotopes (F3,8= 13.07, P < 0.001, R
2
= 0.839). Variation among biotopes thus explained almost 84% of the variation in composition. In the PCO ordination of the first
two axes (Fig.6), there are three distinct clusters, namely: a
cluster of samples from A. suberitoides and X. testudinaria, a cluster of samples from sediment and a cluster of samples from S. carteri and seawater. The main axis (axis 1) separated samples of A. suberitoides and X. testudinaria from samples of S. carteri and seawater. The second axis (axis 2) separated all these samples from samples of sediment. For the purposes
of this study, a total of 36 OTUs were considered abundant (≥
200 sequences). Only two abundant OTUs were associated with sediment. OTU-143 was restricted to sediment samples and closely related (>99% sequence similarity) to an organism
obtained from marine sediment in the Philippines (Table1).
OTU-145 was mainly found in sediment in this study, but had 100% sequence similarity with an organism previously ob-tained from the sponge Rhabdastrella globostellata in Guam. A number of OTUs were mainly found in seawater and S. carteri. This included OTU-45 that was related to an organism previously found in bottom seawater of the Atlantic abyss and OTU-811 that was related to an organism previous-ly found in Croatian marine lake water. Most of the abundant O T U s w e r e a s s o c i a t e d w i t h A . s u b e r i t o i d e s a n d X. testudinaria and were often absent in other biotopes. This mainly included OTUs previously isolated from sponges and corals (e.g., OTUs 12 and 24). Most of these OTUs were shared between both sponge species although one (OTU-54) was restricted to A. suberitoides and three to X. testudinaria ( O T U s 4 5 , 4 8 a n d 6 5 8 ) . O T U s 4 0 ( r e s t r i c t e d t o X. testudinaria) and 54 (restricted to A. suberitoides) were both assigned to the phylum Gemmatimonadetes.
The third PCO axis mainly separated S. carteri samples from seawater samples. OTUs associated with and restricted to S. carteri included OTUs 4, 10, and 65 all of which were related to organisms previously obtained from S. carteri in the
Ta b le 1 (continued ) OTU Sum Gro u p P hylum Clas s O rder Fa mily Genus GI Seq S ource Location 80 2 5 9 A p X t P ro te oba ct er ia De lta pr ote o b ac te ria Synt rop hob ac te ra le s S yntr o p hob ac te ra ce ae Un as sign ed 4 51, 353 ,96 1 9 9 .5 5 S pon ge : Ir ci n ia fe lix B ah am as:Ex u m as 86 2 0 9 A p X t P ro te oba ct er ia De lta pr ote o b ac te ria [E n tot heo n ella les ] Una ssi gne d U n as sign ed 4 51, 354 ,00 9 9 8 .4 4 S pon ge : Ir ci n ia str obi lina B ah am as :Sweeting ’sC ay 143 2 48 S d a Proteobacteria Gamm aprot eobacteria Thiot richales Thiotrichaceae Unas si gned 270, 282,857 99.7 7 M arine sediments Ph ilippines: Bol inao 145 2 44 S d P rote oba ct er ia Al pha pr ote ob ac ter ia Rhod oba ct er al es Rhod oba ct er ac ea e U n as sign ed 5 76, 235 ,56 8 1 00 S pon ge : R hab da str ell a gl obo ste lla ta Guam 1 7 5 28 9 A pXt a Ch lor ofl ex i S AR202 Una ssi gne d U na ssi gne d U n as sign ed 3 45, 330 ,25 0 9 9.5 3 S pon ge : R hop alo eid es od or ab ile Australia: Gre at Ba rr ie r Re ef 658 3 76 X t a Chlorofl exi Anaerolineae C aldilineales C aldilin eaceae Unas signed 350, 627,590 99.76 S ponge: Xes tospongia testudinaria Ind one si a: M an ado 81 1 7 48 Sc Wt Cy ano ba ct er ia S yn ec ho coc coph yc ide ae S yne ch oc oc ca le s S yne ch oc oc ca ce ae Syn ec ho coc cus 7 00, 288 ,66 6 1 00 S al ine lak e w at er Cr oa tia 31 5 3 25 0 A pXt A ct in o b ac te ria A cidim icr ob iia Acid imic ro bia le s wb 1_ P0 6 U na ss ig ne d 2 2 6 ,4 25 ,3 11 99 .5 3 Sp o n g e: X es to sp o n g ia mu ta USA: Key Lar go, F lo ri da ares tricted to group
Red Sea (Fig.7and Table1). OTUs 15 and 31, which were associated with seawater samples, were related to organisms previously obtained from shrimp pond and seawater samples in China. The fourth axis mainly separated samples of A. suberitoides and X. testudinaria.
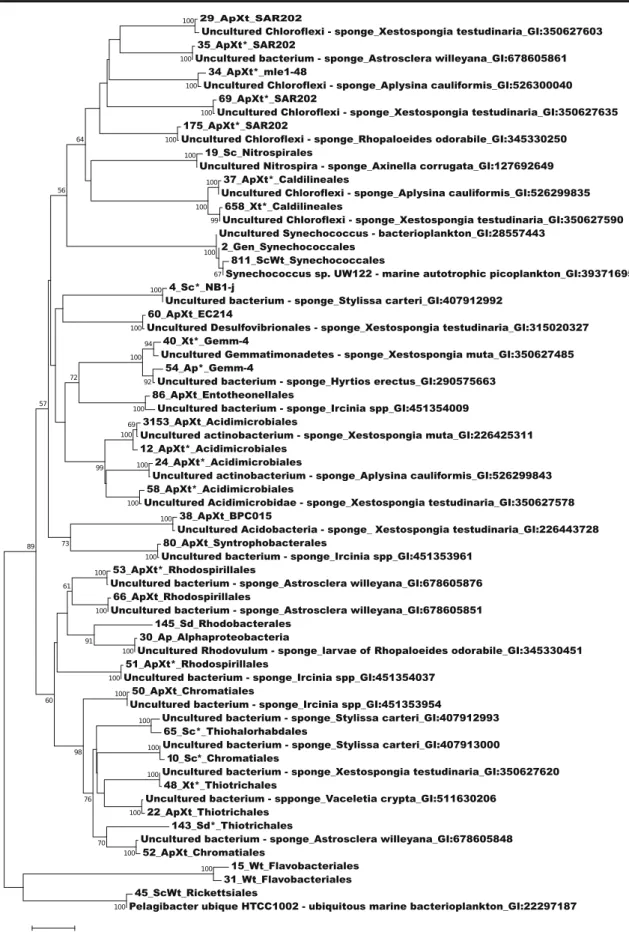
In general, most of the sponge OTUs analysed here were either detected in more than one sponge biotope or were close-ly related to bacterial phylotypes associated with different
sponge host species (Table 1 and Fig. 8). For example,
A. suberitoides and X. testudinaria shared dominant bacterial
symbionts (ApXt in Table1) closely related to bacterial
phy-lotypes previously identified in a range of sponge hosts (Xestospongia muta, Aplysina cauliformis, Ircinia spp., Rhopaloeides odorabile, Astrosclera willeyana, and Vaceletia crypta) in different geographical locations. Most abundant sponge OTUs were closely related to sponge bacte-rial symbionts from other studies from different sponge spe-cies. However, a few abundant OTUs, selectively enriched in X. testudinaria or S. carteri (OTUs 4, 10, 48, 65, and 658), may represent sponge species specific associations.
Discussion
In line with previous studies (Cleary et al.2015; de Voogd et al.
2015), the sediment biotope proved to be the richest. OTUs in
sediment were mainly assigned to the Proteobacteria, but there were substantial numbers of OTUs assigned to other taxa includ-ing Actinobacteria, Bacteroidetes, and Acidobacteria, among others. OTUs assigned to the proteobacterial order Desulfobacterales were also restricted to sediment. The Desulfobacterales order consists of anaerobic bacteria known to
use sulphate as terminal electron acceptor in order to oxidate H2
and a wide range of organic compounds. They also have been shown to play an important role in degrading organic contami-nants and appear to be sensitive to predicted shifts in ocean pH
(Coelho et al.2015; Muyzer and Stams2008; Zhou et al.2011).
Proteobacteria also proved to be the most abundant phylum in S. carteri and in two of the three seawater and A. suberitoides samples. In contrast, Chloroflexi and Actinobacteria were more prevalent in samples of X. testudinaria. The dominance of Proteobacteria in S. carteri is in line with previous studies of this species in a different region within Indonesia (Cleary et al.
2015) and of the closely related S. massa in the Jakarta
Bay-Thousand Islands reef complex (de Voogd et al.2015). LMA
sponges, such as S. carteri, have been shown to host bacterial communities with limited phylum-level diversity when com-pared to HMA species. They are also known to filter large volumes of water, which can explain the presence of large numbers of OTUs found in water and the higher similarity between seawater and S. carteri bacterial communities (Giles
et al.2013; Weisz et al.2008).
The prevalence of Chloroflexi in X. testudinaria in the pres-ent study agrees with previous studies of the species in other regions including the Red Sea, Celebes Sea, and Great Barrier Reef where Acidobacteria, Actinobacteria and particularly Chloroflexi were the most abundant phyla in terms of OTUs
and sequences (Lee et al.2011; Montalvo et al.2014; Montalvo
and Hill2011). It, however, contrasts with two of our previous
studies (Cleary et al. 2015; de Voogd et al. 2015) where
Proteobacteria were more abundant in terms of OTUs and se-quence reads although both of these studies also contained a large number of OTUs assigned to the Chloroflexi. Previous studies have also identified Chloroflexi as a consistent compo-nent of the bacterial communities of HMA sponges (Gloeckner
et al.2014; Schmitt et al.2011).
In the present study, OTUs assigned to the Chloroflexi were mainly assigned to the o rders SAR202 and Anaerolineae. Members of the SAR202 have been found to be relatively abundant in bathypelagic waters (Varela et al.
2008). Anaerolinae members have been found in a wide range
of habitats from artic permafrost to tropical marine sediment and the mammalian gastrointestinal tract (Campbell et al.
2014; Hug et al.2013). Campbell et al. (2014) proposed that
Anaerolinae in humans occupy an ecological niche where they
Fig. 7 Ordination showing the third and fourth axes of the PCO analysis. a. Symbols represent samples from S. carteri (Sc), A. suberitoides (Ap), X. testudinaria (Xt), sediment (Sd), and seawater (Wt). b. Ordination
showing only the most abundant OTUs. Numbers represent dominant (≥ 200 sequence reads) OTUs referred to in Table1. Small circles represent OTUs <200 sequence reads
Fig. 8 Phylogenetic tree of the bacterial 16S rRNA gene sequences recovered from S. carteri, A. suberitoides, X. testudinaria, sediment, and seawater from the Misool coral reef system. Bootstrap values lower
than 50% were omitted. The number of each OTU is indicated as are GenInfo sequence identifiers of sequences obtained using BLAST
scavenge material from lysed bacterial cells and human tissue. In sponges, they may occupy a similar niche whereby they exploit the high loss of sponge biomass due to rapid sponge
cell turnover (de Goeij et al.2013).
Seawater samples mainly consisted of OTUs assigned to Proteobacteria, Bacteroidetes, and Cyanobacteria. Alphaproteobacteria were most abundant in seawater samples and mainly consisted of OTUs assigned to the orders R i c k e t t s i a l e s a n d R h o d o b a c t e r a l e s . T h e o r d e r Flavobacteriales was also mainly found in seawater samples. This result follows numerous studies that have found a prev-alence of Proteobacteria (mainly Alphaproteobacteria) and
Bacteroidetes in the bacterioplankton (Glöckner et al.1999).
S. carteri and seawater samples clustered together in the PCO ordination as did A. suberitoides and X. testudinaria samples. With respect to S. carteri and seawater, this confirms previous studies highlighting the similarity of LMA sponges
and seawater (Giles et al.2013; Weisz et al.2008). However, it
should be noted that, although similar, samples of S. carteri were still distinct from seawater samples as seen in the ordi-nation of the third and fourth axes. Stylissa carteri also contained highly abundant OTUs that were either much more abundant in or restricted to S. carteri. These OTUs were also closely related to organisms previously obtained from S. carteri samples in Saudi Arabia or Axinella, which were previously placed in the same order (Halichondrida).
The similarity in bacterial symbiont composition between A. suberitoides and X. testudinaria is interesting. These spe-cies are otherwise very different, e.g., their outer morphology, skeletal architecture and phylogenetic relationship. For in-stance, A. suberitoides has a massive to lobate growth form, whereas X. testudinaria is barrel shaped. However, the skele-ton of both sponge species, is composed of high densities of silicious spicules, albeit of different size dimensions and mor-phologies. The similarity in the composition of their bacterial symbionts is thus in line with the theory that the internal sponge morphology is an important determinant whether a sponge hosts a HMA- or LMA-type bacterial community
(Gloeckner et al.2014; Vacelet and Donadey 1977; Weisz
et al.2008).
This is, to the best of our knowledge, the first study of the bacterial community of A. suberitoides, a relatively abundant, widespread and easily recognisable sponge species. Recently, the higher classification of sponges has been altered and some sponge orders have been abandoned (Morrow and Cárdenas
2015). Previously, the genus Aaptos (order Suberitida, family
Suberitidae) was place within the order Hadromerida, which contained HMA sponges, such as Spheciospongia vesparium (currently order Clionaida; family Clionaidae) and LMA sponges such as Suberites domuncula (currently order Suberitida, family Suberitidae) and Suberites diversicolor
(Cleary et al. 2013). Gloeckner et al. (2014) previously
showed that although certain sponge taxa such as the orders
Agelasida and Verongida only consisted of HMA species and the Poecilosclerida of LMA species, other taxa such as the Haplosclerida, Homoscleromorpha, and Dictyoceratida in-cluded both LMA and HMA species.
In conclusion, the present study confirms that sponges har-bour microbial communities that are distinct from communi-ties in sediment and the surrounding seawater. This finding extends to LMA sponges as demonstrated by S. carteri in this study. Although the bacterial communities of S. carteri and seawater were similar, they were still distinct with S. carteri hosting a small number of highly abundant OTUs including OTUs restricted to this sponge. Our study also showed that the hitherto unknown bacterial community of A. suberitoides is very similar to the known HMA sponge X. testudinaria pro-viding evidence that A. suberitoides might also be a HMA sponge. Although both A. suberitoides and X. testudinaria shared numerous OTUs, they also hosted what may be species-specific OTUs.
Acknowledgements Funding for the present study was provided by grants to the projects LESS CORAL (PTDC/AAC-AMB/115304/2009), Ecotech-Sponge (PTDC/BIA-MIC/6473/2014 - POCI-01-0145-FEDER-016531) and to CESAM (UID/AMB/50017– POCI-01-0145-FEDER-007638) by FCT/MEC through national funds and co-funding by FEDER within the PT2020 Partnership Agreement and Compete 2020. The Netherlands Organisation for Scientific Research provided funding t o L E B t h r o u g h t h e g r a n t R U B I C O N # 8 2 5 . 1 2 . 0 0 7 a n d VENI#863.14.020. We are grateful for the support in the field by Misool Eco Resort, Andy Miners, Dadi, Christiaan de Leeuw, and The Nature Conservancy.
Compliance with ethical standards
Funding Funding for the present study was provided by grants to the projects LESS CORAL (PTDC/AAC-AMB/115304/2009), Ecotech-Sponge (PTDC/BIA-MIC/6473/2014 - POCI-01-0145-FEDER-016531) and to CESAM (UID/AMB/50017– POCI-01-0145-FEDER-007638) by FCT/MEC through national funds and co-funding by FEDER within the PT2020 Partnership Agreement and Compete 2020. The Netherlands Organisation for Scientific Research provided funding to LEB through the grant RUBICON #825.12.007 and VENI#863.14.020. Fieldwork was supported by Ristek and LIPI, Indonesia.
Conflict of interest The authors declare that they have no conflicts of interest.
References
Akiyama T, Takada K, Oikawa T, Matsuura N, Ise Y, Okada S, Matsunaga S (2013) Stimulators of adipogenesis from the marine sponge Xestospongia testudinaria. Tetrahedron 69:6560–6564. doi: 10.1016/j.tet.2013.06.007
Allen GR (2008) Conservation hotspots of biodiversity and endemism for indo-Pacific coral reef fishes. Aquat Conserv Mar Freshwat Ecosyst 18:541–556
Allen GR, Erdmann MV (2009) Reef fishes of the bird’s head peninsula, West Papua, Indonesia. Check List 5:587–628
Aoki S, Kong D, Suna H, Sowa Y, Sakai T, Setiawan A, Kobayashi M (2006) Aaptamine, a spongean alkaloid, activates p21 promoter in a p53-independent manner. Biochem Bioph Res Commun 342:101– 106. doi:10.1016/j.bbrc.2006.01.119
Becking LE, de Leeuw C, Vogler C (2014) Newly discovered "jellyfish lakes" in Misool, Raja Ampat, Papua, Indonesia. Mar Biodivers 45: 597–598
Bellwood DR, Hughes TP, Folke C, Nyström M (2004) Confronting the coral reef crisis. Nature 429:827–833
Borchiellini C, Manuel M, Alivon E, Boury-Esnault N, Vacelet J, Le Parco Y (2001) Sponge paraphyly and the origin of Metazoa. J Evol Biol 14:171–179. doi:10.1046/j.1420-9101.2001.00244.x Bruno JF, Selig ER (2007) Regional decline of coral cover in the
indo-Pacific: timing, extent, and subregional comparisons. PLoS One 2: e711
Campbell AG, Schwientek P, Vishnivetskaya T, Woyke T, Levy S, Beall CJ, Griffen A, Leys E, Podar M (2014) Diversity and genomic insights into the uncultured Chloroflexi from the human microbiota. Environ Microbiol 16:2635–2643. doi:10.1111/1462-2920.12461 Capone DG, Dunham SE, Horrigan SG, Duguay LE (1992) Microbial
nitrogen transformations in unconsolidated coral reef sediments. Mar Ecol Prog Ser 80:75–88
Cleary DFR (2003) An examination of scale of assessment, logging and ENSO-induced fires on butterfly diversity in Borneo. Oecologia 135:313–321. doi:10.1007/s00442-003-1188-5
Cleary DFR, Becking LE, de Voogd NJ, Pires ACC, Polónia ARM, Egas C, Gomes NCM (2013) Habitat- and host-related variation in sponge bacterial symbiont communities in Indonesian waters. FEMS Microbiol Ecol 85:465–482. doi:10.1111/1574-6941.12135 Cleary DFR, de Voogd NJ, Polónia ARM, Freitas R, Gomes NCM (2015)
Composition and predictive functional analysis of bacterial commu-nities in seawater, sediment and sponges in an Indonesian coral reef environment. Microb Ecol 70:889–903
Coelho FJ, Cleary DFR, Rocha RJ, Calado R, Castanheira JM, Rocha et al (2015) Unraveling the interactive effects of climate change and oil contamination on laboratory-simulated estuarine benthic com-munities. Glob Chang Biol 21:1871–1886
De’ath G, Fabricius KE, Sweatman H, Puotinen M (2012) The 27-year decline of coral cover on the Great Barrier reef and its causes. Proc Natl Acad Sci U S A 109:17995–17999
de Goeij JM, van Oevelen D, Vermeij MJ, Osinga R, Middelburg JJ, de Goeij AF, Admiraal W (2013) Surviving in a marine desert: the sponge loop retains resources within coral reefs. Science 342:108– 110. doi:10.1126/science.1241981
de Voogd NJ, Cleary DFR (2008) An analysis of sponge diversity and dis-tribution at three taxonomic levels in the Thousand Islands/Jakarta Bay reef complex, West-java, Indonesia. Mar Ecol 29:205–215
de Voogd NJ, Cleary DFR (2009) Variation in sponge composition among Singapore reefs. Raffles B Zool Suppl 22:59–67
de Voogd NJ, Cleary DFR, Hoeksema BW, Noor A, van Soest RWM (2006) Sponge beta diversity in the Spermonde archipelago, SW Sulawesi, Indonesia. Mar Ecol Prog Ser 309:131–142. doi:10. 3354/meps309131
de Voogd NJ, Cleary DFR, Polónia ARM, Gomes NCM (2015) Bacterial community composition and predicted functional ecology of sponges, sediment and seawater from the thousand islands reef com-plex, West java, Indonesia. FEMS Microbiol Ecol 91:1–12. doi:10. 1093/femsec/fiv019
Ebada SS, Linh MH, Longeon A, de Voogd NJ, Durieu E, Meijer L, Bourguet-Kondracki ML, Singab AN, Müller WE, Proksch P (2015) Dispacamide E and other bioactive bromopyrrole alkaloids from two Indonesian marine sponges of the genus Stylissa. Nat Prod Res 29:231–238. doi:10.1080/14786419.2014.947496
Edgar RC (2013) UPARSE: highly accurate OTU sequences from micro-bial amplicon reads. Nat Methods 10:996–998
Edgar R, Haas B, Clemente J, Quince C, Knight R (2011) UCHIME improves sensitivity and speed of chimera detection. Bioinformatics 27:2194–2200
Faulkner DJ (2002) Marine natural products. Nat Prod Rep 19:1–48. doi: 10.1039/b009029h
Flatt PM, Gautschi JT, Thacker RW, Musafija-Girt M, Crews P, Gerwick WH (2005) Identification of the cellular site of polychlorinated pep-tide biosynthesis in the marine sponge Dysidea (Lamellodysidea) herbacea and symbiotic cyanobacterium Oscillatoria spongeliae by CARD-FISH analysis. Mar Biol 147:761–774. doi:10.1007/ s00227-005-1614-9
Freeman CJ, Thacker RW (2011) Complex interactions between marine sponges and their symbiotic microbial communities. Limnol Oceanogr 56:1577–1586. doi:10.4319/lo.2011.56.5.1577
Giles C, Kamke J, Moitinho-Silva L, Taylor MW, Hentschel U, Ravasi T, Schmitt S (2013) Bacterial community profiles in low microbial abundance sponges. FEMS Microbiol Ecol 83:232–241
Giles EC, Saenz-Agudelo P, Hussey NE, Ravasi T, Berumen ML (2015) Exploring seascape genetics and kinship in the reef sponge Stylissa carteri in the Red Sea. Ecol Evol 5:2487–2502. doi:10.1002/ece3. 1511
Glöckner FO, Fuchs BM, Amann R (1999) Bacterioplankton composi-tions of lakes and oceans: a first comparison based on fluorescence in situ hybridization. Appl Environ Microbiol 65:3721–3726 Gloeckner V, Wehrl M, Moitinho-Silva L, Gernert C, Schupp P, Pawlik
JR et al (2014) The HMA-LMA dichotomy revisited: an electron microscopical survey of 56 sponge species. Biol Bull 227:78–88 Gomes NCM, Heuer H, Schönfeld J, Costa RS, Mendonça-Hagler LCS
et al (2001) Bacterial diversity of the rhisosphere of maize (Zea mays) grown in tropical soil studied by temperature gradient gel electrophoresis. Plant Soil 232:167–180. doi:10.1023/A: 1010350406708
Gomes NCM, Cleary DFR, Pinto FN, Egas C, Almeida A, Cunha A, Mendonça-Hagler LCS, Smalla K (2010) Taking root: enduring effect of rhisosphere bacterial colonization in mangroves. PLoS One 5:e14065-a
Grantham HS, Agostini VN, Wilson J, Mangubhai S, Hidayat N, Muljadi A et al (2013) A comparison of zoning analyses to inform the plan-ning of a marine protected area network in Raja Ampat. Indones Mar Policy 38:184–194
Hentschel U, Fieseler L, Wehrl M, Gernert C, Steinert M, Hacker J, Horn M (2003) Microbial diversity of marine sponges. In: Muller WE (ed) Sponges (Porifera). Springer-Verlag, Heidelberg, pp 59–88 Hentschel U, Usher KM, Taylor MW (2006) Marine sponges as microbial
fermenters. FEMS Microbiol Ecol 55:167–177
Huang YM, de Voogd NJ, Cleary DFR, Li TH, Mok HK, Ueng JP (2016) Biodiversity pattern of Subtidal sponges (Porifera: Demospongiae) in the Penghu archipelago (Pescadores), Taiwan. J Mar Biol Assoc UK 96:417–427. doi:10.1017/S002531541500017X
Hug LA, Castelle CJ, Wrighton KC, Thomas BC, Sharon I, Frischkorn KR, Williams KH, Tringe SG. Banfield JF (2013) Community ge-nomic analyses constrain the distribution of metabolic traits across the Chloroflexi phylum and indicate roles in sediment carbon cy-cling. Microbiome 1:1 - 22. doi:10.1186/2049-2618-1-22. Jin M, Zhao W, Zhang Y, Kobayashi M, Duan H, Kong D (2011)
Antiproliferative effect of aaptamine on human chronic myeloid leukemia K562 cells. Int J Mol Sci 12:7352–7359. doi:10.3390/ ijms12117352
Kamke J, Taylor MW, Schmitt S (2010) Activity profiles for marine sponge-associated bacteria obtained by 16S rRNA vs 16S rRNA gene comparisons. ISME J 4:498–508. doi:10.1038/ismej.2009.143 Larghi EL, Obrist BV, Kaufman TS (2008) A formal total synthesis of the marine alkaloid aaptamine. Tetrahedron 64:5236–5245. doi:10. 1016/j.tet.2008.03.036
Lee OO, Wang Y, Yang J, Lafi FF, Al-Suwailem A, Qian PY (2011) Pyrosequencing reveals highly diverse and species-specific
microbial communities in sponges from the Red Sea. ISME J 5:650– 664. doi:10.1038/ismej.2010.165
Legendre P, Gallagher E (2001) Ecologically meaningful transformations for ordination of species data. Oecologia 129:271–280. doi:10.1007/ s004420100716
Li CW, Chen JY, Hua TE (1998) Precambrian sponges with cellular structures. Science 279:879–882
Liang LF, Wang T, Cai YS, He WF, Sun P, Li YF, Huang Q, Taglialatela-Scafati O, Wang HY, Guo YW (2014) Brominated polyunsaturated lipids from the Chinese sponge Xestospongia testudinaria as a new class of pancreatic lipase inhibitors. Eur J Med Chem 79:290–297.
doi:10.1016/j.ejmech.2014.04.003
Liu C, Tang X, Li P, Li G (2012) Suberitine A-D, four new cytotoxic dimeric aaptamine alkaloids from the marine sponge Aaptos suberitoides. Org Lett 14:1994–1997. doi:10.1021/ol3004589 Mangubhai S, Erdmann MV, Wilson JR, Huffard CL, Ballamu F, Hidayat
NI, Hitipeuw C, Lazuardi ME et al (2012) Papuan Bird’s head sea-scape: emerging threats and challenges in the global center of marine biodiversity. Mar Pollut Bull 64:2279–2295
McMurray SE, Blum JE, Pawlik JR (2008) Redwood of the reef: growth and age of the giant barrel sponge Xestospongia muta in the Florida keys. Mar Biol 155:159–171
Moberg F, Folke C (1999) Ecological goods and services of coral reef ecosystems. Ecol Econ 29:215–233
Moitinho-Silva L, Bayer K, Cannistraci CV, Giles EC, Ryu T, Seridi L, Ravasi T, Hentschel U (2014) Specificity and transcriptional activity of microbiota associated with low and high microbial abundance sponges from the Red Sea. Mol Ecol 23:1348–1363. doi:10.1111/ mec.12365
Montalvo NF, Hill RT (2011) Sponge-associated bacteria are strictly maintained in two closely related but geographically distant sponge hosts. Appl Environ Microbiol 77:7207–7216. doi:10.1128/AEM. 05285-11
Montalvo NF, Davis J, Vicente J, Pittiglio R, Ravel J, Hill RT (2014) Integration of culture-based and molecular analysis of a complex sponge-associated bacterial community. PLoS One 9:e90517 Morrow C, Cárdenas P (2015) Proposal for a revised classification of the
Demospongiae (Porifera). Front Zool 12:1–7
Muyzer G, Stams AJM (2008) The ecology and biotechnology of sulphate-reducing bacteria. Nat Rev Microbiol 6:441–454 Oksanen J, Kindt R, Legendre P, O’Hara B, Simpson GL, Solymos P,
Wagner H (2009) Vegan: community ecology package. R Packag Vers 1:15–14 Retrieved from http://www.cran.r-project.org/ package=vegan
Pandolfi JM, Bradbury RH, Sala E, Hughes TP, Bjorndal KA, Cooke RG, McArdle D, McClenachan L, Newman MJ, Paredes G, Warner RR, Jackson JBC (2003) Global trajectories of the long-term decline of coral reef ecosystems. Science 301:955–958
Pham NB, Butler MS, Hooper JNA, Moni RW, Quinn RJ (1999) Isolation of xestosterol esters of brominated acetylenic fatty acids from the marine sponge Xestospongia testudinaria. J Nat Prod 62:1439–1442 Pham CD, Hartmann R, Müller WEG, de Voogd NJ, Lai D, Proksch P (2013) Aaptamine derivatives from the indonesian sponge Aaptos suberitoides. J Nat Prod 76:103–106. doi:10.1021/np300794b Polónia ARM, Cleary DFR, Freitas R, de Voogd NJ, Gomes NCM (2014)
The putative functional ecology and distribution of archaeal com-munities in sponges, sediment and seawater in a coral reef environ-ment. Mol Ecol 24:409–423. doi:10.1111/mec.13024
Prentice ML, Hope GS (2007) Climate of Papua. In: Marshall AJ, Beehler BM (eds) The ecology of Papua: part one. Periplus, Singapore, pp 177–196
Roberts CM, McClean CJ, Veron JE, Hawkins JP, Allen GR, McAllister DE et al (2002) Marine biodiversity hotspots and conservation pri-orities for tropical reefs. Science 295:1280–1284
Rohde S, Gochfeld D, Ankisetty S, Avula B, Schupp P, Slattery M (2012) Spatial variability in secondary metabolites of the indo-pacific sponge Stylissa massa. J Chem Ecol 38:463–475. doi:10.1007/ s10886-012-0124-8
Rützler K (2004) Sponges on coral reefs: a community shaped by com-petitive cooperation. Bollettino dei Musei e degli Instituti Biologici dell’Universita Di Genova 68:85–148
Schlappy ML, Schottner SI, Lavik G, Kuypers MM, de Beer D, Hoffmann F (2010) Evidence of nitrification and denitrification in high and low microbial abundance sponges. Mar Biol 157:593–602 Schmitt S, Deines P, Behman F, Wagner M, Taylor MW (2011) Chloroflexi bacteria are more diverse, abundant, and similar in high than in low microbial abundance sponges. FEMS Microbiol Ecol 78:497–510
van Soest RWM, Boury-Esnault N, Vacelet J, Dohrmann M, Erpenbeck D, de Voogd NJ, Santodomingo N, Vanhoorne B, Kelly M, Hooper JNA (2012) Global diversity of sponges (Porifera). PLoS One 7:1–23 Swierts T, Peijnenburg KTCA, de Leeuw C, Cleary DFR, Setiawan E,
Wörheide G, Erpenbeck D, de Voogd NJ (2013) Lock, stock and two different barrels: comparing the genetic composition of morphotypes of the indo-Pacific sponge Xestospongia testudinaria. PLoS One 8:1–12. doi:10.1371/journal.pone.0074396
Tamura K, Stecher G, Peterson D, Filipski A, Kumar S (2013) MEGA6: Molecular evolutionary genetics analysis version 6.0. Mol Biol Evol 30:2725-2729
Taylor MW, Radax R, Steger D, Wagner M (2007) Sponge-associated microorganisms: evolution, ecology, and biotechnological potential. Microbiol Mol Biol Rev 71:295–347. doi:10.1128/MMBR.00040-06 Tsukamoto S, Yamanokuchi R, Yoshitomi M, Sato K, Ikeda T, Rotinsulu H, Mangindaan REP, de Voogd NJ, van Soest RWM, Yokosawa H (2010) Aaptamine, an alkaloid from the sponge Aaptos suberitoides, functions as a proteasome inhibitor. Bioorg Med Chem Lett 20: 3341–3343. doi:10.1016/j.bmcl.2010.04.029
Vacelet J, Donadey C (1977) Electron microscope study of the association between some sponges and bacteria. J Exp Mar Biol Ecol 30:301–314 Varela MM, van Aken HM, Herndl GJ (2008) Abundance and activity of Chloroflexi-type SAR202 bacterioplankton in the meso- and bathy-pelagic waters of the (sub)tropical Atlantic. Environ Microbiol 10: 1903–1911. doi:10.1111/j.1462-2920.2008.01627.x
Vaz-Moreira I, Egas C, Nunes OC, Manaia CM (2011) Culture-dependent and culture-inCulture-dependent diversity surveys target different bacteria: a case study in a freshwater sample. Antonie Van Leeuwenhoek 100:245–257
Weisz JB, Lindquist N, Martens CS (2008) Do associated microbial abundances impact marine demosponge pumping rates and tissue densities. Oecologia 155:367–376. doi:10.1007/s00442-007-0910-0 Yu Y, Lee C, Kim J, Hwang S (2005) Group-specific primer and probe sets to detect methanogenic communities using quantitative real-time polymerase chain reaction. Biotechnol Bioeng 89:670–679 Zhang Z, Schwartz S, Wagner L, Miller W (2000) A greedy algorithm for
aligning DNA sequences. J Comput Biol 7:203–214
Zhou J, He Q, Hemme CL, Mukhopadhyay A, Hillesland K, Zhou A, He Z, Van Nostrand JD, Hazen TC, Stahl DA, Wall JD, Arkin AP (2011) How sulphate-reducing microorganisms cope with stress: lessons from systems biology. Nat Rev Microbiol 9:452–466. doi: 10.1038/nrmicro2575