1 UNIVERSIDADE DE LISBOA
FACULDADE DE CIÊNCIAS
DEPARTAMENTO DE BIOLOGIA VEGETAL
ΔNp63 is Critical for Progression of High Grade Non-Muscle Invasive Bladder
Cancer Through Deregulation of Specific Genetic Pathways
Andreia Filipa Garrido Maia
Mestrado de Biologia Molecular e Genética
Dissertação orientada por: Doutora Mireia Castillo-Martin
Professora Doutora Rita Maria Pulido Garcia Zilhão 2017
i Dedicatória e Agradecimentos
Dedico este trabalho à minha família, especialmente à minha mãe, Lídia Maia, e ao meu pai, Manuel Maia, por toda a educação que me transmitiram, por todos os esforços e sacrifícios e por estarem sempre do meu lado em qualquer circunstância da minha vida. Mostraram-me que ter uma família é ter amor, felicidade, compreensão e sei que devem estar tão orgulhosos de mim como eu deles. Nunca é tarde para lhes agradecer e proveito este momento para o fazer, Obrigada!
Dedico também este trabalho ao meu irmão gémeo, André Maia. Fomos inseparáveis até à faculdade, nascemos, crescemos, brincámos, lutávamos e estudámos sempre juntos. Agora, já adultos vivemos o sucesso um do outro como se fosse o nosso e ambos sabemos que irá ser sempre assim. O seu apoio emocional ajudou-me muito neste percurso.
Dedico este trabalho ao meu namorado e marinheiro, Filipe Dias, por tornar a minha vida muito mais fácil. Agradeço todo o apoio incondicional que me deu em todos os momentos, principalmente nos de incerteza, por todo o amor e paciência e por poder contar com a sua ajuda em qualquer circunstância da minha vida, pessoal e profissional, ainda que tenhamos um oceano entre nós.
Dedico este trabalho aos meus queridos amigos e agradeço-lhes por todo o apoio que me deram não só durante este percurso académico como em todas as ocasiões da minha vida. Agradeço às minhas melhores amigas à Ana Neves, à Inês Bento e à Joana Gameiro por todos estes anos de amizade. Agradeço às minhas amigas da licenciatura à Diana Santos, à Filipa Maia, à Daryna Piontkisvka e à minha afilhada, Inês Vale, pelos momentos felizes que vivemos. Agradeço à Marlene Cabral por todo o apoio que me deu. Agradeço aos amigos que conheci na Fundação Champalimaud, ao Bernardo Esteves, à Carolina Alves, à Magda Negrão, à Mafalda Ferreira e à Sara Correia por tornarem este ano uma experiência inesquecível. Agradeço às amigas que conheci no voleibol e que sei que posso contar com elas para sempre, à Marisa Magalhães e à Joana Silva, mas em especial à Alexandra Oliveira, por todo o tempo que perdeu a ler e corrigir este trabalho, mesmo sem ter tempo nenhum. Agradeço do fundo do coração às minhas queridas colegas de casa, Eva Cunha, Beatriz Correia e Ana Basílio, por todo o apoio emocional, mas principalmente à Eva por todos os conselhos e conhecimentos que me transmitiu.
Este trabalho não seria possível ser a ajuda de várias plataformas e grupos de investigação. Começo por agradecer ao laboratório do Bruno Costa-Silva, System Oncology group, por todo o material e equipamento que partilharam, só assim foi possível começar e terminar este trabalho. Agradeço em especial à Joana Maia não só pela amizade, mas também por todos os conhecimentos que me transmitiu. Agradeço também ao laboratório do Eduardo Moreno, Cell Fitness group, especialmente ao Andrea pela partilha de reagentes e protocolos que permitiram terminar algumas experiências. Agradeço ao laboratório da Rita Fior, Cancer and Telomerases group, pela partilha de linhas celulares, anticorpos e outros materiais de laboratório. Agradeço ao laboratório do Henrique Veiga-Fernandes, Immunophysiology group, por ter partilhado a linha celular HeLa e também a solução de luciferina que permitiu realizar os ensaios in vivo, no IMM. Agradeço à ‘Flow Cytometry Platform’ da Fundação Champalimaud por possibilitar a realização dos ensaios de ciclo celular, agradeço em especial à Ana Vieira por ser tão amável, por me esclarecer todas as minha dúvidas sobre citometria de fluxo e também pela sua amizade. Agradeço à ‘Molecular Biology Platform’ da Fundação Champalimaud, à Ana Cunha e à Raquel Tomás, por todo o trabalho experimental com o objetivo de produzir e isolar os lentivírus para a inativação do gene AGR2. Agradeço à Champalimaud
ii Advanced BioImaging and BioOptics Experimental Platform’ da Fundação Champalimaud por ter possibilitado obter as imagens da imunofluorescência neste trabalho.
Um obrigada muito especial à professora Rita Zilhão, minha orientadora interna na FCUL, por todo o apoio e positivismo. A professora foi incansável em esclarecer a todas as minhas dúvidas que muito ajudaram na realização deste trabalho.
E por último mas não menos importante, agradeço do fundo do coração à Mireia e ao Javier por me terem acolhido tão bem no seu laboratório. Nem mil obrigadas são suficientes para agradecer todos os novos conhecimentos, as novas técnicas e lições de vida que aprendi com eles. Muito obrigada pela paciência, pelas gargalhadas e pela boa disposição. Não foi nada fácil começar este projeto e infelizmente vivemos momentos de grandes angústias e incertezas, no entanto é com grande satisfação que conseguimos juntos terminar este trabalho. Muito obrigada por me terem possibilitado esta experiência e graças a vocês entrego esta tese com muito orgulho no trabalho concluído.
iii Resumo
Cancro da bexiga é o nono tumor mais comum a nível mundial, com uma estimativa de 429 000 novos casos registados, em 2012, e aproximadamente 165 000 mortes registadas, nesse mesmo ano, em todo o mundo. Os parâmetros clínicos e patológicos usados para avaliar o estádio do cancro da bexiga têm elevadas limitações e até à data ainda não existe nenhum biomarcador que preveja o comportamento tumoral em cada paciente. Por este motivo, é essencial a identificação de novos biomarcadores que estejam envolvidos na progressão tumoral e que permitam reconhecer diferentes tumores de acordo com a sua capacidade progressiva e invasiva. A classificação dos diferentes subtipos de tumor da bexiga permitirá desenvolver um tratamento especializado e individualizado, o que possibilitará uma melhoria da qualidade de vida e da taxa de sobrevivência destes doentes.
O gene TP63 pertence à família do supressor de tumor TP53. No entanto ao contrário do TP53, que se encontra mutado em grande parte dos tumores, o gene TP63 raramente está na sua forma mutada. Ainda assim, a expressão do gene TP63 está alterada em alguns tumores. A isoforma do gene TP63, designada por ∆Np63, tem sido estudada como um possível biomarcador na área da oncologia, pois existem evidências que a relacionam com a progressão do tumor da bexiga não invasivo da camada muscular (NMIBC) para um tumor invasivo da camada muscular (MIBC). Estudos sugerem que esta isoforma inibe a senescência e a apoptose celular assim como promove a tumorogénese, proliferação e sobrevivência celular, exibindo características oncogénicas. No tecido normal da bexiga, o ∆Np63 tem uma alta/elevada expressão enquanto que no tecido tumoral de bexiga esta isoforma encontra-se subregulada.
Este projeto foi iniciado em Mount Sinai, Nova Iorque, pela orientadora deste trabalho, Dr.ª Mireia Castillo, onde, após inativar o gene ∆Np63 das linhas celulares de NMIBC (RT112 e BFTC), observou que estas células apresentavam maior taxa de proliferação in vitro e in vivo, maior taxa de invasão in vitro e maior incidência de tumores primários e formação de metástases in vivo. Deste modo, foi necessário validar os resultados na Fundação Champalimaud e verificou-se, através do modelo ortotópico in vivo, que as células clones (BFTC_C e RT112_C) apresentaram maior agressividade tumoral e maior formação de metástases, assim confirmando o que tinha sido observado anteriormente. Através da análise da expressão génica, observou-se ainda que ambas as linhas celulares apresentavam nove e quatro genes, respetivamente sobrerregulados e subregulados, concomitantemente nas duas linhas celulares, respetivamente.
Desta forma, o segundo objetivo deste projeto consistiu em descobrir quais dos genes selecionados na análise de expressão génica seriam mais relevantes na progressão tumoral. No entanto, apenas quatro dos nove sobrerregulados (AGR2, HOXC6, HRK e S100A4) e dois dos quatro genes subregulados (SCML1 e
SPOCK1) foram estudados, com base no seu relacionamento com o desenvolvimento tumoral referido na
literatura e também por existirem bons anticorpos e primers específicos. Deste modo, extraiu-se RNA das quatro linhas celulares (RT112_L_C, RT112_L_P, BFTC_L_C e BFTC_L_P) para realizar ensaios quantitativos de reação em cadeia de polimerase em tempo real (qRT-PCR) de forma a validar os resultados obtidos pela análise da expressão génica. A partir das mesmas linhas celulares foi extraída proteína para realizar ensaios de western blot (WB) e ensaios de imunofluorescência (IF), estes últimos foram realizados em células fixadas. Estas técnicas permitiram quantificar os níveis de proteína em cada linha celular (BFTC_P, BFTC_C, RT112_P e RT112_C). Após comparar os níveis de RNA mensageiro (mRNA) e de proteína, AGR2 foi o gene eleito como um dos favoritos a ter um papel essencial na progressão do tumor da bexiga. AGR2 tem maior expressão de mRNA nas células clones (∆Np63-) comparativamente com as
iv parentais (∆Np63+) (observado apenas na linha celular designada BFTC). Relativamente à síntese de proteína, os resultados do WB sugerem que AGR2 é produzida em maior quantidade nas células clones (∆Np63-) do que nas parentais (∆Np63+) (em ambas as linhas celulares) e através de IF observa-se o mesmo resultado na linha celular BFTC. Outros estudos sugerem que o gene AGR2 tem funções extracelulares que aumentam a agressividade de diferentes tumores, como por exemplo o cancro do pulmão, da mama e da próstata. Além disso, expressão de mRNA de AGR2 é elevada no carcinoma de células de transição da bexiga, adenocarcinoma da próstata e do pulmão.
A desativação do gene foi feita em cinco conjuntos de células de cada linha celular de NMIBC, onde já tinha sido inativado a isoforma ∆Np63 do gene TP63, formando cinco clones de cada linha celular, designados por BFTC_A1, BFTC_A2, BFTC_A3, BFTC_A4 e BFTC_A5, assim como para a linha celular RT112. Após silenciamento do gene AGR2 por shRNA nas células BFTC_C e RT112_C, estudaram-se os níveis de mRNA por qRT-PCR, e de proteína através das técnicas de WB e IF para determinar a eficiência da eliminação do mesmo. Estes estudos só foram realizados para a linha celular BFTC. O clone BFTC_A5 mostrou ser o que apresentava menor nível de mRNA e respetiva proteína AGR2, por isso esta linha celular foi utilizada para estudos funcionais, como ensaios de ciclo celular, ensaios de proliferação e ensaios de invasão celular. Os estudos funcionais foram essenciais para observar se o gene AGR2 está envolvido na progressão celular. Ensaios de ciclo celular revelaram que as células tumorais designadas BFTC_A5 (∆Np63- AGR2-) apresentaram menor divisão celular comparativamente às células tumorais BFTC_C (∆Np63- AGR2+) e BFTC_P (∆Np63+ AGR2+), in vitro. As células tumorais BFTC_A5 (∆Np63- AGR2-) revelaram ainda menor capacidade de proliferação e de invasão celular, in vitro.
Estes estudos sugerem que o gene AGR2 pode estar envolvido na progressão do tumor da bexiga não invasivo da camada muscular (NMIBC) para invasivo da camada muscular (MIBC). As células tumorais que sintetizam em simultâneo a isoforma ∆Np63 e o gene AGR2 (BFTC_P) revelaram não ter capacidades tão proliferativas e tão invasoras como as células tumorais que apenas sintetizam AGR2 (BFTC_C). No entanto quando o gene AGR2 é desligado, estas células tumorais voltam a perder a sua capacidade invasora e proliferativa, sugerindo assim que o gene AGR2 é essencial para a proliferação e invasão tumoral.
Este trabalho é o primeiro que estuda a interação entre o produto do gene AGR2 e a isoforma ∆Np63 do gene TP63 na progressão do tumor da bexiga não invasivo da camada muscular. No entanto mais estudos serão necessários para confirmar esta hipótese, nomeadamente estudos com o modelo ortotópico in vivo e também a análise de imunofluorescência de microarrays de tumores (TMA) que irá validar os resultados in
vitro, assim como correlacionar a expressão do AGR2 com as características do doente (prognóstico,
presença de metástases, risco de progressão, entre outros). Além disso, é também necessário realizar os mesmos ensaios, descritos neste trabalho, para a linha celular RT112.
Neste trabalho, AGR2 é descrito como um potencial fator de progressão de NMIBC para MIBC. O gene AGR2 é importante para o desenvolvimento do tumor e poderá ser um biomarcador com a capacidade de distinguir tumores que devem sofrer um tratamento mais ou menos invasivo. Como por exemplo, pacientes com tumores de elevado risco de progressão poderão beneficiar de uma cistectomia, enquanto que pacientes com tumores de baixo risco de progressão poderão usufruir de um tratamento menos invasivo e de vigilância médica com alguma regularidade.
v A existência de um anticorpo contra a proteína AGR2 pode permitir o desenvolvimento de ensaios clínicos em doentes com NMIBC, de modo a testar a sua efetividade no controlo da progressão destes mesmos tumores.
vi Abstract
∆Np63, an isoform of TP63 gene, has been described as an essential marker for Non-Muscle Invasive Bladder Cancer (NMIBC) progression. After knocking down ∆Np63 in NMIBC cell lines, nine and four genes were found up-regulated and down-regulated, respectively, through gene expression analysis, in two different bladder tumor cell lines (RT112 and BFTC). From this set of genes, four up-regulated (AGR2,
HOXC6, HRK and S100A4) and two down-regulated genes (SCML1 and SPOCK1) were chosen for further
analysis due to the availability of good antibodies and primers, in order to discover which of those genes are more relevant to bladder cancer progression. With this purpose, total RNA was extracted from BFTC and RT112 cells (both parental and knock down for ∆Np63) to perform quantitative real-time polymerase chain reaction (qRT-PCR) and to validate the gene expression analysis. From the same cell lines, proteins were extracted to performed western blot (WB) analysis and immunofluorescence (IF) assays and the protein and RNA levels were compared. The obtained results suggest that AGR2 gene was the most related in bladder cancer progression. In addition, mRNA level of AGR2 was higher in knock down clones than in parental cells (verified only in BFTC cells) and WB results showed that AGR2 protein was also higher in knock down than in parental cells. Similar results were observed by IF assay in BFTC cells. Other studies suggested that AGR2 has extracellular functions that increase aggressiveness of different tumors. Moreover,
AGR2 mRNA expression has been described as high in urinary bladder transitional cell carcinoma, prostate
adenocarcinoma and lung carcinoma. To study the effects of that gene in bladder tumor progression, AGR2 was knocked down in RT112_C and BFTC_C cells which had already been knocked down for ∆Np63 and mRNA and protein level studies were performed again through qRT-PCR, WB and IF techniques. After selection of the cell line with lower level of mRNA and protein AGR2, BFTC_A5, functional studies were performed, such as cell cycle, invasion and proliferation assays. Functional studies showed that BFTC_A5 (∆Np63- AGR2-) cells displayed lower cell division, lower proliferative and invasive capacities compared with BFTC_C (∆Np63- AGR2+), which suggest that AGR2 may has a role in bladder tumor progression.
vii Table of Contents
1 Introduction ... 1
1.1 Bladder Cancer ... 1
1.2 Risk Factors ... 2
1.3 TP63 and Bladder Cancer ... 3
1.4 Treatment of Bladder Cancer ... 4
1.5 Biomarkers to Guide BC Clinical Management ... 4
2 Working Hypothesis and Goals ... 6
3 Material and Methods ... 7
3.1 Cell Culture ... 7
3.2 RNA Extraction and quantitative Real Time PCR ... 8
3.3 Immunofluorescence Assay ... 8
3.4 Western Blot ... 9
3.4.1 Protein Extraction and Quantification ... 9
3.4.2 Protein Running and Transference ... 9
3.4.3 Immunoblotting ... 10
3.5 AGR2 Knock-Down Strategy ... 10
3.5.1 TRC2-Lentiviral Plasmid Vector TRC2-pLKO-puro Features ... 10
3.5.2 Plasmid Amplification ... 10
3.5.3 Lentivirus Production ... 11
3.5.4 Transfection of Cells ... 12
3.6 Invasion Assays ... 12
3.7 Cell Proliferation assay ... 13
3.8 Cell Cycle Analyses ... 13
3.9 In Vivo Bladder Orthotopic Model ... 14
viii
3.9.2 In Vivo Bioluminescent Imaging (BLI) ... 14
3.9.3 Histopathological Assessment ... 14 3.10 Statistical Analysis ... 15 4 Results ... 16 5 Discussion ... 22 6 Conclusion ... 28 7 References ... 29 8 Supplementary Data ... 34
ix List of Figures
Figure 1.1 Origin and evolution of urothelial carcinoma.. ... 1
Figure 1.2 p63: protein domain structure.. ... 3
Figure 3.1 Schematic figure of the NMIBC cell lines used in this work. ... 7
Figure 3.2 TRC2-Lentiviral Plasmid Vector TRC2-pLKO-puro. ... 11
Figure 4.1 NMIBC cells with loss of ∆Np63 generate more tumors with a more aggressive phenotype .. 16
Figure 4.2 mRNA and protein expression in BFTC_L_P, BFTC_L_C, RT112_L_P and RT112_L_C and control cell lines.. ... 17
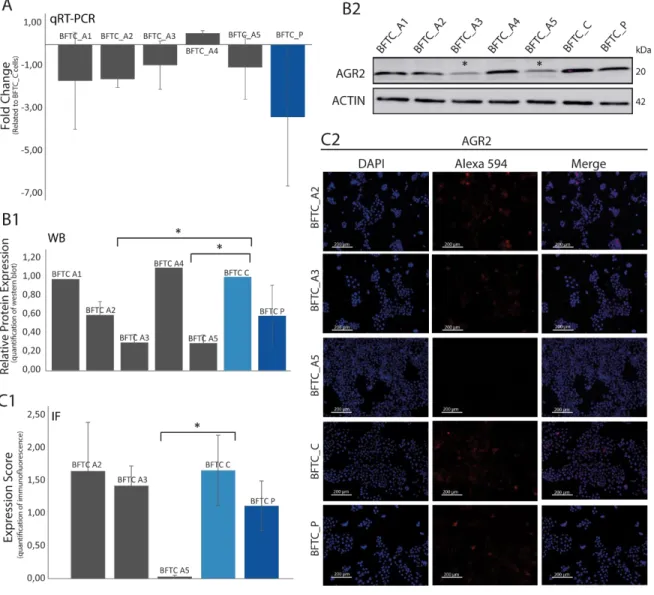
Figure 4.3 mRNA and Protein expression in AGR2 knock down BFTC cell lines (clones A1, A2, A3, A4 and A5). ... 19
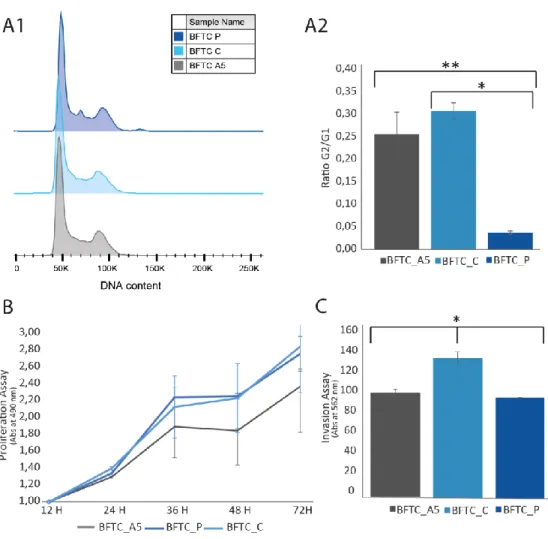
Figure 4.4 Functional studies of BFTC_A5, BFTC_C and BFTC_P cell lines. ... 21
Figure 5.1 Schematic representation of the proposed biological mechanism of AGR2 regulators and the AGR2 interactions/functions... 26
Figure 8.1 Immunofluorescence of AGR2, HOXC6, S100A4 and SCML1 proteins in BFTC_C, BFTC_P, RT112_C, RTT12_P and control positive cell lines. ... 36
x List of Tables
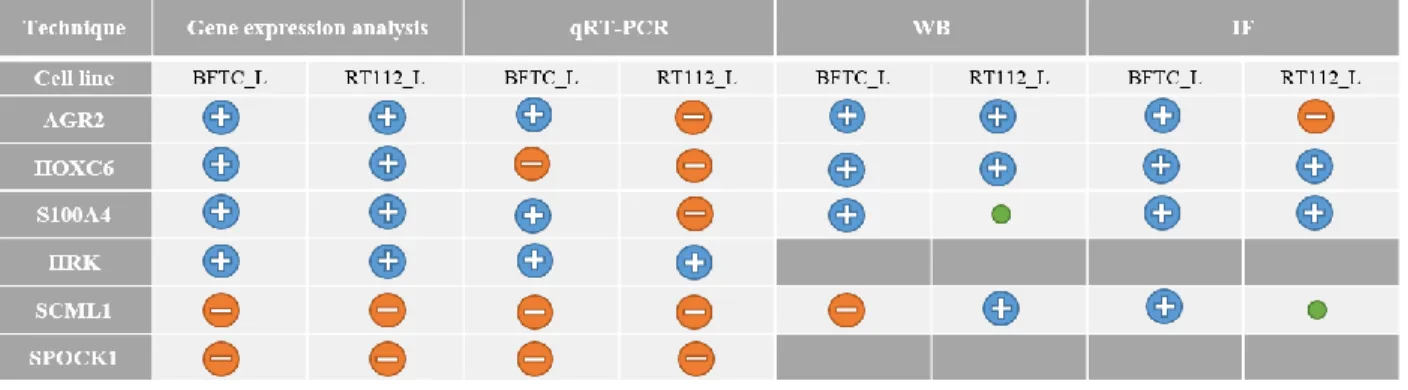
Table 4.1 Summary of gene expression analysis, qRT-PCR, WB and IF results.. ... 18
Table 8.1 Sequences of the primers used to perform qRT-PCR. ... 34
Table 8.2 Summary of the antibodies and its respective characteristics. ... 34
xi Glossary of abbreviations
∆N: Dominant negative Abs: Absorbance
AGR2: Anterior gradient 2
AR1D1A: AT-rich interaction domain 1A ATP: Adenosine triphosphate
BC: Bladder Cancer
BCG: Bacillus Calmette-Guerin BLI: Bioluminescence Imaging Bp: Base pair
BSA: Bovine serum albumin CAPS: Calcyphosine
CD44: Cluster of differentiation 44 CD49: Cluster of differentiation 49
CDKN1A: Cyclin dependent kinase inhibitor 1A cDNA: Complementary DNA
CHD2: Chromodomain helicase DNA-binding protein 2 CIS: Carcinoma in Situ
CK18: Cytokeratin 18 CK20: Cytokeratin 20 DAG-1: Alpha dystroglycan
DAPI: 4’,6-Diamidino-2-phenylindole DBD: DNA binding domain
dH2O: Distilled water
DMEM: Dulbecco’s modified eagle medium EGFR: Epidermal growth factor receptor ELF3: ETS-related transcription factor Elf-3 EMEM: Eagle’s minimum essential medium
xii EPDR1: Ependymin related 1
ES: Estrogen
FBS: Fetal Bovine Serum
FGFR3: Fibroblast Growth Factor Receptor 3
GAPDH: Glyceraldehyde-3-phosphate dehydrogenase GCHFR: GTP cyclohydrolase
GSTM1: Glutathione S-transferase µ HeLa: Helacyton gartleri
HER 2/3: Receptor tyrosine-protein kinase erbB-2 HG: High grade
HOXC6: Homeobox C6
H-RAS: Harvey rat sarcoma viral oncogene HRK: Harakiri
HRP: Horseradish peroxidase IF: Immunofluorescence IgG: Immunogoblin G
IMM: Molecular Medicine Institute IVIS: In vivo imaging system KDM6A: Lysine demethylase 6A KRT14: Keratin 14
KRT5: Keratin 5 LB: Lenox L broth LG: Low grade
LOH: Loss of heterogeneity
LRRC26: Leucine rich repeat containing 26 MIBC: Muscle invasive bladder cancer mRNA: Messenger RNA
MSH2: MutS homolog 2
xiii MYC: c-Myc binding protein homolog
NAT2: N-acetyltransferase
NEAA: Non-essential amino acids NMI: Non-muscle invasive
NMIBC: Non-muscle invasive bladder cancer
NOD/SCID: Non-obese diabetic / severe combined immunodeficiency nVC: Number of viable cells
OD: Oligomerization domain P: Penicillin
PBS: Phosphate-buffered saline PDI: Protein disulfide-isomerase PFA: Paraformaldehyde
PI: Propidium iodide
PI3K: Phosphoinosite-3-kinase
PiK3CA: Phosphatidylinositol-4,5-biphosphate 3-kinase catalytic subunit alpha PMS: Phenazine methosulfate
PPARG: Peroxisome proliferator – activated receptor gamma PTEN: Phosphatase and tensin homolog
qRT-PCR: Quantitative real-time polymerase chain reaction Rab-25: Ras-related protein Rab-25 precursor
RB: Retinoblast
RIPA: Radioimmunoprecipitation assay buffer Rpm: Rotations per minute
RPMI: Roswell park memorial institute RT: Room temperature
S: Streptomycin
S100A4: S100 Calcium binding protein A4 SAM: Sterile α motif
xiv SCML1: Sex comb on midleg-like 1
SD: Standard deviation SDS: Sodium dodecyl sulfate
SORBS2: Sorbin and SH3 domain containing 2 SOX2: SRY-related HMG-box 2
SPOCK1: Sparc/osteonectin, cwcv and kazal-like domains proteoglycan (testican) 1 SPSS: Statistical package for the social science
SRC: SRC proto-oncogene STAG2: Stromal antigen 2 TA: Transcriptionally active TAD: Transactivation domain TBS: Tris buffered solution TCC: Transitional Cell Carcinoma TERT: Telomerase reverse transcriptase TGS: Tris-Glycine Saline
TMA: Tissue microarray TP53: Tumor protein 53 TP63: Tumor protein 63 TSC1: Tuberous sclerosis 1 TUR: Transurethral resection
TURBT: Transurethral resection of bladder tumors UC: Urothelial Carcinoma
1 1 Introduction
1.1 Bladder Cancer
The bladder is a hollow organ in the pelvis and it is formed by a muscle wall that stretches to accommodate urine and coated by a mucosa named urothelium. The urothelium is a transitional epithelium, which has several layers and it is made up of different types of cells.
Bladder Cancer (BC) is the ninth most common cancer with an estimated of 429 000 new cases occurred in 2012 and approximately 165 000 deaths per year worldwide1,2. Europe has the highest incidence rates of BC in the world, with an estimated of 151 200 new cases and 52 400 deaths occurred in 20122,3.
The most common type of BC is urothelial carcinoma (UC) also named transitional cell carcinoma (TCC), because it develops from the transitional epithelium of the bladder4. Depending on the depth of invasion through the bladder wall, BC can be classified in two different groups: Non Muscle Invasive Bladder Cancer (NMIBC) and Muscle Invasive Bladder Cancer (MIBC)5. NMIBC is also known as superficial BC and is the most frequent group, comprising 75% of the cases at first diagnosis. NMIBC includes stages Tis (also called carcinoma in situ, CIS), Ta and T1, which have not grown into the muscle layer of the bladder wall, whereas MIBC includes stages T2 to T4 which have invaded the muscle layer of the bladder or further (Figure 1.1). Patients with NMIBC have higher chance of survival, around 88-98% Figure 1.1 Origin and evolution of urothelial carcinoma. Normal bladder is formed by three layers: mucosa layer, submucosa
layer and muscle layer. From normal bladder to bladder cancer there are two tumor pathways with divergent genetic backgrounds. Urothelial carcinoma can be low or high grade, depending on the degree of differentiation. Papillary and flat pathways are two distinct tumor morphologies, depending on tumor growth. Bladder cancer can finally be classified as NMIBC, including stages Tis, Ta and T1, or as MIBC, including T2 to T4 stages, depending on invasion of the muscular layer. This figure is adapted from Mireia Castillo-Martin et al.19.
2 after 5 years, although also a higher chance of recurrence, around 60%, when compared to MIBC5,6. Depending on the differentiation degree, BC can be divided in low grade (LG) and high grade (HG), with LG tumors having propensity for recurrence and a good prognosis whereas high grade tumors progress faster and have a worse prognosis. Approximately, 20% of HG NMIBC progress to an invasive and very aggressive tumors7.
Urothelial carcinoma arises through two distinct molecular pathways with specific histological features, referred as papillary, occurring in 80% of the cases, and non-papillary pathways, occurring in 20%8,9 (Figure 1.1). Papillary carcinomas grow in finger-like projections from the inner surface of the bladder, usually without invading into deeper bladder layers, called also non-muscle invasive (NMI) papillary tumors. These tumors have a high tendency for recurrence but rarely invade the bladder wall or metastasize. On the other hand, non-papillary tumors can evolve from CIS and they can be aggressive enough to invade the bladder wall and to metastasize. LG papillary tumors can progress to HG NMI tumors, typically by the presence of CIS in the adjacent mucosa8. Likewise, T1 HG tumors (that invade the lamina propria but do not invade the muscular layer) are associated with high risk of progression, metastasization and death, depending on the depth of invasion of the lamina propria and in the presence of CIS10. CIS is a flat HG NMI lesion that can progress to MIBC in 35% to 55% of the cases in 5 years, representing the cause of death in 39% of the patients with BC11,12. Some epithelial tumors progress by successive mutations in crucial genes that are responsible for growth regulation, survival, apoptosis and cell-cell interactions13. These two distinct pathways of BC have different genetics characteristics: LG NMI papillary tumors are characterized by loss of heterogeneity (LOH) of chromosome 9 and by mutations in harvey rat sarcoma viral oncogene (H-RAS), in fibroblast growth factor receptor 3 (FGFR3) and in phosphoinosite-3-kinase (PI3K) genes, while CIS has structural and functional defects in the TP53, RB tumor-suppressor pathways and in phosphatase and tensin homolog (PTEN) gene14–18. Complete loss of TP53 gene has been shown to be involved in the development of CIS, and TP53 loss concomitant with loss of RB functions can induce tumor progression19. MIBC is characterized by extended genomic aberrations, including LOH of chromosome 3, 5, 6, 10, 11 and 1820–24.
Due to the discovery of different molecular backgrounds in BC, MIBC was recently classified in molecular subtypes25. Luminal tumors are enriched with uroplakins, CK20 and CK18 and have upregulation of peroxisome proliferator – activated receptor gamma (PPARG), all characteristic of intermediate/superficial layers of normal urothelium. Luminal tumors express E-cadherin, HER2/3, RAB-25 and SRC and have enrichment of FGFR3, ELF3, CDKN1A and TSC1 mutations. On the other hand, basal tumors are enriched with expressions of KRT5, KRT14 and CD44 and show up-regulation of TP63 target genes, TP53 and RB1 mutations and show overexpression of CD49, Cyclin B1 and EGFR, similar to cells in the basal layer of normal urothelium9,26. Luminal tumors have shown a better prognostic than basal cancers.
Other histological types of cancer can develop in the bladder, including squamous cell carcinoma (SCC, 5 % of the tumors), adenocarcinoma (<1 %), and sarcomas (extremely rare), amongst others.
1.2 Risk Factors
BC is mostly caused by exposure to carcinogenic chemical agents. Tobacco, whether be active or passive smoking, is the leading risk factor for BC, mainly due to exposure to chemical carcinogens such as 4-aminobiphenyl and o-toluidine. Active smokers have 4-fold higher risk of BC incidence, similar to people who started smoking at a younger age or that were exposed to tobacco smoke during childhood27,28.
3 Occupational exposure to aromatic amines is another risk factor, for example, exposure to 2-naphthylamine, 4-aminobiphenyl and benzidine and exposure to 4,4’-methylenebis in the dye and rubber industries as well as exposure to hair dyes, house paints, fungicides, ionizing radiation, plastics and others agents can induce BC in 10-15 %9,29. Exposure to arsenic and chlorination by products in drinking water represents another group of important risk factors30. Chlorine is used to disinfect drinking water and swimming pools and it can dissociate itself in trihalomethanes and when it is present in drinking water can increase the risk of BC. The treatment by radiation of nearby cancers, such as prostate cancer, has also been reported to induce BC. Some other medical conditions may rise the risk of BC, such as the treatment of diabetic patients with pioglitazone drug for more than 2 years31. People with bladder infections or who suffer from chronic bladder infections have also more risk of BC. For example, bladder infection by the Schistosoma parasite can induce chronic irritation and inflammation in the urinary bladder, presenting higher incidence of squamous cell carcinoma32.
Family history of BC is also associated with an increased risk for BC mainly resulting of the shared smoking habits. However, some genes have been associated with increased risk of BC such as N-acetyltransferase 2 (NAT2) and slow acetylator and glutathione S-transferase µ (GSTM1) because their mutated form cannot break some toxins which will accumulate in the bladder9,33. MSH2 mutation found in Lynch syndrome is also associated with a 4.2-fold risk increase for BC in men before the age of 7033. Similarly, people with Cowden disease, caused by mutations in PTEN gene, have higher risk of developing BC. Despite that, BC consequent of family history is extremely rare34.
Interestingly, bladder cancer affects men and women in different ways. While men present a considerable higher risk of developing UC of the bladder, women show more advanced disease stages and seem to experience more unfavorable outcomes35.
1.3 TP63 and Bladder Cancer
TP63, a member of the TP53 gene family, has been reported as a potential marker of bladder tumor
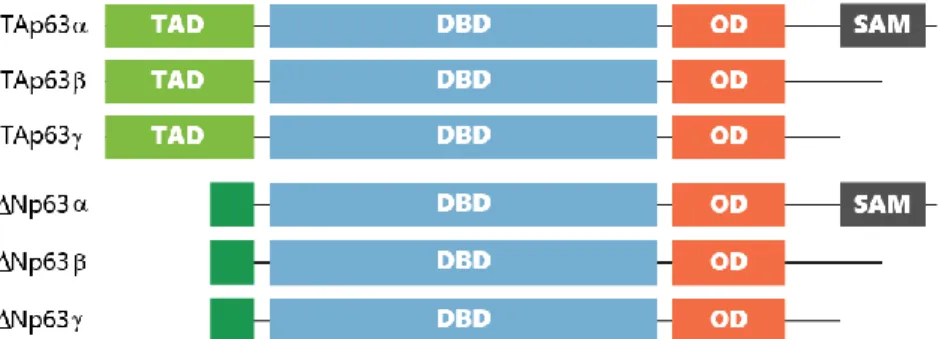
progression36,37. TP63 regulates cell-cycle arrest and apoptosis and encodes two isoforms depending on different promoter use: transcriptionally active (TA) p63 and dominant negative (∆N) p63 (Figure 1.2) 38. Both TAp63 and ∆Np63 are composed by three isoforms, named α, β and ƴ depending on alternative splicing.
In cancer, TP63 activity is thought to be isoform-specific, with ∆Np63 isoform apparently having an oncogenic role and TAp63 possessing tumor suppressor functions. The TAp63 isoform induces cell cycle Figure 1.2 p63: protein domain structure. Schematic diagram of p63 isoforms showing the transactivation domain (TAD), DNA
4 arrest and apoptosis by transactivation of TP53 whereas ∆Np63 isoform plays a role in blocking transactivation of both TP53 and TAp63 isoforms of TP63. Unlike TP53, mutation of the TP63 gene is very rare in cancer, instead, it is silenced by epigenetic factors39. ∆Np63 shows increased expression levels in tumor cells while TAp63 expression levels decrease40,41. Therefore, in normal tissue, the detection of ∆Np63 expression is very low, whereas the expression of TAp63 is normal, suggesting that ∆Np63 can be an proto-oncogene38,39,42. Even more, previous studies have shown that the same isoform can have different clinical implications in NMIBC and MIBC43. Due to these conflicting results, currently there is no consensus about TP63 being a proto-oncogene or a tumor suppressor, because the different isoforms seem to have opposite
effects41,44,45. Gaya et al. reported that ∆Np63 expression is a marker of good prognosis in HG-NMIBC, since patients whose tumors express this biomarker do not suffer disease progression to MIBC, and subsequently, they do not die from the disease36.
1.4 Treatment of Bladder Cancer
Treatment of BC depends on the clinical stage and grade at presentation: MIBC needs to be radically treated either by radical cystectomy or systemic therapies or both combined. NMIBC may be removed by trans-urethral resection (TUR) and followed-up to avoid or early detect progression to MIBC. Half of the patients with NMIBC, who are treated with TUR, suffer disease recurrence, and 5-25% of these patients progress to MIBC after repeated recurrences46. After TUR, LG Ta tumors are treated with intravesical chemotherapy with Mitomycin C or bacillus Calmette-Guerin (BCG) treatment for 1 year while T1 tumors usually undergo a second TUR followed by BCG treatment for 1 to 3 years47,48. On the other hand, high grade NMIBC patients are treated with BCG treatment or intravesical chemotherapy and close follow-up49. T1 tumors with high-risk of progression determined by clinical and pathological parameters (including size, multiplicity, localization, associated CIS, prostatic urethra involvement and female gender) may be treated upfront with radical cystectomy to avoid early progression to MIBC, which sometimes may result in an overtreatment50.
1.5 Biomarkers to Guide BC Clinical Management
NMIBC and MIBC have distinct pathways in carcinogenesis as illustrated in Figure 1.1 above. One pathway involves mutation of FGFR3 which is thought to be involved in tumor recurrence51,52. This mutation is more frequent in patients with NMIBC than in patients with MIBC at the time of diagnosis but
FGFR3 mutation has not been recognized to be a prognostic biomarker in advanced BC. In contrast, MIBC
and CIS exhibit deletions and mutations of TP53, RB1 or PTEN. TP53 has a role in induction of apoptosis, inhibition of cell proliferation and arrest of the cell cycle. Nuclear accumulation of p53, which is a poor prognostic factor, is found in 53% of patients who underwent cystectomy in MIBC53,54. The RB1, a tumor suppressor gene, is a negative regulator of the cell cycle. Loss of RB1 expression is an adverse prognostic biomarker in MIBC53. Bladder cancer with mutation of the RB1 gene exhibit low FGFR3 levels and it is associated with significantly poor disease-specific survival55. Pietzak et al. identified genetic alterations with potential clinical implications in NMIBC56. The most frequently altered genes in NMIBC were the TERT promoter (73 %), FGFR3 (49 %), KDM6A (38 %), PIK3CA (26 %), STAG2 (23 %), ARID1A (21 %)
5 Several markers associated with genetic alterations have been identified both in NMIBC and MIBC. Unfortunately, the clinical and pathological parameters have limited prognostic ability and to date no biomarker has been able to predict tumor behavior in an individual patient. Therefore it is important to identify new biomarkers involved in bladder cancer progression that can help clinicians provide individualized risk-stratified decision-making to define which NMIBC patients should be treated with immediate radical cystectomy58.
Functional studies by our group revealed higher proliferation rate both in vitro and in vivo as well as increased colony formation activity after knocking down ∆Np63 in NMIBC cells (data not published). Furthermore, these cells displayed superior invasion capacity in vitro, which correlated with higher local tumor initiation and metastatic potential in an in vivo bladder orthotopic mouse model. Gene expression analyses revealed that there were nine (AGR2, CAPS, CHD2, GCHFR, HOXC6, HRK, LRRC26, SORBS2 and S100A4) and four (EPDR1, PPARG, SCML1 and SPOCK1) commonly up-regulated and down-regulated genes, amongst the experimental cell lines.
Bearing in mind that ∆Np63 isoform could be involved in bladder tumor progression, this work focused in studying the genetic modifications associated with this ∆N isoform loss concomitant with more aggressive tumors.
6 2 Working Hypothesis and Goals
Considering the relevant role of ∆Np63 in progression of HG NMIBC to MIBC, the main goal of this work is to discover the genetic alterations associated with this TP63 isoform loss that confer the aggressive phenotype to tumor cells. The hypothesis being tested here is that, amongst the differentially regulated genes, AGR2 may be key in this transformation. To fulfill this final goal, the following objectives will be pursed, by using several in vitro and in vivo models:
1. Validation of the results obtained by the gene expression arrays for the different genes by qRT-PCR and protein assays (WB and IF).
2. Knocking-down AGR2 in NMIBC cells using shRNA technology and validation of the downregulation of the gene.
3. Perform cell cycle, proliferation and invasion in vitro assays to determine the effect of AGR2 knock-down in NMIBC cells.
This knowledge will allow a better understanding of the mechanisms of BC progression and in the future, it could help determine how patients with HG NMIBC should be treated, depending on their tumor molecular characteristics as a complement to tumor clinico-pathological features.
7 3 Material and Methods
3.1 Cell Culture
Two different HG NMIBC commercially available cell lines, RT112 and BFTC, were used for the experiments. These cells came from Dr. Cordon-Cardo’s Laboratory at the Icahn School of Medicine at Mount Sinai (New York, USA). First, both lines were transfected with the firefly luciferase gene, and were named RT112_L_P and BFTC_L_P (parental). Then, clones with downregulation of ∆Np63 gene by shRNA technology were generated, called RT112_L_C and BFTC_L_C (Figure 3.1). These steps were performed previous to the start of this master project. For this project, AGR2 was knocked down by shRNA technology in the cells previously ∆Np63 knock down. RT112 cells were grown and maintained in RPMI medium (Lonza #BE12-702F) supplemented with 10 % fetal bovine serum (FBS, Biowest #S181BH-500) and 1 % Penicillin/Streptomycin (P/S, Gibco #15140-122) at 37 °C in a humidified atmosphere of 5 % CO2. BFTC cells were grown and maintained in DMEM medium (Lonza #BE12-604F) supplemented with 10 % FBS and 1 % P/S at 37 °C in humidified atmosphere of 5 % CO2.
Human cancer cell line HeLa and MCF-7 were offered by Henrique Veiga-Fernandes Laboratory, IMM (Lisbon, PT) and by the Cancer and Telomere’s Laboratory, Champalimaud Foundation (Lisbon, PT), respectively. MCF-7 cells were grown and maintained in the same conditions as BFTC cells and HeLa cells
A
B
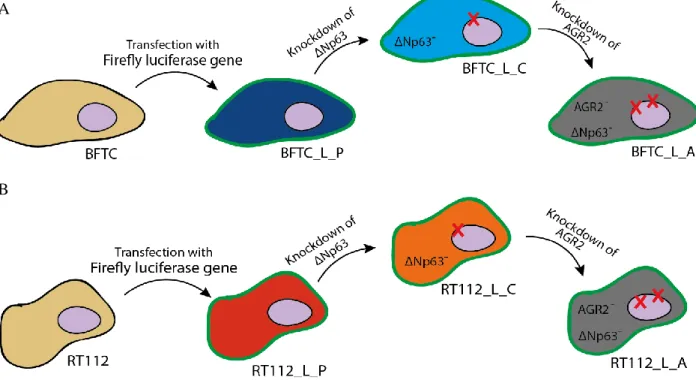
Figure 3.1 Schematic figure of the NMIBC cell lines used in this work. A: BFTC cell line (yellow cytoplasm) was transformed
with a firefly luciferase gene that conferred bioluminescence signal to the cells (L). These cells were called BFTC_L_P (dark blue cytoplasm) because the only alteration that they have is the luciferase gene. BFTC_L_P cells suffered a knockdown of ∆Np63 gene and were called BFTC_L_C (lighter blue cytoplasm). Then, BFTC_L_C were knockdown for AGR2 gene and were called BFTC_L_A (grey cytoplasm). All of BFTC cell lines studied in this work have the luciferase gene (green membrane). B: RT112 cell line (yellow cytoplasm) was transformed with a firefly luciferase gene that conferred bioluminescence signal to the cells (L). These cells were called RT112_L_P (red cytoplasm) because the only alteration that they have is the luciferase gene. RT112_L_P cells suffered a knockdown of ∆Np63 isoform and were called RT112_L_C (orange cytoplasm). Then, RT112_L_C were knockdown for AGR2 gene and were called RT112_L_A (grey cytoplasm). All of RT112 cell lines studied in this work have the luciferase gene (green membrane).
8 were grown and maintained in EMEM medium (SIGMA #M2279) supplemented with 10 % FBS, 1 % P/S, 1 % non-essential amino acids (NEAA, Sigma-Aldrich #M7145) and 2 mM L-Glutamine (Biowest #X0551-100) at 37 °C in a humidified atmosphere of 5 % CO2.
3.2 RNA Extraction and quantitative Real Time PCR
Total RNA was extracted from cultured cells using the RNeasy Mini Kit (Qiagen #74104) following manufacturer’s protocol, and concentration and quality assessment was measured using Nanodrop™ 2000 platform. 1µg of mRNA for each cell line (BFTC_L_P, RT112_L_P, BFTC_L_C and RT112_L_C) was converted into cDNA using SuperScript III First-Strand Synthesis kit (Invitrogen #18080-051) according to manufacturer’s instructions. The concentration of SuperScript III Reverse Transcriptase used was 100 U/µL.
Quantitative real-time PCR assay allowed to measure the mRNA level in each cell line. This technique with Power SYBR Green PCR Master Mix (Applied Biosystems #4367659) was performed according to the manufacturer’s instructions using Biorad CFX96 instrument (Bio-Rad). The sequences of all forward and reverse primers used to analyze the genes of interest (Invitrogen) are summarized in Table 8.1 (supplementary data). The PCR conditions were: initial denaturation at 95 °C for 15 minutes, 40 cycles of denaturation at 94 °C for 30 seconds, annealing at 60 °C for 40 seconds and elongation at 72 °C for 30 seconds, finishing at 4 °C. GAPDH gene was used as an endogenous control. Analysis was performed by using Bio-Rad CFX Manager software program (Bio-Rad). Relative fold change of target genes was calculated by2−∆∆𝐶𝑡, where (Equation 3.1):
Equation 3.1:
- ∆∆Ct = - [∆Ctclones(target-GAPDH) - ∆CtParental(target-GAPDH)]
The normalization was defined to the relative expression detected as 1. For each reaction, melting curve analysis was performed to ensure presence of a single amplicon. Experiments were run in triplicates.
3.3 Immunofluorescence Assay
Immunofluorescence (IF) assay allowed quantifying and verifying the subcellular localization of the protein. IF staining was performed on fixed cells. First, coverslips were sterilized in 95 % of ethanol for 10 minutes and then one coverslip was placed in a well of a 6-well plate and let dry. Meanwhile, cells were trypsinized and 100 000 cells were added in each well with the corresponding culture medium (completed up to 2 mL of medium per well). Once they reached 80 % confluency, cells were washed with 1X phosphate-buffered saline (PBS) and fixed with cold 100 % methanol for 15 minutes at -20 °C followed by cold 100 % acetone for 2 minutes at -20 °C. Fixed cells were washed for three times with 1X PBS at room temperature (RT), and kept in 1X PBS at 4 °C until used for staining.
After fixation, cells were permeabilized with 1 % Triton X-100 / 1X PBS at RT for 5 minutes. Then coverslips were incubated with blocking solution (0,1 % Triton X-100 / 1 % bovine serum albumin (BSA) / 1X PBS) at RT for 1h in a wet chamber. After aspiration of blocking solution, primary antibody was incubated for 2h at RT and then rinsed with 1X PBS at RT for 3 minutes, three times. Then, secondary antibody was added at a 1:600 dilution at RT for 45 minutes and then washed with 1X PBS for 3 minutes,
9 three times. Finally, a drop of mounting medium with DAPI (Thermo Fisher #P36962) was placed on top of the coverslip and it was mounted on a slide. Primary antibodies are summarized in Table 8.2 (supplementary data). For secondary antibodies, rabbit Alexa 594 (Thermo Fisher #Z25307) and anti-mouse Alexa 594 (Thermo Fisher #Z25007) were used. Slides were put in the dark at -20°C for 20 minutes and then pictures were taken in the Zeiss AxioImager M2, in the Champalimaud Advanced BioImaging and BioOptics Experimental Platform at the Champalimaud Foundation, with 20x amplification. The quantification of the immunofluorescence was measured with a score that related the percentage area of red signal obtained by ImageJ® and the number of nucleus calculated with a semi-automatic software, QuPath.
3.4 Western Blot
3.4.1 Protein Extraction and Quantification
Western blot (WB) is a technique that allows protein quantification and the first step was protein extraction, where Lysis buffer (RIPA buffer, Thermo Fisher #89900) was used, with protease and anti-phosphorylase reagents (Thermo Fisher #A32961), to avoid protein degradation and dephosphorylation. Lysis buffer was mixed with cell pellets and placed on ice (4 °C) for 30 minutes, being vortexed every 10 minutes. Afterwards, solutions were centrifuged at 14000 rpm for 10 minutes at 4°C and the supernatant was recovered and quantified. Protein solution was stored at -80 °C for further immunoblot procedures.
Bradford Law was the baseline to measure protein concentration using the Biorad Solution Protein Assay (Biorad #500-0006), following the manufacturer’s instructions. The standard curve was performed with BSA solution at different concentrations, in duplicates. dH2O was used as a blank. Before measuring the absorbance of the protein solution, 800 µL of dH2O, 1 µL of the sample and 200 µL of Biorad Solution were put inside of the spectrometry’s cuvette, in this particular order. After mixing the solution, it was incubated in the dark at RT for 5 minutes, and finally, the protein solution was read at 595 nm in the Ultrospec 2100 pro (Amersham Bioscience).
3.4.2 Protein Running and Transference
We used 50 µg of protein were used in a total volume of 30 µL for each blot. 4X Laemni dye (Bio-Rad #161-0747) was added to the protein extract. The volume calculations are summarized in Table 8.3 (supplementary data). Samples were boiled at 95°C for 5 minutes and later kept on ice until gel loading. The running box was prepared with 4-20% Mini-Protean® TGX™ Gels (Bio-Rad #456-1093) and running buffer (Tris-Glycine SDS (TGS) buffer) (Fisher Bioreagents #BP13414). Then, gel was loaded with 5 µL Prestained Rec Protein Ladder (Fisher Bioreagents #161-0374) and 20 µL of each sample. The run was performed at 80-100 V until the dye of the last ladder was at the very bottom of the gel.
For transference of proteins to the membrane, semi-dry transfer technology was used. Foremost, the membrane and two pieces of filter paper in transfer buffer were cut and soaked in a solution, which includes 5,82 g/L of Tris Base (Fisher Bioreagents #BP152-500), 2,93 g/L of Glycine (Fisher Bioreagents #BP381-500), 0,375 g/L of SDS (Fisher Bioreagents #BP166-100), 200 mL of methanol (Acros Organics #423950010) and dH2O up to 1 L. To do the transfer, 1 wet filter paper was placed on the transfer equipment, and then the wet membrane on top, without bubbles. The gel was placed on top of the membrane, followed by the other wet filter paper and the machine was closed. The running was performed for 60-80 minutes with constant amperage (it was important that the voltage did not surpass 18 V). When the run stopped, the
10 Ponceau Red (Alfa Aesar #J63139) staining was used to check for visible bands in the membrane corresponding to the different molecular weight proteins.
3.4.3 Immunoblotting
Foremost, the membrane was blocked with 5% non-fat milk (5 g of milk (Bio-Rad #170-6404) in 100 mL of 1X PBS on a rocker for 90 minutes at RT. Primary antibody was prepared in 5% non-fat milk solution and put on the membrane overnight at 4°C, in a rocker. The membrane was rinsed three times, for 30 minutes, in 1X Tris-buffered saline (TBS, Thermo Scientific #28358). The secondary antibody was prepared in 5% non-fat milk solution and put on the membrane for 2 hours at RT. The membrane was washed three times for 30 minutes in 1X TBS. Developing solution Pierce ECL Plus Western (Thermo Fisher #32132) was prepared and placed on top of the membrane for 5 minutes, and imaged in the Amersham™ Imager 600 machine (GE Healthcare Life Science). The same procedure with the loading control protein, β-actin, was performed in the original membrane to determine homogeneous protein load. However, to study S100A4 protein expression, the membrane was blocked with a different blocking solution, BSA blocking solution (5 % BSA, 0,1 % Tween 20 and 1X TBS), instead of 5 % non-fat milk. The same BSA blocking solution was used for antibodies dilutions, although, the temperature and the time of incubation were the same as described before. Results were analyzed with ImageJ® and Adobe Illustrator.
Primary antibodies used in this study are listed in Table 8.2 (supplementary data) and correspond to the same used for IF. A mouse anti-β-actin antibody (Sigma-Aldrich #MA1-91399) was used as the WB loading control. As secondary antibodies a goat anti-mouse IgG labeled with Horseradish Peroxidase (HRP) (Thermo Fisher #31432) and a mouse anti-rabbit labeled with HRP (Thermo Fisher #31464) were used.
3.5 AGR2 Knock-Down Strategy
3.5.1 TRC2-Lentiviral Plasmid Vector TRC2-pLKO-puro Features
The vector used to knockdown AGR2 gene was the TRC2-Lentiviral Plasmid Vector TRC2-pLKO-puro (Mission shRNA Bacterial Glycerol stock Sigma-Aldrich #SHCLNG) (Figure 3.2). This shuttle vector contains a bacterial ampicillin resistant gene as well as a puromycin resistance gene for mammalian cells. Generation of the lentiviral particles containing this plasmid was performed at the Molecular Biology Platform at the Champalimaud Foundation (Lisbon, PT).
3.5.2 Plasmid Amplification
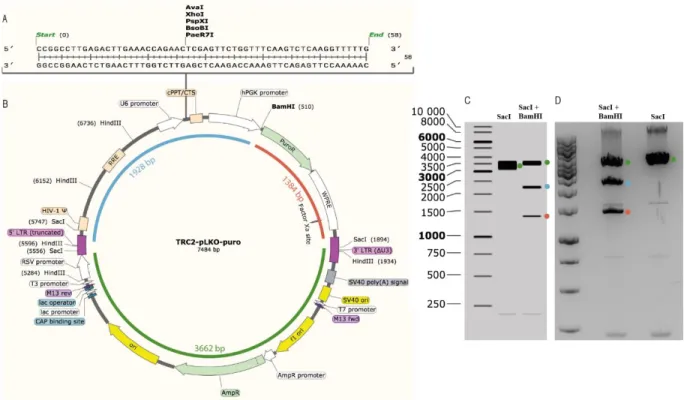
In brief, 18µL of the bacterial stock were added to 500 µL of LB medium without antibiotics. The culture was incubated for 30 minutes by shaking at 37 °C. Then, using a sterile loop, 25 µL of the incubated culture were spread into a freshly prepared plate containing LB agar and carbenicillin for selection of the ampicillin resistant bacteria. The use of carbenicillin, an ampicillin analog, was favored over ampicillin due to its increased stability in cultures. The plate was incubated overnight in a humidified atmosphere at 37°C. One single colony was isolated and added to LB liquid medium. The plasmid DNA was extracted using EndoFree Plasmid Maxi Kit (Qiagen #12362) by following the manufacter’s protocol59. DNA integrity was verified by digestion with restriction enzymes HindIII, SacI and BamHI enzymes. The selection of the restriction enzymes was based on bioinformatics software (Snapgene) that, through plasmid sequence, detects which and where restriction enzymes hydrolyze the plasmid (Figure 3.2 B) and which one hydrolyze
11 shRNA sequence (Figure 3.2 A) and show the expected pattern of the restriction enzyme digestion gel (Figure 3.2 C). The experimental agarose gel corresponded with that of the one from the software (Figure 3.2 D), meaning that the plasmid was validated and virus production could be initiated.
3.5.3 Lentivirus Production
The 293T cells were maintained with DMEM medium supplemented with 10 % FBS at 37°C in humidified atmosphere of 5 % CO2 in a 15 cm2 plate until reaching a confluency of approximately 90%. In the following day, the medium was replaced with 15 mL of OptiMEM and 10 % of FBS. Lipofectamine was prepared (2,5 mL of OptiMEM and 99,36 µL of Lipofectamine 2000 (Thermo Fisher #11668027) and Figure 3.2 TRC2-Lentiviral Plasmid Vector TRC2-pLKO-puro. A: shRNA sequence that is encoded between U6 promoter and
cPPT of the plasmid and has a size of 58 base pairs (bp). AvaI, XhoI, PspXI, BsoBI and PaeR7I are the restriction enzymes that hydrolyze the shRNA sequence and, for that reason are not good enzymes to be used in performing the plasmid validation. B: TRC2-pLKO-puro is the plasmid that contains the shRNA sequence to knock down AGR2 gene and it has a size of 7484 bp. This plasmid includes U6 (U6 promoter), cPPT (Central polypurine tract), hPGK promoter (Human phosphoglycerate kinase eukaryotic promoter), puroR (Puromycin resistance gene for mammalian selection), WPRE (Woodchuck Hepatitis Post-Transcriptional Regulatory Element), 3’LTR (3’ self-inactivating long terminal repeat), SV40 poly (A) signal, SV40 ori, T7 promoter, M13 fwc, f1 ori (f1 orgin of replication), ampR promoter (Ampilicin resistance gene for bacterial selection), ori (origin of replication), CAP (Catabolite activator protein) binding site, lac promoter, lac operator, M13 rev, T3 promoter, RSV promoter, 5’ LTR (5’ long terminal repeat), RRE (Rev response element). SacI and BamHI are the restriction enzymes used to validate the plasmid, SacI enzyme cuts the plasmid in two similar fragments, approximately 3662 pb (green line), SacI plus BamHI enzymes hydrolyze the plasmid and form three different fragment: 3662 bp (green line), 1928 bp (blue line) and 1384 bp (red line). C: Expected agarose gel (1%) of the restriction enzymes digestion with the chosen enzymes given by the software. The fragment marked with a green circle corresponds to the fragment formed by SacI and SacI + BamHI hydrolyze (green line in B) and has a size of 3662 bp. The fragment marked with a blue circle corresponds to the fragment formed by SacI + BamHI hydrolize (blue line in B) and has a size of 1928 bp. The fragment marked with a red circle corresponds to the fragment formed by SacI + BamHI hydrolyze (red line in B) and has a size of 1384 bp. D: Agarose gel (1 %) of the restriction enzyme digestion of the amplified plasmid. The fragment marked with a green circle corresponds to the fragment formed by SacI and SacI + BamHI hydrolise (green line in B) and has a size of 3662 bp. The fragment marked with a blue circle corresponds to the fragment formed by SacI + BamHI hydrolize (blue line in B) and has a size of 1928 bp. The fragment marked with a red circle corresponds to the fragment formed by SacI + BamHI hydrolise (red line in B) and has a size of 1384 bp.
12 then, it was incubated at RT for 5 minutes. DNA mixes were prepared according to the manufacter’s instructions, combined with lipofectamine and incubated at RT for 20 minutes. This mix was added to cells drop wise (5,1 mL per plate) and it was incubated at 37 °C. In the following day, the medium was removed, replaced with 15 mL of fresh DMEM medium with 10 % FBS and was incubated at 37°C, again. Viral supernatant was collected and spin-down at 3000 x g for 3 minutes, after one day. The supernatant was filtered with 0.45 µm filter cup. To concentrate the virus, LentiX Concentrator (Clontech #631231) was used and combined 3:1 of supernatant and lentiX, respectively. The mix was incubated at 4°C overnight. In the following day, virus concentration procedures were repeated and mixed with the first one, both having been centrifuged at 1500 x g for 45 minutes, followed by supernatant removal. Pellets were ressuspend in 1/100 in 1X PBS and mixed. The aliquots were stored at -80 °C.
3.5.4 Transfection of Cells
A group of 100 000 cells of RT112_L_C and BFTC_L_C lines were grown and maintained on 6-well plates with medium as described in the section ‘3.1’. In the following day, the cells were infected. To transfect the cells, 10 µL of polybrene (10 mg/mL) (Thermo Fisher #TR-1003-G) were added to 10 mL of medium into a 15 mL sterile falcon tube. Then, 75 µL of the medium was added to 50 µL of the viral suspension into an eppendorf tube. In each well, 2 mL of medium with polybrene and 25 µL of viral mix were added. Plates were centrifuged at 600 rpm for 1 hour at RT. Afterwards, plates were incubated at 37 °C in a humidified atmosphere of 5% CO2 overnight and, in the next day, the procedure was repeated. After two infections, 2 mL of fresh medium plus 2 µg/mL of puromycin (Gibco #A11138-02) were added to the cells in order to select those transfected. When cells were 90% confluent, the pellets were prepared to extract RNA and protein. During this process, fresh medium with puromycin was changed every two days. RNA was extracted and used to perform qRT-PCR as described in section ‘3.2’. The protein was extracted and used to produce WB as described in section ‘3.4’. Cells were plated in coverslips and IF performed as described in section ‘3.3’.
3.6 Invasion Assays
Invasion assay was performed using CytoSelect™ 24-well Cell Invasion Assay Kit (Cell Biolabs #CBA-110). The principle of invasion assay is to distinguish invasive cells from non-invasive cells. Invasive cells are able to degrade the matrix of proteins in the layer, and ultimately pass through the pores of the polycarbonate membrane, where they can be stained and quantified. On the day prior to the experiment, the medium of the cells was replaced with fresh medium without FBS (starvation). After rehydration of the basement membrane layer of the cell culture inserts, 180 000 cells of each cell line were transferred to a chamber and cells were growing with medium without FBS, however, outside of the chamber (inside of the well in a 24-well plate) there was medium supplemented with 10% of FBS.
To accomplish the specific number of cells for each experiment we counted cells with a hematocymeter. After trypsinization, the cells were centrifuged at 1200 rpm for 3 minutes at 4 °C. The supernatant was removed and pellet was re-suspended with 4 mL of cold 1X PBS. All these procedures were performed at 4ºC. To obtain cell count of the suspension, 10µL of solution were mixed with 10 µL of Trypan Blue 0,2% (Gibco), with a 1:1 dilution. After mixing, 10µL of the mix was pipetted into the hemacytometer chamber and observed with an inverted microscope under a 10X objective with phase
13 contrast to distinguish viable cells (shiniest cells are the viable cells, blue-stained cells are non-viable). To calculate the number of viable cells (nVC) per mL of solution, the following formula (Equation 3.2) was applied:
Equation 3.2:
nVC x 104x L=cells mL L=dilution
The plate was incubated for 48 hours at 37 °C in 5% CO2 atmosphere. After 48 hours, the medium without FBS was removed, the inserts were stained with 400 µL of Cell Stain Solution and incubated for 10 minutes at RT. After the inserts were washed, 200 µL of Extraction Solution were added to each well and the plate was incubated for 10 minutes at RT on an orbital shaker. Each sample was transferred to a 96-well plate and measured at 562 nm in a plate reader (BioTek #ELx800UV). For this procedure, manufacturer’s instructions were followed.
3.7 Cell Proliferation assay
Cell proliferation assay allowed studying the proliferative capacities of the cells and it was performed using CellTiter® 96 Aqueous Non-Radioactive Cell Proliferation Assay Kit (Promega #G5421). In order to measure the relative number of viable cells MTS [ 3-(4,5-dimethylthiazol-2-yl)-5-(3-carboxymethoxyphenyl)-2-(4-sulfophenyl)-2H-tetrazolium] assays were done. The same number of cells (10 000 cells per well) were grown and maintained on 96-well plates. At 12, 24, 36, 48 and 72 hours, 20 µL of a 1:20 PMS/MTS solution were added to each well. The plate was incubated for 2 hours at 37 °C in a humidified and 5 % CO2 atmosphere. Absorbance was measured using a plate reader (BioTek #ELx800UV) at a wavelength of 490 nm. In every experiment, the absorbance of the MTS/PMS + medium solution without cells was always measured as a control. For this procedure, the manufacture’s introductions were followed.
3.8 Cell Cycle Analyses
Cell cycle analysis is a method to distinguish cells in different phases of the cell cycle through flow cytometry. One million cells were maintained as described in ‘3.1’. The cells were centrifuged at 1500 rpm for 5 minutes, ressuspended with 500 µL of 1X PBS and with 500 µL of cold 2 % PFA solution. Cells with PFA were incubated at 4°C for 1 hour. The suspension was centrifuged at 1500 rpm for 5 minutes and the pellet was ressuspended in 1X PBS. To fix the cells, 1 mL of cold 70 % ethanol was added drop wise doing vortex at the same time, to avoid cell agglomeration caused by ethanol. The cells were maintained in 70 % ethanol overnight at 4 °C. On the following day, cells were centrifuged at 1500 rpm for 5 minutes and washed with PBS for 10 minutes on ice to rehydrate. Centrifuge was repeated for 5 minutes at 1500 rpm and cells were ressuspended with 250 µL of PBS. 5 µL of 10 mg/mL of RNase A (Thermo Fisher #EN0531) were added to the suspension and incubated for 30-60 minutes at 37°C. The final procedure was to add 10 µL of 1 mg/mL of propidium iodide (PI, Sigma #P4170-10MG) solution and solution was kept in the dark
14 at 4°C for at least 10 minutes or until analysis. Data was acquired on LSR Fortessa X20 cytometer with a blue laser (488 nm for GFP detection) and yellow-green laser (561 nm for PI detection). For each sample, at least 50 000 events were collected and data analysis was performed using ModFit LT™ version 4 with Watson Model for cell analysis after aggregate exclusion. Images were extracted from FlowJo® version 10.3.
The cell cycle analysis was performed with the help of the Flow Cytometry Platform of the Champalimaud Foundation (Lisbon, PT).
3.9 In Vivo Bladder Orthotopic Model
3.9.1 Inoculation of Bladder Cancer Cells
To perform studies in vivo, 1x10⁶ bladder tumor cells were inoculated in each Non-Obese Diabetic/Severe Combined Immuno Deficient (NOD/SCID) 5-7 weeks-old female mice. 5 mice for each cell line were used.
Before given the injections, mice were first anesthetized in an induction chamber with 2-3% isoflurane and 0,5 mb O2, until not showing any reflexes. Mice were placed in supine position (on their back) on the face mask with 2-3% isoflurane on a warming path. 100 µL of cell solution containing the one million cells at RT were inoculated on the bladder of the female through the urethra, as previously described in the literature60, the catheter being kept inside the mice’s bladder for 30 minutes. The tail of the animals was marked with a permanent ink to distinguish them. The animals were checked and weighted every two days, to assess performance status. 4 weeks after the inoculation, in vivo imaging with the IVIS Spectrum system (Perkin-Elmer) was performed at the IMM (Lisbon, PT) to determine tumor progression as previously described.
3.9.2 In Vivo Bioluminescent Imaging (BLI)
Luciferin is a common bioluminescent reporter used for in vivo imaging of the expression of luciferase. Luciferase enzyme utilizes ATP and Mg2+ as co-factors to emit a characteristic yellow-green emission in the presence of oxygen, which shifts to red light in vivo at 37 °C. Experimental cell lines were originally transfected with the firefly luciferase gene (Figure 3.1) and intra-peritoneal injection of D-luciferin (150 mg/kg of body weight, PromoKine #PK-CA707-10101-2), permitted the evaluation of tumor progression in vivo through BLI. For this procedure, the manufacturer’s instructions were followed.
3.9.3 Histopathological Assessment
After imaging, mice were sacrificed and all organs were fixed in 4% buffered formalin and processed. The sections were stained with Hematoxylin & Eosin (H&E) in the Histology and Comparative Pathology Laboratory of the IMM (Lisbon, PT). The slides with the sections were scanned in Pathology Platform of Champalimaud Foundation and images analyzed by Adobe Illustrator.
15 3.10 Statistical Analysis
The statistical analysis was performed using SPSS® software version 24 (SPSS, Chicago, USA). The normality of the samples in the study was tested with Kolmogorov-Smirnov test. The comparison of means of qRT-PCR, WB, IF, cell cycle, proliferation and invasion assays results were tested with student t test when there were two sets, and ANOVA when were three categories. Whenever samples did not follow normality, non-parametric tests were used, such as Kruskal-Wallis when there were three sets of samples. A p-value < 0.05 (double-sided) was considered statistically significant. Except invasion assay, all experiments were performed in triplicate and repeated at least twice. Data are presented as mean ± standard deviation (SD) from 3 independent experiments.
16 4 Results
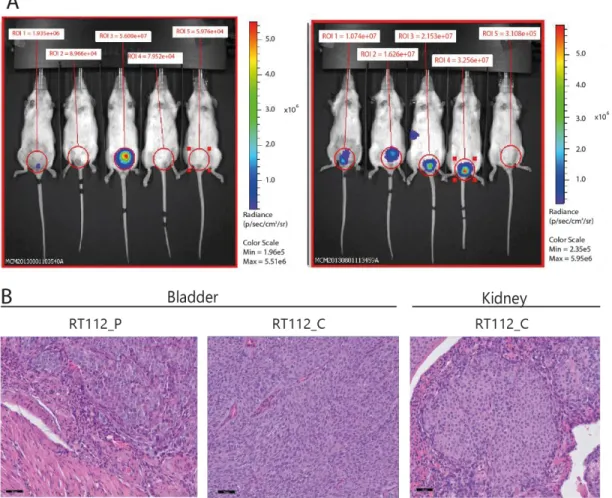
Previously, work developed by our group showed that HG-NMIBC cell lines with loss of ∆Np63 display higher proliferation rate in vitro and in vivo, higher invasion capacity in vitro and higher metastatic potential in an in vivo mouse model compared to cells with ∆Np63 expression (unpublished data). To validate these results, the orthotopic in vivo mouse assay was repeated in Lisbon with the RT112 cell line. 1x10⁶ cells were injected in the bladder of each female NOD/SCID mice and imaging in the IVIS was performed after 4 weeks. Consistent to previous findings, a higher tumor formation in the bladder was observed, as well as higher frequency in formation of metastasis formation in the kidneys in mice inoculated with ∆Np63 knock-down cells when compared to parental lines (∆Np63+) (Figure 4.1 A). Mice were sacrificed after imaging and their organs (bladder, heart, lungs, liver, kidney, spleen and thymus) were fixed in 4% buffered formalin and embedded in paraffin for histological evaluation (Figure 4.1 B).
Figure 4.1 NMIBC cells with loss of ∆Np63 generate more tumors with a more aggressive phenotype. A: Mice inoculated with
parental cells (left panel, ∆Np63+) developed less tumors in the bladder than mice inoculated with clone cells (right panel, ∆Np63-).
(Images are from Mireia Castillo’s work in Dr. Cordon-Cardo’s Laboratory, Icahn School of Medicine at Mount Sinai, New York, USA). B: Histology analysis of the organs from NOD/SCID female mice four weeks after inoculation with RT112_L_P and RT112_L_C cells. Bladder tumor formation was higher in mice inoculated with RT112_L_C than with RT112_L_P, and kidney metastasis were only observed in mice inoculated with RT112_L_C. Scale bar: 50 µm. Organs were fixed in formalin, paraffin embedded and stained with H&E by the Histology and Comparative Pathology Laboratory of the IMM (Lisbon, PT).
17 Gene expression analyses previously performed by Dr.ª Mireia Castillo comparing parental lines and clones with ∆Np63 knock-down (BFTC and RT112) revealed that there were nine (AGR2, CAPS, CHD2,
GCHFR, HOXC6, HRK, LRRC26, SORBS2 and S100A4) and four (EPDR1, PPARG, SCML1 and SPOCK1)
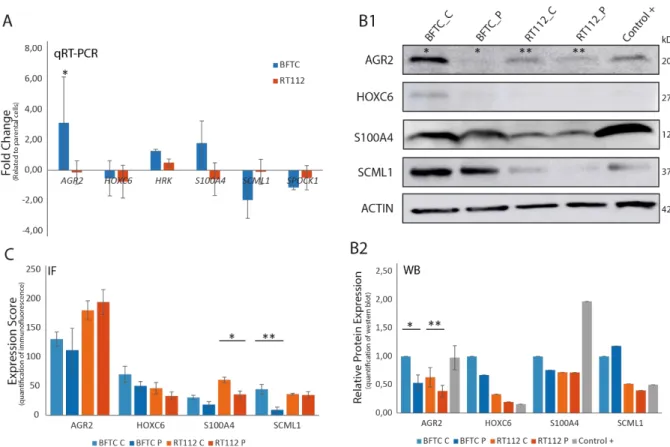
commonly up-regulated and down-regulated genes, respectively, amongst the experimental cell lines. After literature review about their relevance in cancer, and search for primers and antibodies availability, four out of the nine up-regulated genes (AGR2, HOXC6, HRK and S100A4) and two out of the four down-regulated genes (SCML1 and SPOCK1) were chosen for further studies in this work. To validate gene expression analyses, mRNA expression was analyzed through quantitative real-time PCR. The difference of expression between the knock-down ∆Np63 cells (clones: BFTC_L_C and RT112_L_C) and the wild type cells (parental: BFTC_L_P and RT112_L_P) was compared, for each gene with GAPDH as internal control, in triplicate (Figure 4.2 A). These results showed that according to the RNA microarrays results, HRK mRNA showed a tendency of up-regulation in both bladder cancer cell lines whereas AGR2 mRNA showed statistically significant increased levels in BFTC_C and S100A4 mRNAs had a tendency of up-regulation in BFTC_L_C cells (blue) and down-regulation in RT112_L_C cells (red). On the contrary, HOXC6,
SCML1 and SPOCK1 mRNAs showed a tendency of down-regulation in the ∆Np63 knock-down cells.
Figure 4.2 mRNA and protein expression in BFTC_L_P, BFTC_L_C, RT112_L_P and RT112_L_C and control cell lines. A: mRNA expression of AGR2, HOXC6, S100A4, SCML1 and SPOCK1 through qRT-PCR. Comparison between cells with ∆Np63+
(P) and ∆Np63- (C). Data were normalized against GAPDH within the same sample. BFTC cells are represented in blue columns ±
SD, n=3. RT112 cells are represented in red columns ± SD, n=3. Columns represent the mean from 3 separate experiments; each experiment was done in triplicates. *p-value < 0.05 by independent samples student t-test. B-B1: Western blot analysis of AGR2 (20 kDa), HOXC6 (27 kDa), S100A4 (12 kDa) and SCML1 (37 kDa) protein level in BFTC_L_P, BFTC_L_C, RT112_L_P, RT112_L_C and in positive control tumor cell line. β-actin expression was the internal control. B2: Quantification of WB assay. Experiments were done in triplicates. Dark and light blue columns represent BFTC_L_P and BFTC_L_C, respectively. Dark and light orange columns represent RT112_L_P and RT112_L_C, respectively. Grey column represents the positive control. *p-value (AGR2 in BFTC) = 0,053 **p-value (AGR2 in RT112) = 0,068 by independent samples t-test. C: Quantification of immunofluorescence images taken from Zeiss AxioImager M2 microscope with 20x amplification (Figure 8.1) *p-value < 0,01 **p-value < 0,05 by independent samples t-test.