DEVELOPMENT OF AN EVALUATION MODEL
FOR REVERSE SUPPLY CHAIN BUSINESS
MODELS
PEDRO JOEL COSTA GOMES
DISSERTAÇÃO DE MESTRADO APRESENTADA
À FACULDADE DE ENGENHARIA DA UNIVERSIDADE DO PORTO EM ENGENHARIA MECÂNICA
Development of an evaluation model for reverse supply chain
business models
Pedro Joel Costa Gomes
Dissertação de Mestrado
Orientador na FEUP: Prof. Eduardo José Rego Gil da Costa Orientador no Instituto: Prof. Dr. Günther Schuh
Faculda de de Engenharia da Universidade do Porto Mestrado Integrado em Engenharia Mecânica
Desenvolvimento de um Modelo de Avaliação de Modelos de Negócios de Reverse Supply Chains
Resumo
A necessidade de estudar a viabilidade de exploração de modelos de negócios relativos a uma reverse supply chain surge impulsionada por novas tendências de consumo, por diretivas que limitam a sobre-exploração ou forçam a recolha de materiais nocivos ou tóxicos, visando mitigar o peso ecológico de produtos usados destruídos ou descartados, e por estratégias de negócio sustentáveis
Um exemplo da necessidade de recorrer à recuperação de produtos usados surge da expectativa do crescimento da procura de veículos elétricos e da consequente escassez dos recursos necessários à produção das suas baterias, que induzem novos compromissos e desafios a produtores e respetivos gestores de cadeia de abastecimento.
Assim, entendendo-se como fundamental a existência de recursos e métodos que permitam a recolha e recuperação de produtos usados melhorando a sua eficiência ao longo do seu ciclo de vida, procura-se a implementação de modelos de negócio que permitam o aumento das taxas de reutilização, de remanufatura e de reciclagem, aumentando por um lado a acessibilidade dos produtores às matérias-primas e, ao mesmo tempo, garantindo a operacionalidade da empresa. Para isso será necessário o desenvolvimento de uma ferramenta de avaliação das interdependências entre vários parâmetros da cadeia de abastecimento, nomeadamente, o valor residual do produto e o seu índice de desmontagem e dos diferentes modelos de negócios passiveis de aplicação.
No presente trabalho foi estudada a influência dos parâmetros relativos à cadeia de abastecimento na performance dos diversos modelos de negócios e foi desenvolvido um modelo que visa simular as componentes de custos e receitas baseando-se na metodologia de análise de sistemas dinâmicos, system dynamics.
O estudo da influência dos parâmetros influenciadores foi feito através da recolha e da análise bibliográfica de outros sistemas qualitativos e quantitativos de avaliação.
Foi desenvolvido um modelo usando o software VENSIM, cuja validação passou pela definição do ponto de equilíbrio da cadeia de abastecimento e pela relação dos fatores inerentes a esse equilíbrio com a aplicação de diferentes modelos de negócio.
O resultado final contempla um modelo que relaciona o lucro e ROCE (Return of Capital
Employed) relativo aos diferentes modelos de negócio estudados.
Development of an Evaluation Model for Reverse Supply Chain Business Models
Abstract
The necessity to study the exploration viability of business models pertaining reverse supply
chains emerges driven by new consumer tendencies, by directives limiting the overexploitation
or forcing the recovery of manufactured products, seeking to alleviate the weight of destroyed or discarded used products
An example of the necessity to resort to product recovery activities arises from the expectation of the rise of electrical vehicles demand and the scarcity of the resources needed for their batteries production that introduces new compromises and challenges to manufacturers and supply chain managers. Therefore it is understood as being of the utmost importance the existence of resources and methods that allow for a recovery and retrieval of used products improving their life cycle efficiency, aiming for the implementation of business models that promote and increase the reusing, remanufacturing and recycling rates, easing the process of accessing the raw materials required while simultaneously safeguarding the operability of the company.
Therefore it is necessary to develop a tool for the different business model types liable to be used to evaluate the interdependences between various parameters of the supply chain, namely the product’s residual product and disassembly index.
In the present dissertation the influence of such parameters in the performance of the different business models has been studied and a model based on the system dynamics approach has been developed in order to simulate the cost and revenue components.
The study of the parameters influence was made based on existing bibliography analyses of other qualitative and quantitative evaluation models.
A model using the software VENSIM has been developed and validated with the definition of the break-even point of the supply chain and the relation of the different factors applied to different business models.
The final results consist of a working model relating the profit and ROCE (Return of Capital Employed) of the different business models.
Acknowledgements
I owe a special thanks to the people that made this work possible, namely Prof. Dr. Günther Schuh for the opportunity given to develop this work within the FIR institute and to Dipl.-Wirt.-Ing. Kerem Oflazgil for the never-ending advices and knowledge shared throughout this semester.
Also a special thanks for Prof. Eduardo Gil da Costa that in order to forearm any potential caused by the distance pertaining this project abroad was always available and helpful for any arisen question.
Ultimately a big thanks is owed to the people who accompanied me during this semester, the people who allowed and prepared me to embark on this project and my friends and family that despite the distance have kept me always close.
Table of Contents
1 Introduction 1
1.1 Initial Situation and Challenges ... 1
1.2 Target of the work ... 2
1.3 Structure and Procedure ... 3
2 Definitions 4
2.1 Reverse Supply Chain... 4
2.2 Business Models ... 8
3 State of the Art 3.1 Simulation approaches for Business Models ... 15
3.2 Evaluation of Reverse Supply Chains ... 17
3.2.1 Qualitative Approaches ... 18
3.2.2 Simulation-based approaches ... 22
4 Framework 4.1 Influencing Factors ... 27
4.2 Business Models for Reverse Supply Chains ... 28
4.2.1 Leasing and Recycling ... 28
4.2.2 Renting and Reuse ... 29
4.2.3 Deposit-based and Remanufacturing ... 30
4.2.4 Buy-back and Remanufacturing ... 31
4.2.5 Voluntary-based and Recycling ... 31
4.2.6 Credit-based and Reuse ... 32
4.3 Key Performance Indicators (KPIs) ... 33
4.4 Conclusion ... 33
5 Simulation Model 5.1 System Dynamics approach ... 35
5.2 VENSIM model Development ... 37
5.2.1 Model constants and converters ... 42
5.2.2 Model Equations ... 43
5.1 Model Validation ... 45
6 Conclusions and Future Work Prospects. 52 1 Publication bibliography 1 Annexes 5 Annex A: SCOR model adaptation’s process structure (according to (Novoszel 2012))... 5
Annex B: Complete VENSIM evaluation model ... 6
List of Abbreviations
BM Business model
CLSC Closed loop supply chain
DES Discrete event simulation
EOL End of Life
FSC Forward supply chain
i.e In example
OEM. Original equipment manufacturer
p. Page
ROCE Return on Capital Employed
List of Figures
FIGURE 1.1-PROCEDURE FOLLOWED IN THE COURSE OF THIS WORK ... 3
FIGURE 2.1-OPERATIONS’ SEQUENCE AS DESCRIBED IN (JOSEPH D.BLACKBURN ET AL.,2004) ... 5
FIGURE 2.2-REPRESENTATION OF A REVERSE SUPPLY CHAIN (ACCORDING TO M.GUPTA) ... 5
FIGURE 2.3-MAIN OPERATIONS WITHIN A CLOSED LOOP SUPPLY CHAIN ... 6
FIGURE 2.4-ALEXANDER OSTERWALDER.2011."BUSINESS MODEL CANVAS". BUSINESS MODEL GENERATION, PAGE 23,FRANKFURT AM MAIN:CAMPUS VERLAG GMBH ... 9
FIGURE 2.5–BUSINESS MODEL’S STRUCTURE (ACCORDING TO (WIRTZ 2013)) ... 12
FIGURE 2.6-BUSINESS MODEL FRAMEWORK ... 13
FIGURE 3.1-KOMOTO ET AL.2013.“SIMULATED SALES VOLUMES OF SPECIFIC COUNTRIES”. QUANTITATIVE SCENARIO-BASED SIMULATION OF GLOBAL BUSINESS MODELS FOR MANUFACTURERS.ELSEVIER ... 17
FIGURE 3.2–PROCESS LEVELS 1 AND 2 OF THE SCOR MODEL FRAMEWORK ... 21
FIGURE 3.3-PUSH AND PULL-TYPE REVERSE SUPPLY CHAIN MODELS ... 23
FIGURE 3.4-PARTIAL MMF MODEL REPRESENTATION OF A PARTICIPANT IN THE NETWORK ... 24
FIGURE 5.1–LEHR ET AL..“CAUSAL LOOP DIAGRAM FOR COLLECTION AND REMANUFACTURING ACTIVITIES”. FROM WASTE TO VALUE – A SYSTEM DYNAMICS MODEL FOR STRATEGIC DECISION-MAKING IN CLOSED -LOOP SUPPLY CHAINS. P12 ... 36
FIGURE 5.2-COST STRUCTURE OF THE FORWARD SUPPLY CHAIN ... 37
FIGURE 5.3-EXAMPLE OF A MATERIAL FLOW CONTROLLING TRIGGER ... 38
FIGURE 5.4-MATERIAL FLOW SUB-MODEL ... 39
FIGURE 5.5-SCORFRAMEWORK FOR REVERSE SUPPLY CHAINS (ACCORDING TO (NOVOSZEL 2012) ... 40
FIGURE 5.6-SORTING AND COLLECTION COSTS SUB-MODELS ... 40
FIGURE 5.7-REUSE AND RECYCLING COSTS' SUB-MODELS ... 41
FIGURE 5.8-REMANUFACTURING COSTS' SUB-MODEL ... 41
FIGURE 5.9-REVENUE'S SUB-MODEL ... 42
FIGURE 5.10-WILLINGNESS TO PAY FUNCTIONS PERTAINING SALES-BASED BUSINESS MODELS ... 44
FIGURE 5.11-WILLINGNESS TO PAY FUNCTIONS PERTAINING LEASING-BASED BUSINESS MODELS... 45
FIGURE 5.12–RELATIONSHIP BETWEEN THE NUMBERS OF UNITS PRODUCED, OF REMANUFACTURED PRODUCTS AND OF COLLECTED PRODUCTS. ... 46
FIGURE 5.13–NUMBER OF UNITS IN THE MARKET PERTAINING A USAGE DURATION COINCIDENT WITH THE BATCH ORDER PERIODICITY... 47
FIGURE 5.14-NUMBER OF UNITS IN THE MARKET WITH AN OFFSET BETWEEN THE USAGE DURATION AND THE ORDERS’ PERIODICITY. ... 47
FIGURE 5.15-RELATIONSHIP BETWEEN THE NUMBERS OF UNITS PRODUCED, OF RECYCLED PRODUCTS AND OF COLLECTED PRODUCTS. ... 48
FIGURE 5.16-TOTAL MAKE COSTS' DIFFERENCE BETWEEN BUSINESS MODELS WITH AND WITHOUT PRODUCT REINTEGRATION ... 48
FIGURE 5.17-PROFIT CURVE ... 49
FIGURE 5.18–FORWARD SUPPLY CHAIN PROFIT COMPARED TO BM1 AND BM2 ... 50
FIGURE 5.19-ROCE CURVES OF THE FORWARD SUPPLY CHAIN AND TWO LEASE-BASED BUSINESS MODELS 50 FIGURE 5.20-FORWARD SUPPLY CHAIN PROFIT COMPARED WITH THE SALE-BASED BUSINESS MODELS (BM3, BM4,BM5 AND BM6) ... 51
FIGURE 5.21-FORWARD SUPPLY CHAIN ROCE COMPARED WITH THE SALE-BASED BUSINESS MODELS (BM3, BM4,BM5 AND BM6) ... 51
List of Tables
TABLE 2.1–CHANEL PHASES AS (PROPOSED BY OSTERWALDER,PIGNEUR (2011)) ... 10
TABLE 3.1-PERFORMANCE MEASUREMENT ATTRIBUTES AND LEVEL ONE METRICS BASED ON THE SCOR MODEL ... 22
TABLE 5.1-WILLINGNESS TO PAY COEFFICIENTS FOR THE DIFFERENT BUSINESS MODELS ... 44
TABLE 5.2-BASE COSTS AND PRICE FOR THE EVALUATION MODEL ... 49
1 Introduction
The present dissertation was developed during an ERASMUS semester at the Rheinisch-Westfälische Technische Hochschule (RWTH-Aachen) in the scope of the Master in Industrial Engineering and Management, at the Faculty of Engineering of the University of Porto. The project was held under the supervision of the production management department of FIR at the RWTH-Aachen University, which consists of a non-profit and inter-sectorial research organization focused on business organisation and corporate development that provides research, qualification programmes and lectures in the service management, information management, production management and business transformation fields.
Founded in 1953 the institute belongs to the technological cluster of the university forming a part of the initiative for excellence in North Rhine.Westphalia (NRW), aiming to promote the strengths, expand and consolidate excellences in NRW.
Considering innovative supply chain management concepts, the research group supply chain management belonging to the abovementioned production management department works on the strategic design of value added networks and chains, including long-term planning, modelling and optimisation of cross-company material, goods and information flows helping companies planning the network structure and location selection. Furthermore, the group is responsible for the design, establishment and maintenance of the relations with the suppliers and customer as well as between a company’s own facilities, capacities, production and storage facilities.
1.1 Initial Situation and Challenges
While in the last twenty years, the focus has been directed on the adjustment of the product flow from raw material to the end customer, a paradigm shift in the way the returned goods are seen from the public, firms and governing bodies saw an increase in the attention given to reverse supply chains.
Saturated disposal areas, the ever faster depletion of raw materials and global warming have evoked the need for new environmental regulations and directives to return the end of life products through a reverse supply chain (RSC). An example is the pressure laid upon European tyre manufacturers after the European Council Directive 1999/31/EC on the landfill of waste. According to this legal act Member States are to take measures in order that used whole and shredded tyres starting from respectively two and five years after the established date (although varying by country) are not accepted in a landfill (European Council 4/26/1999). This is put into practice, among other means, through a producer responsibility strategy in which the law establishes the legal framework and assigns the responsibility to the producers to organize and manage the reversed chain of end-of-life (EOL) tyres (ETMra 2011).
Another example was directed towards electrical and electronic equipment, where the Directive 2002/96/EC of the European Parliament and of the Council on waste and electronic equipment (WEEE) imposes the responsibility for the disposal of this waste on the manufacturers or distributors of such equipment. In response to this, some manufacturers have arranged a cooperative collection and recycling network of regional storage centres where products
collected by municipalities and retailers are sorted and shipped to recycling subcontractors (Fleischmann 2001) .
Additionally some manufacturers and distributors are forced to plan a solution for their EOL products. However many manufacturers and distributors take this option pro-actively attracted by the residual value of used products.
This opposes the traditional approach many manufacturers had when not bound to any legal obligation which was regarding commercial product returns to be an inconvenience. As the final consumer was not prepared to pay for a green fee helping support the backward movement of the used good, it was believed that the costs of incorporating the disposal requirements would outweigh its benefits meaning that decisions were based on the purchasing costs reduction instead the optimization of the life-cycle performance. (Thierry et al.).
As such, the first question one has to ask when considering engaging on recovery efforts is whether or not such activities would turn profitable or if it would be a better option for the original equipment manufacturer, OEM, to regard the disposal costs of obsolete products as sunk costs.
This depends strongly on several external factors, namely existing legislation, raw material acquisition costs and attractiveness of the secondary market. However, today in an effort to increase customer retention rates many OEM have implemented increasingly liberal return policies which, added to the rapidly increasing volume of products derived from internet based business, led to an escalation of the amount of customer returns which will require a well-designed reverse logistic network to handle these products minimizing the derived costs. This change of marketing and sales methods as well as the changes of customer mentalities can lead some companies’ decisions to a standstill facing the trade-off between the efficiency of the supply chain and the time wasted from the point when a product is returned to its reintegration in the forward supply chain and subsequent loss of value and likelihood of its viable reuse. In an ideal case, the OEM would make profit from the recovering activities and establish an image of an environmental friendly company while the customer benefits from a price reduction of the remanufactured products and the environment is conserved from overexploitation of resources.
1.2 Target of the work
Considering the previously mentioned challenges, the target of this work is to provide a tool based on a system dynamics simulation model capable of assessing the performance evaluation of an implemented or designed reverse supply chain in order to aid the management of a company interested or expecting to engage in recovery activities in the decision making process. Using the simulation model provided, the original equipment manufacturer should be capable of both choosing the best contract option for its products and its optimal duration, that is, upon an hypothetical recovery of a previous leased product, the OEM should be able to decide whether or not an extension of the leased period is more profitable than the recovery and remanufacture of the product aiming to a re-sale.
To that end, focusing on the economic dimension of the driving forces’ triangle suggested by (de Brito, Marisa P., Dekker 2003), the value flows originated from the different reverse supply
chain business models studied will be analysed in search for breakeven points that reveal the conditions where a particular business model is preferable in comparison with the other options.
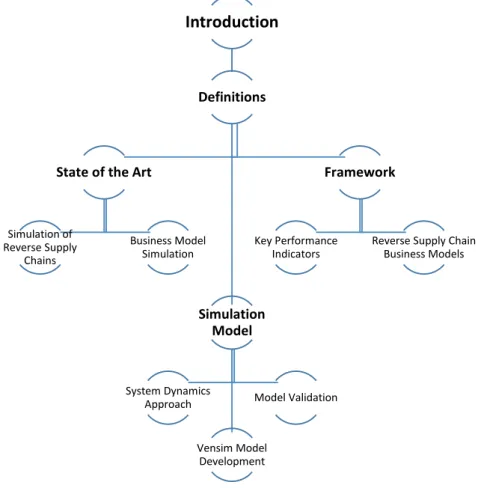
1.3 Structure and Procedure
To achieve the result proposed in the previous section, the structure depicted in figure 1.1 was idealized. The work will be divided into two parts, the first consisting in the research of the fundamental concepts and the available developments made in similar studies and the second consisting in the design, implementation and validity of an evaluation model for reverse supply chain business models using the software VENSIM.
Figure 1.1 - Procedure followed in the course of this work
Introduction Definitions Simulation Model Vensim Model Development System Dynamics
Approach Model Validation
State of the Art
Simulation of Reverse Supply Chains Business Model Simulation Framework Key Performance Indicators
Reverse Supply Chain Business Models
2 Definitions
The purpose of the following chapter will be the historic introduction and explanation of the reverse supply chain and business model concepts along with the reasons for their existence using the available literature as reference, while simultaneously providing a basic knowledge of the fundamental notions supporting these two core concepts through a comparison between the analyses of some existing approaches.
2.1 Reverse Supply Chain
The reverse supply chain is usually defined as the sequence of activities required to retrieve a returned product from its user and either dispose or reuse it with the goal of recovering as much economic and ecological value retained in the products as possible. The scope of the concept of the reverse supply chain is still disputed by some authors. Indeed the relatively new and empirical research in the area caused the emergence of numerous terms, namely reversed logistics, return logistics or retro logistics, broadly referring to the same concept (de Brito, Marisa P., Dekker 2003).
Therefore, in an effort to avoid misunderstandings due to the diversity of definitions and in some degree, a noticeable interchangeability of both the concepts of reverse logistics’ network and reverse supply chain in some literature, it is important to clearly define them clarifying the proposed differences between both definitions and their exact meanings according to different authors.
(Dyckhoff et al. 2004) refer to reverse logistics as “all activities involved in managing,
processing, reducing and disposing of hazardous or non-hazardous waste from production, packaging and use of products, including the processes of reverse distribution” (Dyckhoff et
al. 2004, p. 164), comprised of five main processes: collection, sorting, transportation, warehousing and processing.
Although the understanding of these five processes as the fundamental processes of a reverse supply chain remains throughout the literature reasonably unchanged, there are some deviations apart from the terminology used, which should be noted.
The term reverse logistics is also applied to define the sequence of activities required for the transportation of products returned by customers to sorting and disposal facilities (Blackburn et al. 2004). In that case, according to Blackburn et al. the reversed supply chain assumes the form illustrated in figure 2.1. This analysis shifts the previous concern on storage activities, which are incorporated on the reverse logistics and inspection and disposal processes. A relevant adjustment is also noticeable in the last stage of the chain. Whereas other authors’ studies ended on the processing phases, Blackburn et al. stress that the creation of secondary markets for the recovered product is still an intrinsic process of the chain. Apart from these interpretations’ deviations, further differences reside only on the terminology used.
Figure 2.1 - Operations’ sequence as described in (Joseph D. Blackburn et al., 2004)
Blumberg (2005) in turn proposes a more broad description of reverse logistics in a closed loop system context, regarding it as the integral part responsible not only for the control and handling of the material flows from the field but also for their reintegration in the reprocessing, recycling or disposing phases of the cycle.
de Brito, Marisa P., Dekker (2003), on the other hand, point out the difficulty in defining exactly what raw materials and end users are in a modern supply chain as used products can be used as a source for other productions (e.g. recovered glass is an increasing input in the glass manufacture process), and suggest the concept of closed-loop supply chain, a holistic view on a system combining both forward and reverse supply chains, highlighting the need for the coordination between both streams.
A divergent view, in which a difference between reverse logistics and reverse supply chain is established, is followed by (Gupta 2012). The difference lies on the extension of both concepts, where “RL mainly deals with transportation, production planning and inventory management” as opposed to the broader focus of reverse supply chain “involving additional elements such as
coordination and collaboration among channel partners. That is, reverse logistics is understood
as “one of the elements of a reverse supply chain.” (Gupta 2012, p. 22).
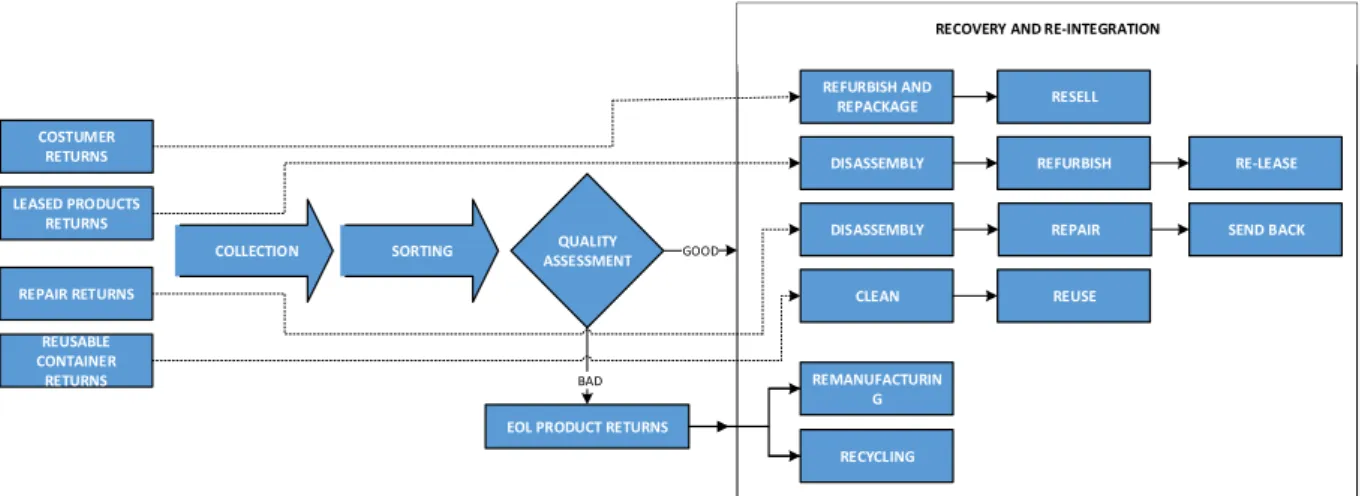
Deriving the sorting process form the type of product recovery, Gupta offers a more in depth interpretation of the reverse supply chain, as can be seen in figure 2.2.
Figure 2.2 - Representation of a reverse supply chain (according to Gupta)
Even though the different types of product returns and transactions between organizations and consumers will be approached throughout this work, this will be done later when analysing
Product Acquisition Reverse
Logistics
Inspection and Disposition
Reconditioning Marketing
RECOVERY AND RE-INTEGRATION
COLLECTION SORTING
EOL PRODUCT RETURNS QUALITY ASSESSMENT REFURBISH AND REPACKAGE DISASSEMBLY REPAIR CLEAN RESELL RE-LEASE SEND BACK REUSE BAD REFURBISH DISASSEMBLY COSTUMER RETURNS LEASED PRODUCTS RETURNS REPAIR RETURNS REUSABLE CONTAINER RETURNS GOOD REMANUFACTURIN G RECYCLING
different business models. In order to provide a clear understanding a simpler version of the reverse supply chain will be presented here.
It is therefore important to mention that despite all the different considerations and interpretations when approaching the RSC concept, when dissociating the interpretation from the process level into a broader perspective a simpler explanation based on the sequence of the four key steps considered depicted in figure 2.3: product acquisition, testing operations, product recovery and reintegration of the existing forward supply chain.
Figure 2.3 - Main operations within a closed loop supply chain
At first, it is important to define the meaning of reverse logistics differentiating it from other literature and using it as a reference for the course of this work, which here is understood as the set of processes needed to handle a product from the point of collection to the sorting including these processes as well. Then the product recovery management process set ensues.
Starting at the collection point, the process comprising the retrieval and the collection of used products from their usersis one of the main problems cost-wise as it is comparable to the ‘last mile’ issue in distribution and transportation networks. That means that the retrieval of a low amount of products from many possible locations will render collection an expensive and consequently ineffective operation (Blackburn et al. 2004). Adding to that effect, there is a particular uncertainty regarding quantity, quality and timing of the end of life product returns. A solution found by some companies that minimize this issue is partially based on a slight cost sharing between the firm and the customer by installing collection centres or drop points where
Forward Supply Chain
Reverse Supply Chain R A W M A TE R IA LS SOURCING CONSUMERS TESTING OPERATIONS P R O D U C T A C Q U IS IT IO N PRODUCTION DELIVERY
Product Recovery Management
REMAKE REUSE RECYCLE RE -I N T EG R A TI O N
the used products can be handed and sorted without having to be transported to a centre facility. At these centres, depending on the condition of the product and the return type, a decision is made regarding the disposition strategy. With this assessment the firm interested in setting up a reverse supply chain enters in the product recovery management analysis.
Various and further analysis can be made depending on the reasons for the return of the product (repair, end of life, end of lease and warranty) which will ultimately decide the point of the forward supply chain where it should be reintegrated. If the product wasn’t opened it can be sold as new and reintegrated almost immediately in the forward supply chain. In the event of an opened product package, testing operations will ensue to decide if the product can be refurbished and resold as a refurbished product or whenever deemed seriously damaged products regarded as end of life product return. (Gupta 2012)
This means that during this work there will be addressed three recovery options: reuse, remake and recycle, that will define the point of entry of the returned product into the forward supply chain.
Even assuming that refurbishing operations will take place in order to bring them up to a specified quality, the reuse option is clearly the one which reduces the time spent of the reverse logistics network benefiting from the least loss of value since its collection. Although these products will not be sold as new, technologically upgrades can be made by replacing outdated components or entire systems with technological superior ones. This can be usually seen in military equipment and aircraft, where the refurbishing operations expand their service life while and overall quality while still being bought as a used product for a lower cost. (Thierry et al.)
The remake or remanufacturing solution will, instead of upgrading or simply repair the used products, result in new remanufactured products having the same warranty and quality as brand new ones. The disassembled parts are thoroughly inspected and replaced by new ones when deemed outdated or damaged. Although some authors distinguish remanufacturing from the cannibalization option, in which after a selective disassembly a small proportion of the product parts are deemed potentially reusable and retrieved while the rest of the product is recycled or disposed, these two options will be treated as the same as the only variable is the proportion of the retrieved parts.
Both of these options are considered to be the most profitable and environmental friendly recovery options as the reused and remanufactured goods will always retain some original parts and form, which means that not only the material of which the product is made can be recovered as is the case in recycling. In this last option, the aim is to turn the used products into raw material used in the production of new ones.
Apart from the condition of the returned product it is worth mentioning that, the type of the return plays a big role in the decision process. While repair or service returns often spend more time in the reverse supply chain as there is the need to discover why they failed to perform as they should indicating potentially damaged or broken parts that need to be repaired or replaced, end of lease products can, when possible, be immediately re-leased.
This section indicates the organizational structure of both forward supply chain and reverse supply chain with special focus with the phases responsible to collect and handle the product
until its reintegration in the forward network. As such focusing anew the reverse supply chain phase, the product after being collected from the original market and sorted according to its remaining value and return condition, a decision is made regarding the recovery procedures taken to reintroduce it into the forward supply chain.
The product may be:
reused without any deep changes in its functional core, being reintroduced in the
deliver phase of the forward supply chain, FSC,
remanufactured after being dismantled and inspected to differentiate valuable components, modules or parts used to build a new product from non-valuable parts due to disposal, posteriorly reintegrated into the production phase of the FSC, or
recycled after being disassembled and each of its components inspected to once again differentiate the non-valuable parts from the valuable ones that are posteriorly reintegrated in the sourcing phase as raw materials.
2.2 Business Models
Even though the notion of business models has been implicitly employed in trade and economic behaviour since classical times, the study of its theoretical roots has been linked to the advent and evolution of the internet and the rise of new and rapidly growing markets (David J. Teece 2010).
Since then different views of new business models have appeared, some reflecting the way that revenues are collected, while other based on the exploitation of the supply chain structure and the way value is retained within.
In spite of the existence of different notions of business model, mainly based on the area in which the concept is used, it is easier to identify some key common elements. While most of the available literature assigns the nuclear role of a business model to the definition and explanation of the structure and organisation of a nuclear firm, its relationships with its partners and ultimately the market, describing the network structure of an organisation, the transactions and their management, the revenue generation or the knowledge flow within the network are also used to describe and classify business models.
Another issue found when fully understanding the concept is once again the different perspectives and approaches taken by different authors. The deconstruction of the concept into partial and universal approaches is frequently found in the current literature. In that case a partial model presents particular aspects of a company while a universal one explains the entire business activity of the company where a business model can be adapted into other companies and markets (Becker 2011).
From a larger and broader perspective a business model can be understood as the way in which an organisation does business, that is, it seeks to understand and explain how a company creates and delivers value to its customers and converts the revenue to profit, highlighting the notions of value streams, customer value, value proposition, monetary and financial concepts such as cost structures and revenue streams, and characteristics of the supply chain, namely delivery channels used and relationships with delivery partners. These three main branches form a wider concept of business models and constitute a differentiation basis between business model types. (Zott et al.).
(Osterwalder, Pigneur 2011) aim to establish a concept that “everyone understands” and that
“simplifies the discussion and description” of a company’s business model so that “everyone starts from the same basic principles and communicates about the same concept” (Osterwalder, Pigneur 2011, p. 19). This is accomplished through the introduction of the Business Model
CANVAS, a pragmatic tool comprised of nine basic building blocks that facilitates the analysis, discussion and comprehension of the business model arranged in the manner presented on figure 2.4.
Figure 2.4 - Alexander Osterwalder. 2011. "Business Model CANVAS". Business Model generation, page 23, Frankfurt am Main:Campus Verlag GmbH
The core of a business model is often the clients it seeks to reach. As such when designing a business model the consumers should be identified and considered, that is the company must decide who will be handled and who will be ignored.
Therefore the customer segments’ building block defines the group of people or organizations for whom the company will create value with its products or services. According to (Osterwalder, Pigneur 2011), differentiated groups can be identified , with focus on:
Mass Markets - Business models that aim for mass markets don’t differentiate between
consumer segments as the goal is to reach the biggest group of potential clients with similar needs as possible, therefore focusing the value-proposition, distribution channels and consumer relationships on the maximum number of consumers as possible.
Niche Markets - The value proposition, distribution channels and consumer relations focus on
the specific needs and characteristics of a client. An example can be seen on the dependence of the automotive parts builders on their major client.
Segmented markets - Different consumer groups are established and while both are object of
the company’s attention, their needs are attended differently. This segmentation can be made according to gender, income as is the case of car manufacturers, age notably made by cosmetic manufacturers or even a hybrid age-income approach, as is the case of mobile and telecom
companies. However unlike the diversified customer business model, these customer groups still have the same basic need or problems which are attended by the company.
Diversified markets - An organization with a diversified customer business model serves two
non-contiguous customer segments with very different problems and needs.
Multi-sided platforms - These business models aggregate at least two interdependent
consumer groups. It is the case of companies that provide services to mutually dependent customer segments, like credit card companies that serve both credit card users and retailers or free newspaper companies that need a large audience to attract advertisement companies. Under value proposition are described the products and services that create value for a consumer segment. That is it is what differentiates one company from another and justifies the consumer decision when choosing one over the other. This differentiation from the competitors can be achieved through innovation, design, price, cost reduction, availability, and convenience among others (Osterwalder, Pigneur 2011).
In a pragmatic approach, the channels consist in the contact points between the company and its clients. It describes how the company reaches their customers and which channels are accordingly used. Differentiating between the company owned direct channels, which can offer an increase of the profit margin, and the partner operated indirect channels, that in turn allow not only for an increase of the general coverage and reach of the company but also to profit from the strengths of its partners, Osterwalder, Pigneur also introduce the concept of channel phases, described in table 2.1, that can be partially or completely covered by every business model channel:
Table 2.1 – Chanel phases as (proposed by Osterwalder, Pigneur (2011))
In the consumer relationships’ block the type of relations that the company wishes to create and maintain with its customer segments should be identified. What varies in this building block of the business models is the proximity of the relationships between the company and the customers and the effort put into those relations.
While personal service allows the interaction between the client and a customer service representative in order to provide assistance during or after the sale, in the luxury market environment companies will often resort to individual personal assistance in which a sales representative is assigned to respond to a single client’s needs, a self-service approach offers a more indirect relationship in which the company provides the client with all the necessary means the latter needs to satisfy their own necessities. Between these two extreme points, one can refer to an automated service as a compromise point, in which the individual preferences and client characteristics can be recognized and personal record sheet can be established, ideally simulating a personal relation with the customer. A close example of the latter is the individual
Draw attention How is the customer's awareness raised towards the product?
Evaluation How the customers' evaluation of the value-proposition is facilitated? Purchase How the product availability for purchase is reached?
Communication How the value-proposition communication is established? After Purchase How is the customer protected after the purchase?
offers that e-commerce companies are able to provide to their potential customers based on their previous searches or purchases.
Nowadays companies are progressively regarding the relations with communities of clients as a useful method of interaction creating a scenario where feedback of their products or services can be easily and massively obtained as a solution to solve common problems.
Apart from the previously mentioned interactions, the client direct input can help the company in the value creation. These forms of co-partnership are often seen in e-commerce business under the form of product reviews
Under the revenue sources’ building block the sources of income coming from the different consumer segments are explained. These sources can be developed through the sale of commodities, usage fees frequently used in the telecommunications’ field, membership fees, lending fees, renting fees, leasing fees, licensing fees, commission of brokerage fees generated through the intermediation services between two or more parties and advertising fees generated from product or services advertisement. The event or media industries are traditionally dependent on this latter revenue source.
Allowing the company to create and offer value, to sustain relations with and to attain revenues from the different consumer segments, the key resources define the necessary assets in the activity of the business models. These can be sorted into physical resources like production or logistic facilities as well as other machines or systems needed in the activity of the company, intellectual resources like the patents or copyrights.
Distinguished among production or problem solving activities as well as platform or network usage disposition, the key activities’ building block is the representation of what the company must do in order to create value.
The network of suppliers and partners that helps, minimizing risks, acquiring resources or optimizing the business model is named key partnerships. These, according to the relationships of the partners and their relative position in the business, can be differentiated into strategic alliances, where the two parties are non-competitors, coopetition (that partnerships formed between two competitors), joint-ventures with the development of new business in sight, or buyer-supplier relations where both parties coexist in the same supply-chain.
Finally all costs that arise from the implementation and execution of the business model are encompassed in the cost structure building block. Here is depicted the position of the company toward costs and costs reduction. When the focus is on costs reduction, it is designated as a cost-based business model. If the emphasis is on creating a higher value, regarding the costs reduction as secondary, the business model is categorized as a value-oriented business model. In addition the intentions of the company to explore either economies of scale or economies of scope also feature here.
By re-arranging and regrouping these nine building blocks of the Business Model Canvas, Gassmann et al propose a condensed version based on four different dimensions (Gassmann et al. 2013).
While the first two dimensions, the clients, referring to the consumer segments and value proposition, are analogous to the respective building blocks found in the Business Model
Canvas, the components value chain and revenue mechanism differ slightly from the model previously explained.
The Value Chain depicts the management of the activities and processes engaged by the company to create value proposition in combination with the problem-solving abilities and the required resources and their integration in the value chain constitute the third dimension of the model. This includes previously disaggregated elements such as key activities and resources. Including the cost structure and the revenue sources, the revenue mechanism explains why the Business Model is viable and how the company creates value.
On the other hand ( Becker 2011; Zimmermann 2013) choose to divide the core concept into six other elements: the Product-Market combination which reflects in which markets and with which products the company wants to compete, the configuration and value creation attainability establishing the layout of the value chain, the income mechanic and revenue structure that identifies the income sources as well as the price proposition. The orientation towards competitors locates the competitive position of the company and strategy to deal with its competitors. The resources structure represents the capital or human capacity of the company and the company culture and organization that explains how and by whom the company is managed.
By presenting it as a simplified and aggregated picture of the relevant activities of an organization (Wirtz 2013, p. 3), explaining how the commercialized information, products and services originate from the value creation activities considering not only the architecture of the added value but the client, market and strategic components in order to generate and maintain a competitive advantage, Wirtz further divides the business model structure into three dimensions built by partial models represented in figure 2.5 : the strategic dimension, the client and market dimension and the value creation dimension (Wirtz 2013).
Figure 2.5 – Business model’s structure (according to (Wirtz 2013))
The strategic component of the business model is built on top of three structural elements. Divided into four sub dimensions (strategic, business, functional and relationship dimensions) the strategic model clarifies the positioning and development path of the company and the resource model represents the tangible and intangible core assets and competences of the company and the generation of the competitive advantage. On the other hand, the network model explains the partners’ interaction and the business model network.
Strategic
Model Resource Model Network Model ModelClient Supply Model Revenue Model
Goods and Services Finance Model Procurem ent Model
Serving as the connection between the other two components the client and market component depicts the environment in which the company moves. It includes the client model, which identifies the target customers or groups and customers’ relationships, defines the channel configuration and the customers’ contact points optimizing the business model to the clients’ needs, the supply model, that defines who the competitors and the market structure are as well as the value offering of the products and services, and the revenue model, that presents the revenue streams.
Under the influence of the strategic and client and market components, the value creation component focus on how and under which conditions more value can be created. It encompasses the goods and services partial model responsible for the explanation of the production of goods and services and for value generation within the company, the
procurement model explaining the resource and information acquisition and the finance model explaining how the company finances its activities, the capital needed and in reserve and
which are the underlying costs.
While the current literature is more focused on the establishment of a general and broad business model structure that can be used as a template for any existing or current organization in order to track and evaluate its performance or in the context of innovation to create or enter in new markets, the relevance of the concept to this work is the influence that the chosen revenue sources of a company’s business model has on the value chain.
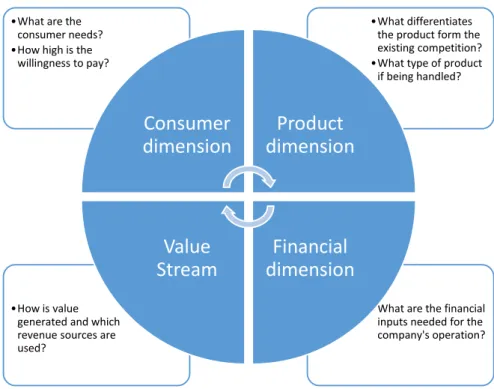
Therefore in the course of this work a simpler business model structure will be considered based on the four dimensions depicted in figure 2.6.
Figure 2.6 - Business Model Framework
•What are the financial inputs needed for the company's operation? •How is value
generated and which revenue sources are used?
•What differentiates the product form the existing competition? •What type of product
if being handled? •What are the
consumer needs? •How high is the
willingness to pay?
Consumer
dimension
Product
dimension
Financial
dimension
Value
Stream
In the context of a closed loop supply chain, a number of different business models were considered and analysed by (Blumberg 2005), differentiating basic reverse supply chain business models from closed loop supply chains with various degrees of recovery.
A basic reverse supply chain model is here understood to only deal with waste and unwanted materials, operating independently from the direct supply chain. The emphasis is then given to an economic disposal and consequently on the reduction of the costs related to the reverse logistic activities and the residual economic value of the returns is not considered.
In the course of this work there will be a significant deviation from this explanation as the approach to the reverse supply chain will be made in a closed loop system with the intent of evaluating the performance of RSC focused not only on a cost effective disposal but on the potential recovery of the residual value and further reintegration of the product.
As such, during the course of this work the relevant business models in a reverse supply chain context will be highlighted and explained in more detail in an effort to compare and evaluate different approaches that could be studied by an organisation.
3 State of the Art
In the previous chapter the concepts of reverse supply chain have been presented, encompassing all activities necessary to recover products from the consumer followed by their reintegration on the forward logistics network, and business models as the way a company creates and retains value. A reverse supply chain business model would therefore be encompassed by the measures taken by a company to create value from previously discarded products by remanufacturing, recycling or reusing them retaining some of the remaining value. Both these concepts will be further mentioned and will be subject of more specific explanations throughout the work as needed to understand the basis for their simulation.
Therefore the relevance of this chapter is based on the need to introduce the existing work and research regarding the evaluation and simulations of Business Models and reverse supply chain, differentiating different research approaches, in order to later depart the evaluation model from existing ones.
3.1 Simulation approaches for Business Models
Organizations wishing to venture in new markets need a tool capable to emulate the development of the target markets and its causes. In the scope of this project, a company who seeks to implement a reverse supply chain needs to fully understand the characteristics of the secondary market, the potential competition they will be faced with and the driving forces behind the engagement in recovery activities as well as the eventual benefits reaped from selling, leasing or renting options and their respective costs.
The qualitative analysis regarding business models is described to be very low and limited to small and medium sized enterprises (Zimmermann 2013). However a various number of simulation methods can be modelled according to the business model planner needs.
A static assessment tools as the SWOT analysis, the Porter’s five forces analysis or PEST analysis are already frequently and globally used tools to assess the potential risks inherent to a particular business model predicting business and market behaviours.
However, when addressing the dynamic and complex reality intrinsic to a business model, a dynamic simulation tool allows for quicker explorations of a wider pool of scenarios. Its goal is the prediction of errors or faulty decisions and their correction without the costs associated to an actual business failure and a faster detection of these errors. Commonly used methods involve the Monte Carlo simulation, stochastic investment models, agent based simulation, scenario-based simulation, discrete event simulation or a combination of two or more of the previous methods.
Often used to model uncertainty, randomness or risk scenarios associated with market variations or, in the context of reverse supply systems, the uncertainty associated with the returns’ collection, the Monte Carlo simulation is based on a previously established deterministic model. After the determination of the statistical distribution from where the inputs parameters are drawn, the random samples are generated, that is a set of random values that represent specific values of the variable considered are randomly selected, and used in the deterministic model generating one set of outputs that are then subject to a statistical analysis.
Used frequently in finance to capture the net present value, in portfolio evaluation aiming to model the value at risk or in reliability analysis, this method comes into relevance in the context of supply chain management for its usefulness when modelling uncertainties. (Raychaudhuri 2008)
Schmitt et al. discuss the impact of disruptions and the quantification of the dynamic nature of the associated with the risks within a multi echelon supply chain, which was simulated through the combination of Discrete Event Simulation (DES), employed to set the model of flows and interactions between different agents in the supply chain, and Monte Carlo simulation, used to create and quantify the risk profile of each interaction between agents (Schmitt et al. 2009). Before the introduction of the risk factor and the disruptions in the simulation model, a base model set around the proposed network flow consisting of a single manufacturer, a packaging plant and three distribution centres was simulated and validated. The Monte Carlo method is then used to create a risk profile in every contact point between the intervening agents, testing possible disruption mitigation strategies.
The discrete-event simulation method is a recurring iterative method in operations research (Jacobson, Yucesan 2002) that seeks to either maximize or minimize the value of a pre-defined objective function. The modelled system is described by a set of states, numeric values that characterize the system’s elements, and events that occur at a defined time instant and induce transitions between two different states.
It should be noted that this method is also recurrent in the context of supply chain simulation and will be further mentioned in the following section.
Another simulation method is worthy of mention due to its recurring appearance in the network management context. Consisting of a bottom-up approach (Sichman et al. 1998, p. 61), the agent-based simulation is used to model interactions between independent agents. A study of the management of renewable resources made by Sichman et al. is based on the lastly mentioned method allowing the simulation of local interactions between agents that occupy different positions in the industry from the harvester to the final transformer in a centralised and a decentralised models. This simulation approach allows the definition of individual behaviours which are based on individual profit maximization. The centralised model is defined by a price proposition mechanism that balances the demand and supply of the whole chain, while the decentralised model sets the commodities’ prices as a consequence of the individual interactions between agents. After the resources and agents’ behaviour are modelled, the prices are calculated through a global equilibrium principle seeking for the price that leads to the balance of the supply and demand of the agents at each stage or through the local trade principle based on the geometrical mean of the buyer and seller’s marginal rate of substitution. Aiming to explore the influence of taxes and trading quotas in such supply chain, eight scenarios are simulated, ranging from local trade without taxes nor quotas to a global equilibrium trade with a 20% tax applied to the harvesters and first transformers and a 25 resource units quota scenarios.
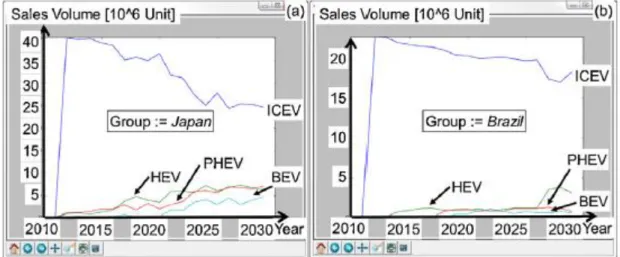
To assess the market share of electric vehicles in a determined area and based on input data published by government and research organisations concerning demographics, economic data and consumer behaviour Komoto et al. develop a quantitative evaluation of an integrated scenario model composed of multiple sub-scenarios that themselves represent the demographic
and economic evolution pertaining a determined area, the products life-cycle, fuel and electricity prices, previous sales volume of electric vehicles and other hybrid variants (Komoto et al. 2013). This is made through the integration and the definition of the relationships between these former scenario indexes and the performance progress and market data regarding electric vehicles from 2011 through 2030. The resulting discrete variations of the sales volume respecting different countries, see figure 3.1, allows a comparison between the pre-established wealthy countries’ group and developing country’s one as well as the influence that the initial parameters have in the resulting market share.
Figure 3.1 - Komoto et al. 2013. “Simulated sales volumes of specific countries”. Quantitative scenario-based
simulation of global business models for manufacturers. Elsevier
3.2 Evaluation of Reverse Supply Chains
In this section it will be explained one critical issue in supply chain management and by extension reverse supply chain management: its performance evaluation.
Various methodologies have been put into practice when analysing generic supply chains. Ming et al. make use of game theory to evaluate the effectiveness and competitiveness of supply chains in a supply chain vs supply chain competition (Ming et al. 2007).
Tao purposes an alternative evaluation method based on fuzzy matter-element theory, in which six different supply chains are analysed. A number of performance indicators are individually evaluated and sorted into the following four categories: satisfaction degree of the customer, information sharing degree, logistics level and financial conditions. The indexes weights of these indicators are then determined in order to construct an evaluation index system that represents the coordination, stability and sustainability of supply chains. Then an approach degree is calculated which reflects the closeness of a supply chain to the standard one to be used as the evaluation criteria. However deviations can be identified when using this method, as the indexes weights are usually determined through subjective models (Tao 2009).
In the service supply chains’ context, (Song et al.) suggest the use of a hybrid solution between the data envelopment analysis (DEA) and analytic hierarchy process (AHP) methods which solves both the lack of flexibility of the first method which can only deem the decision making
unit (DMU) to be efficient or inefficient and the subjective preference present on the latter ((Song et al.) 2008).
Furthermore, the reliability of a supply chain was addressed by Cao et al. using a back propagation (BP) neural network by assigning each of its members a reliability index based on client-oriented indicators, internal indicators for enterprises and reliability coordination indicators (Cao et al. 2008).
The agent-based simulation approach is used to analyse the global performance and the interaction between partners integrated in the same network but with different inventory, production, procurement and shipment politics (Seco, Vieira 2014). The ratio between the total quantity sold from shelf and the total quantity ordered is the measure chosen to evaluate six different collaborative polices along the network.
While a plethora of methodologies is available for the evaluation of forward supply chains, the existing research conducted on reverse supply chains’ evaluations is still scarce and reverts to simulation-based methods, which will be introduced later.
However because, as it was explained in previous chapters, the waste management and value recovery of returned products has now been seen by some companies as a way to gain competitive advantage over rival companies, the crucial assessment when considering engaging on a RSC initiative it’s its performance. An effective performance management is therefore an important aspect of the RSC initiative and the key to recognize the benefits of efficient supply chain management systems.
In addition to the vast criteria already involved in an evaluation of a forward supply chain turning it into one of the most complicated problems in the decision making process, the annexation of a reverse supply chain or purely its isolated examination presents an even greater challenge due to the inclusion of further variables that increase the uncertainty level of the value and material flows namely, the return rates, volume and timing, remanufacture rate among others.
As such, to seek a full understanding of the recent performance evaluation approaches and differentiating between qualitative and simulation-based approaches, a few methods to measure the performance of supply chains will be introduced, analysed and compared. It should be noted that despite appearing in different sections both research methods are not mutual exclusive, in fact both seek to achieve different results and can be used simultaneously in order to complement each method’s weaknesses in addressing a particular problem and metrics used in both systems can be adapted in the case of a mixed method research that uses both qualitative and quantitative data to answer the research questions, through the means of qualitisation of quantitative data and quantitisation of qualitative data. (Saunders et al. 2012)
3.2.1 Qualitative Approaches
The qualitative approach involves a generation of a new theory from observations and interpretation of mainly non-numerical or sometimes unquantifiable data gathered. It seeks the intensification of the research’s focus, as detailed as possible, on a particular situation and the full description of the phenomenon in hand. The information is generally gathered under the form of interviews, focus groups, observations or case studies, which due to the unregulated
data collection techniques, variability of the data and the uniqueness of each case renders this research type both time consuming and very specific in the sense that the final output cannot be generalized to the whole population.
As such, these investigation methods are useful for giving an insight and complete understanding of a specific problem in addition to its theoretic background. It provides the opportunity to reveal and understand the perspective, attitudes of the relevant participants and partners within the reverse supply chain and the context in which they are inserted. This allows an analysis from an insider perspective, and the conceptual understanding of the links and relations between partners and the customers’ behaviour patterns.
However the nature of the empirical and subjective data obtained from conclusions or observations of the participants or researchers reveals the subjectivity of this kind of analysis, maintaining nonetheless a flexibility adapting to eventual additions of future gathered data or conceptual changes.
Based on the impossibility to isolate it from its social implications and complexity and from its temporal and local context as well as grounded on the need to consider multiple subjective viewpoints, Gobbi conducts an investigation regarding the configuration, integration and profitability of the reverse supply chain through a qualitative based methodology (Gobbi 2008). To that end, three research questions are proposed:
Question 1: Which are the factors considered when configuring a reverse supply chain? Question 2: Which factors allow integration between reverse and forward supply chains? Question 3: Which are the conditions for a profitable reverse flow?
As the goal of this section is assessing the existing methodologies and researches regarding the evaluation of reverse supply chains, the focus will be given to the answer of the third research question.
To answer this question a query is proposed consisting of the following questions:
Why is product recovery an opportunity for generation of profit and what are the key factors involved?
How can the performance of a reverse supply chain be measured and which metrics can be applied?
To that end the following propositions are approached:
Proposition 1: Influenced by the supply chain structure the profitability increases when the
optimal reverse network model design is implemented allowing the extraction of most of the total residual value of the returned products.
Proposition 2: It is assumed that profitability of the reverse supply chain, its integration in a
forward chain and the involvement of the OEM are correlated.
After the initial research protocol has been set, the research bases itself on two case studies that analyse a legislation (LDRC) and a value driven reverse chains (VDRC), one interviews to relevant actors participating in the reverse process. For specifics on both study cases, refer to (Gobbi 2008, pp. 99–121)
In both instances the engagement in reverse supply chain activities is deemed profitable for at least one agent in the reverse network. In one hand the logistic providers and recycling companies benefit from a LDRC, in other hand the analysed VDRC is profitable for both the logistics provider and the producer.
The profitability of the reverse chain is assessed through a quantification model with the help of a number of metrics, namely total the quantity of products and their return rate, the percentage of returns suitable for reconditioning, the costs limit set by the customer, the reconditioning, transportation and disposing costs and the prices of reconditioned and remarketed products.
The chain is then deemed profitable for the recycling company and service provider if
𝑃𝑟𝑖𝑐𝑒𝑟𝑒𝑐𝑜𝑛𝑑𝑖𝑡𝑖𝑜𝑛𝑒𝑑>
𝐶𝑜𝑠𝑡𝑡𝑟𝑎𝑛𝑠𝑝𝑜𝑟𝑡𝑎𝑡𝑖𝑜𝑛+ %𝑙𝑒𝑎𝑠𝑒𝑑𝑝𝑟𝑜𝑑𝑢𝑐𝑡𝑠(𝐶𝑜𝑠𝑡𝑟𝑒𝑐𝑜𝑛𝑑𝑖𝑡𝑖𝑜𝑛𝑖𝑛𝑔− 𝐶𝑜𝑠𝑡𝑑𝑖𝑠𝑝𝑜𝑠𝑎𝑙) + 𝐶𝑜𝑠𝑡𝑑𝑖𝑠𝑝𝑜𝑠𝑎𝑙
%𝑙𝑒𝑎𝑠𝑒𝑑𝑝𝑟𝑜𝑑𝑢𝑐𝑡𝑠
and for the producer if the remarketed products are sold at a higher value than the reconditioned ones, providing it does not exceed the price accepted by the consumer.
In an effort to provide a standard evaluation tool for supply chain performance, the APICS Supply Chain Council (SCC) a global organization proposed the SCOR framework for evaluating and comparing supply chain activities and performance, enabling the analysis of “supply chains, whether simple or complex, using process building blocks and a common set of
definitions” (SCOR Framework - The APICS Supply Chain Council).
This framework is composed of a modelling tool built upon regulated standard processes, key performance indicators and a benchmarking tool to enable comparison between different supply chains and companies.
The processes are standardized and defined according to three hierarchical levels with growing specification and depth. As such, a level one process is composed by the aggregate of its related sub-processes from lower levels.
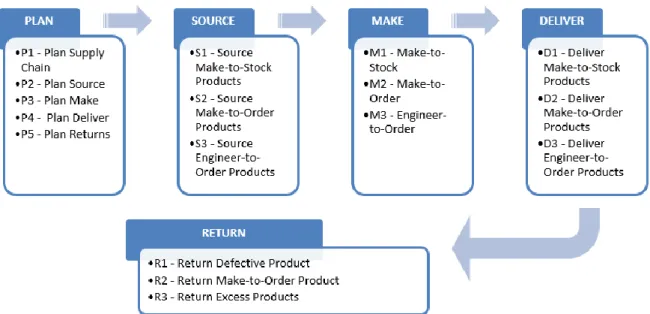
The first level depicted in figure 3.2 consists of five core process types and seeks to define them.
Figure 3.2 – Process levels 1 and 2 of the SCOR model framework
The plan processes assess supply resources, plan inventories, production and material requirements. The source processes deal with procurement and inspection of raw material and finished goods. The make processes handle the request and material reception, the product production and testing as well as its packaging and release. Meanwhile the deliver definition approaches the transportation management processes, warehousing, product shipment and performance evaluation. Finally the return processes handle the returned products’ inspection, scheduling and defective products verification and replacement (Umeda 2013).
The level two consists in a more in depth and specific approach to the five core process definitions. Here the model distinguishes between make-to-stock (MTS), make-to-order (MTO) and engineer-to-order (ETO) products.
The third level further decomposes the process types present in level two into process categories, for instance, the S2 (Source Make-to-Order product) is decomposed into the schedule product deliveries (S2.1), receive product (S2.2), verify product (S2.3), transfer product (S2.4) and authorize supplier payment (S2.5).
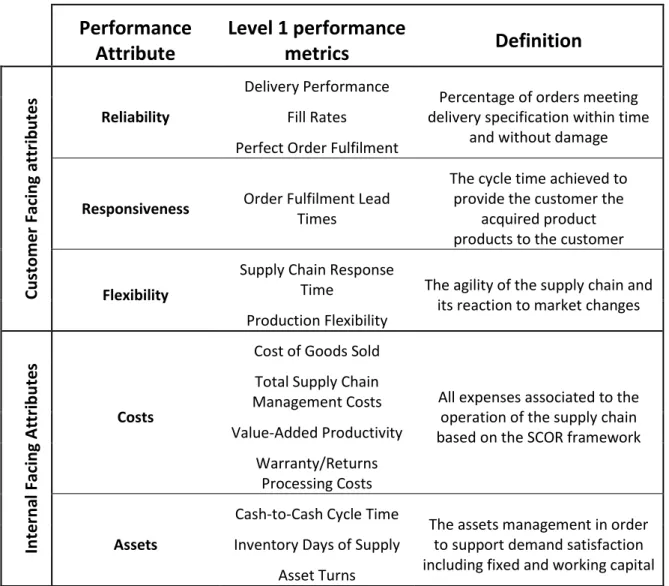
Accompanying this standard business process categorization, the SCOR model also defines two sorts of performance attributes each containing a set of metrics that similarly to the processes classification seen above can be further divided in lower levels.
These performance attributes are divided in customer facing performance attributes: reliability, responsiveness and flexibility, and internal facing attributes: costs and assets. Table 3.1 shows the tier one metrics linked to each of the performance attributes.