Why Are Firms Repurchasing
Stock in the 21
st
Century?
Trend and Motivations: the
U.S. case
Pedro Penedo
Dissertation written under the supervision of Jyoti Gupta
Dissertation submitted in partial fulfilment of requirements for the MSc in
Management with specialization in Corporate Finance, at the Universidade
Católica Portuguesa, and for the MSc in Management, at ESCP Europe, June
Why Are Firms Repurchasing Stock in the 21
st
Century? Trend and Motivations: the U.S. case
Pedro Penedo
Abstract:
In 1982, after the SEC approved rule 10b-18, the share repurchasing movement surfaced in United States. The movement was increasing steadily ever since the rule was enforced and seemed to please firm’ quest to find more efficient ways to pay their shareholders. However, this study identifies an abnormal increase in the past few years, in particular in 2018, when 60.8% of firms incurred in share buybacks. Despite a major crisis having occurred in the 21st century, the findings on this paper show that the culture of companies, which shifted in 1982 towards an increased shareholder orientation, was not shacked and, in fact, firms that survived continued to use a portion of their funds to repurchase their shares. Further, as the President Trump’s administration is focused on lowering the tax payments of companies, this study finds that the largest technology companies are the ones having the strongest reaction by bringing to the country the money once piled abroad and choosing to repurchase their shares. Moreover, this study aimed to discover which characteristics firms that repurchased shares possess. It was found and confirmed, through a regression model, that larger firms with consistently higher earnings, higher free cash flow performances and with lesser cash are more prone to incur in such activities. Lastly, it was revealed that the leverage hypothesis is still a motivation for firms to buy back their shares as it will help them reach optimal leverage levels.
Why Are Firms Repurchasing Stock in the 21
st
Century? Trend and Motivations: the U.S. case
Pedro Penedo
Sumário:
A recompra de ações por parte das próprias empresas emergiu nos Estados Unidos, em 1982, após a aprovação da lei 10b-18 pela SEC. Desde a aplicação da lei, o movimento não deu sinais de quebra e pareceu agradar às empresas e à sua busca por formas mais eficientes de pagar aos seus acionistas. No entanto, este estudo identifica um aumento anormal, em particular em 2018, com 60.8% das empresas a recompraram ações. Apesar da crise financeira de 2008, as descobertas deste estudo revelam que a cultura das empresas, que mudou em 1982 estando mais orientada para o lucro dos acionistas, não estagnou e, de facto, as empresas que sobreviveram continuaram a usar parte dos seus fundos para recomprar ações. Este estudo constata ainda que as maiores empresas de tecnologia são as que mais têm reagido à redução dos impostos sobre empresas por parte da administração do Presidente Trump, ao trazer para o seu país o dinheiro acumulado no exterior para recomprar as suas ações. Acrescentando ao já mencionado, este estudo teve como objetivo descobrir quais as características que as empresas que recompraram as ações possuem. Através de um modelo, foi descoberto que as grandes empresas com maiores lucros, maior cash flow e que possuem menos dinheiro em caixa são as mais propensas a fazer recompra de ações. Por fim, foi revelado que a hipótese de alavancagem ainda é uma motivação para as empresas recomprarem as suas ações, uma vez que as ajudará a alcançar os níveis de alavancagem ótimos.
Executive Summary
Before 1982, firms were not allowed to incur share repurchasing in the United States. It was prohibited by rules of the Securities and Exchanges Committee (SEC) as it was considered a method to manipulate the market, favouring the firm and its shareholders. Today, this is widdle accepted in the entire world and particularly in the U.S. by virtue of the President Reagan’s administration objectives. Nonetheless, starting in the turn of the century, an outstanding number of critics have started to pile and raise their voice against these programs. The major concern is that companies are using their money to fund these events instead of creating value for them and their shareholders by progressively invest in good projects that offer great returns. They claim the lack of good management is the reason behind the investment in these programs and not the lack of good projects to invest, as the company’s managers state.
Moreover, the relatively new in office, President Trump is placing laws and making adjustments to the ones that are already in existence in order to lower the corporate taxes firms are paying. As a reaction, corporations are using the money they are being obliged to bring back to repurchase their shares, to incur in M&A activities, pay dividends and pay their debt instead of using the funds to create new possible projects or hire employees. In fact, when it comes to the repurchasing of shares, the percentage of firms and the amounts spent are hitting all-time highs as latter will be proved. Furthermore, there is strong evidence that technology companies are the ones on the driver seat of the trend and the ones most using their funds with this purpose. Despite all of the above, there is still no consensus on the motivations for a company to repurchase its shares, unless some specific incidents happen as the one just mentioned. This study aims to provide the reader with a further view of the magnitude of the repurchasing movement present in the U.S. corporate world, as well as a deeper understanding of the motivations and characteristics of the repurchasing firms during the 2000 to 2018 period.
Acknowledgements
I would first like to thank my thesis advisor Professor Jyoti Gupta of ESCP Europe. Professor Gupta put me on the right path towards developing a tremendously interesting research that I appreciated and enjoyed doing. His mentoring was very important, and his support was key for my success and the development of this project.
I would also like to take the time and thank to my school, Católica-Lisbon SBE, and all of the professors of this institution that contributed towards my academic education without which I would not have gathered the knowledge and insights I possess today. A great part of what I am today I owe it to this great institution, to which I aim to repay with an outstanding career path that will help further solidify the brilliance of its students.
I have to express my extreme gratitude towards my parents, Graça and Manuel Penedo, for their absolute support during all of my years of study, and to my brother, Valter Penedo, my nephew, Afonso Penedo, and my sister-in-law, Sandra Penedo, for never doubting my capabilities and for providing that extra support many times needed.
Lastly, I need to thank my girlfriend, Maria Esberard, without whom I would not be able to gather the concentration and focus needed to perform this study in such a short amount of time and to who I am grateful for the patience and care she showed towards me throughout the process.
List of Tables
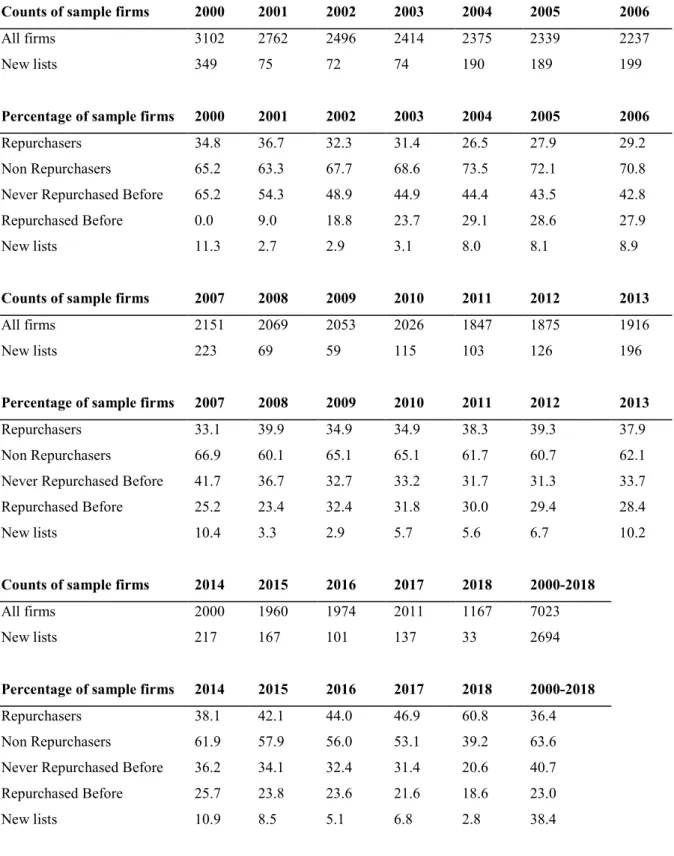
Table 1 Counts and percentages of sample firms divided into different repurchasing groups.
Firms included were retrieved from NYSE, AMEX and NASDAQ stock exchanges between 2000 and 2018. ... 12
Table 2 Percentages of sample firms divided into different repurchasing groups and year
groups. Firms included were retrieved from NYSE, AMEX and NASDAQ stock exchanges between 2000 and 2018. ... 13
Table 3 Average firm Market to Book Value, Earnings (measured by Earnings over Market
Value) and size (measured by total Assets). The values shown are aggregated values for the firms in each of the different repurchasing groups, averaged over the years in a period. ... 16
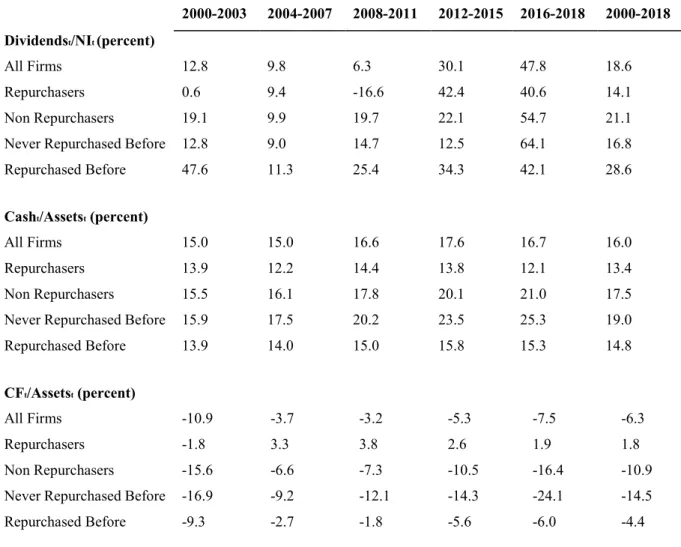
Table 4 Average firm Dividends (measured by Cash Dividends over Net Income), Cash
(measured by Cash over total Assets) and Cash Flow (measured by Cash Flow over total Assets). The values shown are aggregated values for the firms in each of the different repurchasing groups, averaged over the years in a period. ... 19
Table 5 Average firm Leverage ratio (measured by Debt minus Cash over total Assets). The
values shown are aggregated values for the firms in each of the different repurchasing groups, averaged over the years in a period. ... 22
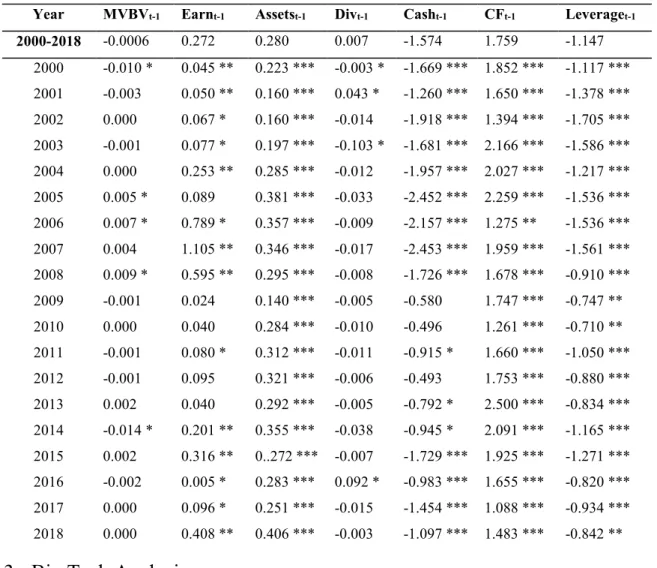
Table 6 Logit regressions estimated for each year of the 2000 – 2018 period. The dependent
variable is 1 if the firm repurchased stock in the year in analysis and 0 if they did not repurchase any stock. The independent variables are MVBV, Earn, Assets, Div, Cash, CF and Leverage. The table presents slopes for every year analysed. The asterisks represent the different significance levels (***p<0.01; **p<0.05, *p<0.1). ... 25
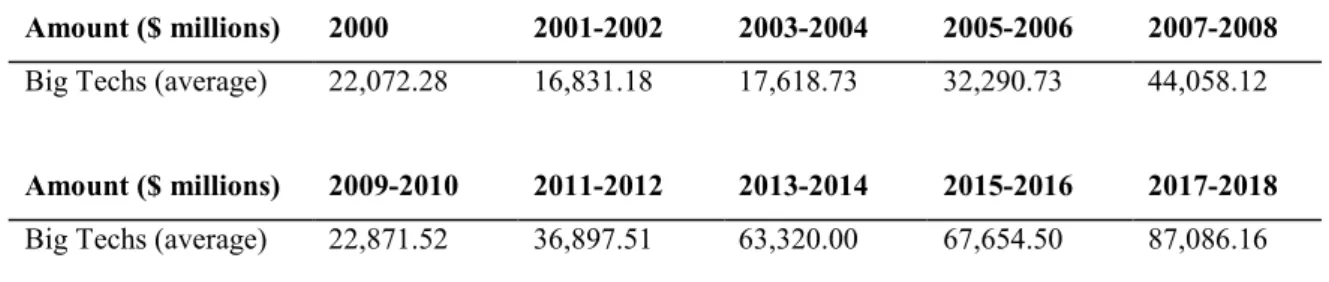
Table 7 Average amount spent by the Big Tech industry selected firms that repurchased stock.
Data retrieved from the between 2000 and 2018 and divided into groups of two years each. 29
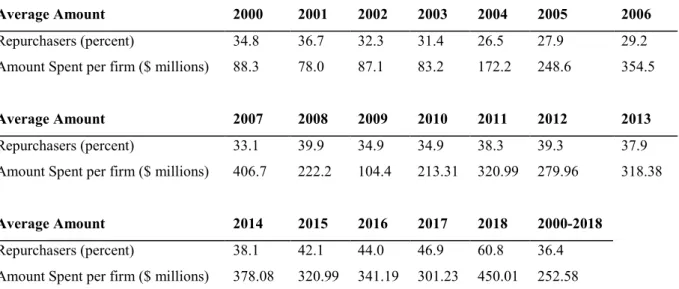
Table 8 Percentage of sample firms that repurchased stock. Amount spent, on average, by each
firm that repurchased stock. Firms included were retrieved from NYSE, AMEX and NASDAQ stock exchanges between 2000 and 2018. ... 32
Table 9 Average firm Market to Book Value, Earnings (measured by Earnings over Market
Value) and size (measured by total Assets), Dividends (measured by Cash Dividends over Net Income), Cash (measured by Cash over total Assets) and Cash Flow (measured by Cash Flow over total Assets) Leverage ratio (measured by Debt minus Cash over total Assets). The values shown are aggregated values for the firms in each of the different repurchasing groups, averaged over the years in a period. ... 32
List of Figures
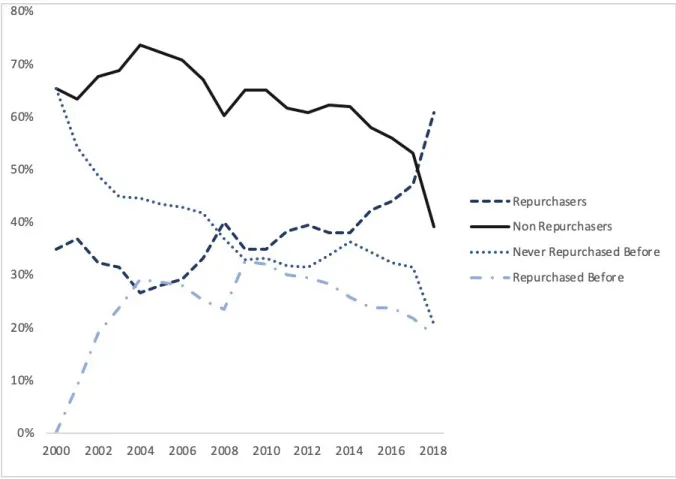
Figure 1 Percentages of sample firms divided into different repurchasing groups. Firms
included were retrieved from NYSE, AMEX and NASDAQ stock exchanges between 2000 and 2018. ... 11
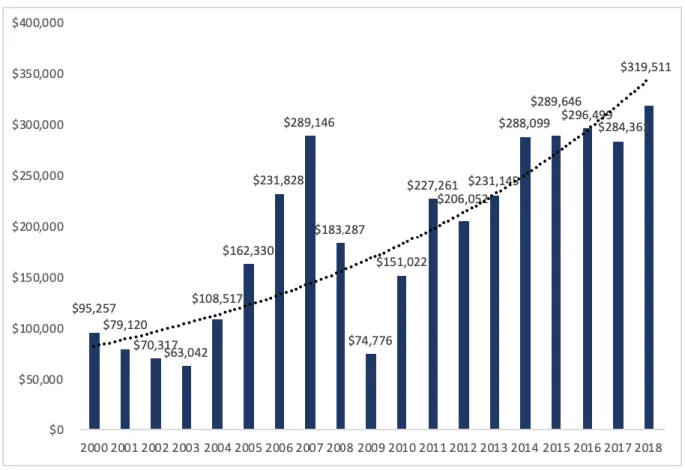
Figure 2 Amount spent by the sample firms that repurchased stock. Firms included were
retrieved from NYSE, AMEX and NASDAQ stock exchanges between 2000 and 2018. ... 14
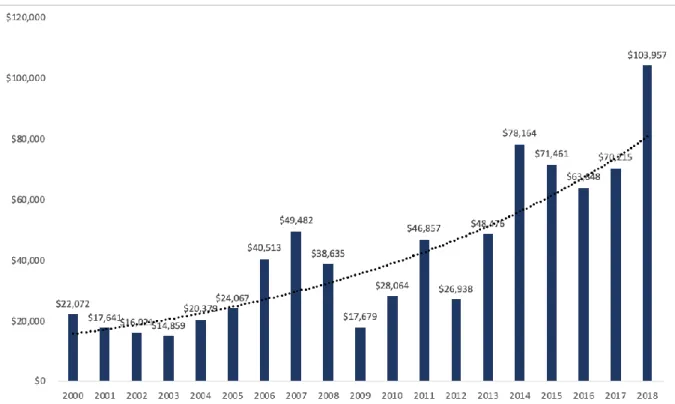
Figure 3 Amount spent by the Big Tech industry selected firms that repurchased stock. Data
Table of Contents
1 INTRODUCTION ... 1
2 LITERATURE REVIEW ... 4
3 METHODOLOGY ... 8
4 RESULTS ... 10
4.1 TIME TREND OF SHARES BUYBACK ... 10
4.2 EMPIRICAL RESULTS ... 16
4.2.1 Characteristics of Share Repurchasing Companies per Hypothesis ... 16
4.2.1.1 Undervaluation Hypothesis ... 16
4.2.1.2 Flexibility Hypothesis ... 19
4.2.1.3 Leverage Hypothesis ... 22
4.2.2 Regression Results (Logit Regression) ... 23
4.3 BIG TECH ANALYSIS ... 25
4.3.1 Motivations for Stock Repurchase ... 25
4.3.2 Repurchasing pattern ... 27
5 CONCLUSIONS... 29
6 FUTURE RESEARCH ... 31
7 APPENDICES ... 32
1 Introduction
The beginning of the era of share repurchasing was not long ago. During the 1980s share repurchasing was considered a form of stock value manipulation and was regarded as an illegal action. Nevertheless, in the U.S.A., it was fundamentally permitted by the Securities and Exchange Commission (SEC) in 1982 (Alsin, 2017).
In the 1970s share buybacks were prohibited in the U.S. since there was a pending concern that top-level executives would use this particular method of paying shareholders to exploit market inefficiencies. As a consequence, there were no share buybacks preceding that date. Notwithstanding, in 1982, with the President Ronald Reagan’s administration, there was a complete reversal of the buybacks in the corporate world. The President and his governance decided to keep their deregulatory urge and create a newly reformed Securities Exchange Act (Rule 10b-18) which enhanced the possibility of effectively carry out share buybacks (Denning, Why It's Raining Share Buybacks On Wall Street, 2018). The now revoked rule and the creation of the new one made room for a new shift in mentality which opened the gate for a culture of shareholder value instead of stakeholder value. The reverse in attitude towards the market, from a company’s culture that was focused on increasing profits but, nevertheless, considered a corporate social responsibility towards the stakeholders (stakeholder approach), was abolished for a new attitude. This attitude was defined in the economist Milton Friedman’s words “the social responsibility of business is to increase its profits”, which defined a new era more preoccupied with the wealth of the shareholders than ever before (Thomas, s.d.). The overall concept was that the market would work as a disciplinarian for the money gathered by the companies for investment use. In essence, if there was no attractive investment opportunities, instead of keeping the money for future investments, which could be dangerous taking into account the possibility of hostile takeovers, or applying it in suboptimal projects, the company’s executives would return money to the investors using the share repurchasing method (Whitehouse, 2018).
Needless to say, the SEC could not announce into the market that a once before illegal rule that didn’t allow stock price manipulation, would now be taken out of the law books. For that reason, an exceedingly complex new rule was passed in order to allow the buybacks but would also protect the companies that did it in the interest of making it harder to others to legally challenge it. In the end, the new decree opened the gates for a borderline limitless repurchasing era (Denning, Why It's Raining Share Buybacks On Wall Street, 2018). The era mentioned, arrived and created a trend followed by most companies in the U.S.. The findings
reached during this paper demonstrate that, from the sample retrieved in the U.S., in the year 2000 already 35% of firms were already exercising the option of paying off shareholders in this form, a tremendous increase from the close to 0% prior to 1982. Moreover, in 2018 the findings registered a tremendous increase again, recording a rise to 60.8% of firms repurchasing their stock, displaying the power of this trend.
Now, thirty-five years after the rule changes that occurred in 1982, the scrutiny over this process has finally come and in force. Some call it a process that creates short-term returns instead of thinking of the long term prosperity of the companies, and that creates a “sugar high for the corporations” (Warren, 2015). Others examined the justifications some companies give in order to begin the buyback proposal. Starting with Lazonick’s thoughts on buybacks inability to create value but systemically eradicate the value for the holders of shares in the long-term, to the suppose examination and discovery that the “no good investment opportunity is available” statement is just a reflection of poor job by the managers in finding suitable investments to sustain growth (Lazonick, 2014). The scrutiny does not end here. One of the major arguments used against the whole process since the new bill was approved by the SEC is that from the moment the rule come into place, until 2013, the compensation of companies’ CEOs rose more than 937%. However, the blue collared workers’ compensation increased merely 10% (Denning, How CEOs Become Takers, Not Makers, 2014). Moreover, the increasingly shocking component is that ever since the 1980s, once again after the rule change, the workers’ compensation has becoming less linked with their productivity which seems consistent with the idea that the incentives are becoming ever more one sided to the shareholders and executives.
The truth is that after all the analysis and scrutiny that this subject has been subjected to, many have been trying to invent and create possible regulations that will calm the frenzy that the last few years have shown for share buybacks. One proposal that gain some strength last year has been a new bill called “The Reward Work Act”. The bill is supposed to revoke the SEC 10b-18 rule and requires that all publicly traded companies let a third of their company’s board be selected by their own workers (Denning, Why It's Raining Share Buybacks On Wall Street, 2018). This would give one of the bigger stakeholders, the workers, power over some decisions. Moreover, there are some ideas speculating also that shareholders should vote on share repurchases (Alsin, 2017). The reasoning is that shareholders would now have the control over the executives and not the other way around, eliminating the asymmetry of information issue. Berkshire Hathaway, which is one of the largest conglomerate holding companies in the world, as recently decided to change their stock repurchase policy by applying this approach
and letting Warren Buffett, company’s CEO, and the shareholders decide if they believe that the shares are undervalued and granted them the right of determining if they should or should not do a buyback (Caplinger, 2018).
With the entire inquiry on buybacks, people might have lost some focus on the other reasons on why enterprises execute share buybacks. There are indeed several understandable motives for this process to occur that go further beyond the morally questionable and deeply analysed executive stock options and short-term value enhancements. Just as demonstrated by the Berkshire Hathaway example, motives such as the shareholders’ perception of company’s stock being undervalued is a fine reason for this process to occur.
After careful exploration of the above-mentioned matters, the purpose of this paper is to understand if several other motivations are still valid today, in the U.S., keeping in mind the changes created economically and politically by the last and current administrations. For that reason, the research questions proposed to investigate are the following: “Are share buybacks
still a trend?”; “Are there specific motivations and characteristics that firms possess that lead to the continuation of the movement?”; “Is the movement general to all firms or is the technology sector setting a new pace?”.
The paper will be initiated with a trend analysis to understand if, in fact, the movement is still an ongoing tendency among the U.S. firms during the period of 2000-2018. In fact, it is proven during the study that it has continued to be a tendency to execute this form of payout policy. It is not only demonstrated that 2018 was the year were most firms assumed a buyback position, with 60.8% making sure that bought back stock, but also, since 2000 the total amount of dollars spent on share buybacks more than tripled until 2018, from approximately $95 billion to $320 billion, in 2000 and 2018 respectively.
Following suit, an analysis of three distinct motivations was carefully conducted in order to justify the tendency for the firms to adhere this movement outside of the already mentioned stock option compensation for managers and executives and to understand if there are clear characteristics firms that repurchase stock possess. By choosing to study three different hypotheses, the Undervaluation hypothesis, the Flexibility hypothesis and the Leverage hypothesis, several insights were possible to discover. The findings reveal that, on average, firms that repurchase stock have higher cashflows than firms that don’t, 1.8% and -10.9%, respectively, which confirms the flexibility hypothesis. However, surprisingly, firms that did not make any repurchase had, on average, a cash total 4.1% higher than the ones that did. Regarding the undervaluation hypothesis, the most insightful finding was that firms which had the repurchasing programs had both higher returns and were bigger in size. Lastly,
regarding the leverage, the study revealed, as expected, that firms which repurchased stock do have a higher leverage index than the ones that didn’t on average, 7.2% and 4.5%, respectively. The finding is not surprising since by effectively restructuring the capital structure, it will be possible to take advantage of the tax shields provided by the interests. Moreover, with the changes in taxation laws in the U.S., this variable may be one of the most important ones to study in today’s market.
Lastly, the paper reflects on the specific case of technology sector, specifically the Big Techs, and the sudden motivation to start buyback activities. Corporations can essentially choose between 4 options on what to do with the excess cash: pay dividends to investors; acquire a company or a business segment; invest in the business itself; or repurchase their stock. So why are they choosing repurchases over the others at this moment? Following the tax reforms of the Trump administration, one of the arising motivations it provided was the lack of necessity to continue to pile cash. With that being said, tech companies have been living a parallel trend apart from the debt repayment, the resurgence of buybacks. Other than sitting on their cash piles or just repay debt, the Tax Cut bill reformed also provided the necessary incentive for the firms to repurchase their stock and search for the optimal capital structure as well as elevating their stock price. The findings of this paper show that, in fact, the U.S. ten largest tech companies are following the tendency and making sure they take full advantage of the most recent laws available. In the year 2000, for the sample of firms selected, the study shows that approximately $22,072 million were spent on share buybacks. It would be a surprising number if one did not acknowledge that nearly every year since, the number has been increasing reaching a grand total of $103,957 million for the year 2018.
2 Literature Review
Throughout history there has been no consensus on whether the decision to repurchase shares is, in fact, a better hypothesis than the distribution of dividends, or even if a combination of the two is the optimal approach. Modigliani and Miller were the first ones that scrutinized this dilemma and established that in efficient capital markets, a rational investor does not have any preference on whether they choose capital gains or dividend distribution (Miller, M. H., & Modigliani, F., 1961).
The decision to buyback shares is often associated with the preferred flexibility that the shareholders want over the timing of the cash distribution. The flexibility it provides is greater than the one dividends do due to many reasons. According to Sonika, Carline and Shackleton at the time the firm announces the intention to buyback its shares, the option to return cash to
its shareholders is in place without the firm committing to (Sonika, R., Carline, N. F., & Shackleton, M. B. , 2014). Going a step back and combining the work of Lintner that introduces the idea that firms are very reluctant to cut dividends and that, when they actually do such a move, they are faced with a very strongly negative stock price reaction (Lintner, J. , 1956), with the work of Denis, Denis and Sarin there is confirmation that the average stock price declines 6% once the dividend cut happens (Denis, D. J., Denis, D. K., & Sarin, A., 1994). One can understand, once again, the flexibility that is provided by repurchasing shares. Buying back its shares does not have any negative impact on the share value and, furthermore, the removal of a firm repurchasing program has not shown to also affect negatively the share price after. This finding was later proved again by the aforementioned Sonika work. However, the flexibility provided by buybacks is merely one more reason on why firms have these shares repurchases’ programs. Nevertheless, the flexibility hypothesis goes one step further with Guay and Harford. They hypothesized that firms would choose repurchasing shares if they were looking for short-term returns and dividends when there is long-term orientation for the future of the company (Guay, W. , Harford, J., 1999). Nonetheless, other works already provided the idea that repurchasing is related with short-term performance and hence related with free cash flow hypothesis than with steady increase and long-term objectives (Chan, K., Ikenberry, D., & Lee, I., 2004).
Other motives also include repurchase stock to increase the leverage ratio. This hypothesis has already been scrutinized in both Bagwell and Shoven and in Opler and Titman. The two main benefits of this approach are: in first place, the interests that came from the debt are tax deductible which means that by acquiring more debt and changing the capital structure the company is providing more tax shields for themselves (Opler, T. C., & Titman, S. , 1994). This makes the after-tax cost to be below the stockholders’ expected Return on Equity (ROE), which helps the company on lowering the cost of its capital; the second benefit is to impose stricter rules on management. The substantial debt incurred in to repurchase shares prevents managers to be able to invest in projects that earn returns below the cost of capital of the company (Bagwell, L. S., & Shoven, J. B. , 1989). The new debt serves as a blindfold for the negative NPV projects in which management may at times want to invest funds in.
Moreover, companies also use repurchase to defend from unwanted takeover bids. Often when faced with this picture, a firm uses either the excess cash or contracts more debt to buyback shares and this way making the company more unattractive to the acquirer. Bagwell explained how this can be more effective for the firms to defend from the takeover attempt
since the cost to the acquirer is bigger with this method than by distributing dividends or simply do nothing (Bagwell, L. S. , 1991).
The undervaluation hypothesis is also one of the most common reasons on why firms repurchase their stock. Ikenberry, Lakonishok and Vermaelen found that for the time span between 1980 and 1990, “value” stocks, which are firms more likely to buyback their stock due to more observable undervaluation, had, on average, abnormal returns of 45.35% for a four year period, whereas, no upwards tendency of abnormal returns was registered for “glamour” (growth) stocks, which are firms where the undervaluation factor is less likely a motive (Ikenberry, D., Lakonishok, J., & Vermaelen, T. , 1994). Chan, Ikenberry and Lee (2004) confirm the undervaluation theory by investigating the repurchase in the open market with three hypotheses: mispricing, free cash flow and capital structure. They divided the data into short-term and long-short-term to validate the undervaluation hypothesis, and also the flexibility hypothesis, and found evidence that, for the long-term, “value” stocks repurchase have shown to have abnormal returns and confirmed the theory (Chan, K., Ikenberry, D., & Lee, I., 2004). Going one step further on the various hypothesis of shares buybacks, the signalling hypothesis touches briefly on the last paper mentioned since they referred that managers engage in a repurchase when they feel confident that the best investment the firm can make is, in fact, buyback their own shares (Chan, K., Ikenberry, D., & Lee, I., 2004). Consistent with Vermaelen, firms when inducing in a repurchase program often offer a higher premium to the market to send a positive signal (Vermaelen, T. , 1981). They prove that abnormal increases in earnings per share appear after the announcement of the buyback of its own shares. However, many other studies have been coming to disprove this theory. Companies have to be aware that many other moves may deflect the positive one sent by the repurchase and it ends up being a bad move. The firm needs to be fully consistent in other areas and deals. For instance, an acquisition that does not go through, downwards financial results and low profitability will send more powerful signals and may completely ruin the prior ones. One other reason to why the signalling theory has been controversial is because there are cases were the signal emitted by a shares buyback is that the firm has little to no realistic opportunity on what to invest their money other than themselves (Pettit, 2001). This signal will be read by the market as a negative one and will induce the holders to sell their shares.
Nonetheless, following the concurrent theories that do agree with the undervaluation hypothesis, an agreeable one is the executive compensation hypothesis. A recurrent subject in firm’s in-house problems is the agency problem. Often described as the relationship between agents (managers) and principals (shareholders) and the information asymmetry between both,
is a clear incentive for repurchases to appear. In the event of a firm choosing to buy their “undervalued” shares, they choose to include them in treasury stock. This is key to provide them as an incentive to managers and executives in order to keep their objectives aligned by giving them certain stock options (Wronska & Sklodowska, 2013). To reduce the agency problem between the two parties Teng and Hachiya suppose that firms give the stock options in order to achieve this goal. They felt that it provides clear goals and more importantly it reduces the mistrust between the insiders (managers) and outsiders (Teng, M., & Hachiya, T. , 2013).
As previously indicated, executive compensation is in fact not merely another motive but presumably the one which started the entire movement. For these executives, the benefit of having the company repurchasing its stock, is to gain on the surge in price of the shares and exercise their large amount of options when the price is at the highest value. Even though, the justification in many cases is the undervaluation of the stock, the truth is that numerous times it is only for self-benefit.
When comparing dividends to share repurchases, yet another motive on doing a share buyback emerges. There have been times when the dividends have higher taxes than capital gains, and in those moments the rational investor will prefer to postpone the taxation and the company will pay their shareholders with a repurchase (Black, F. , 1976). However, the solitude of the tax factor as a reason for the share repurchase has been consensually determined as not a good factor alone to engage in buyback (Stephens, C. P., Jagannathan, M., & Weisbach, M. S. , 1999). However, the ongoing discussion between dividends and repurchases and the substitution hypothesis between both, has not reach any consensus so far. Evidence from Lee and Suh has shown that companies do not often restrict the dividend payment to incur into a stock buyback (Lee, B. S., & Suh, J. , 2007). Nonetheless, to contradict this point, a number of researches has also been stating that firms use money for repurchases which was intended for a dividend payment (Grullon, G., & Michaely, R. , 2002).
As has been shown, the motives for shares repurchases are many and the studies that have been conducted came to prove each reason. However, many others have disputed these ones and one of the reasons that can be argued is that most studies do not focus on the entirety of the possible motivations, but just on one or a fraction of them. The majority of the studies come to ignore not only other possible motives for the repurchase program, but also, the idea that firms will only repurchase stock when a combination of the motives is in place. In this study, the combination of motives is studied as a whole, with the aim of reflecting truthfully the repurchasing choice of firms.
3 Methodology
To be able to perform an intensive analysis of the subject at matter, a set of data was retrieved from the Wharton Database and from Thompson Reuters. The data comes from the NYSE, AMEX and NASDAQ, three of the largest stock exchanges in the world and, in order to get the most data possible from the stock exchanges, it was retrieved from the CRSP/Compustat Merged when using Wharton Database.
As stated before, since the study will only be focusing on the time period between 2000 and 2018, only data from that time span was considered. Moreover, the study will only be concentrated in the USA market which results in data from a total of 12,001 companies.
From the initial data, each of the observations recorded from each company had information about 16 data parameters from the Wharton Database: The Standard and Poor’s Identifier, Data Year – Fiscal year, Total Assets, Book Value per Share, Capital Expenditure, Cash, Common Shares Outstanding, Total Debt including Current, Earnings per Share – Excluding Extraordinary Items, Net Income, Net Cash Flow from Operating Activities, Purchase of Common and Preferred Stock, Dividends per Share – Ex-Date – Calendar, Total Market Value – Fiscal Year, Standard Industry Classification Code and Company Initial Public Offering Date. Moreover, due to incoherencies in the IPO date of a portion of the companies and substantial absence of the aforementioned variable in others, led to the use of Thompson Reuters in the interest of amend this pending issue. Hence, with the combined use of the two databases, a new total of 8,229 corporations was reached to perform the analysis. Lastly, with the purpose of holding a practicable and proper set of workable data, any observation without data on Purchase of Common Stock or any other variable was automatically excluded from the dataset with the objective of possessing a dataset that was possible to analyse and that would be completely free of errors. The final and resulting dataset that was reached contained 672,480 as total number of observations from 7,023 different corporations.
Each company was then classified into several categories depending on their past behaviours of share repurchase. The categories were the following: (1) Repurchasers (R), if the company had repurchased any of their shares in the current year that is being analysed; (2) Non-repurchasers (NR), if the company didn’t incur in any share repurchase in the current year that is being analysed. The previous category (NP) was then subdivided into two: (2.1) Never Repurchased Before (NB), if the firm had never repurchased shares in any of the years prior; and (2.2) Repurchased Before (RB), if the firm had already repurchased shares in any of the years prior but did not in the year that is being analysed. The third main category was (3) Not
Listed Companies (NL), if the firm was not yet public during the year analysed and the fourth and last category (4) was Missing Observations (MI), if the company’s observations are missing from the database due to merger, delisting or simply no information available.
To evaluate the former explained theories on share buyback, the analysis conduct is based on seven variables in addition to the Purchase of Common and Preferred Shares, in this paper mentioned as Repurchase of Shares, which was treated as a dummy variable with value equal to 1 if the company incurred in any share repurchase and 0 otherwise, for each of the years of the timeframe. The seven variables chosen to conduct the impact on share repurchase were: Cash / Total Assets (Cash), Cash Flow / Total Assets (CF), Cash Dividends / Net Income (Div), Market Value plus Debt / Book Value (MVBV), Natural Logarithm of the Total Assets (Assets), Total Earnings / Market Value (Earn) and Total Debt minus Cash / Total Assets (Leverage).
The variables chosen derived from the need to test for the various possible motives of share repurchase. Variables as MVBV, Assets and Earn were added to test for the undervaluation hypothesis. MVBV and Earn are proxies to test for the erosion of the stock performance and Assets for the firm size and as a proxy for the information asymmetry that may occur in smaller firms when compared with bigger firms. To test for the flexibility between dividends and share buyback, the variable Div was included as an attempt to understand if there is a correlation, or not, between the two most common paths of paying back to shareholders. Cash and CF are proxies of distribution of excess capital that were incorporated to test for the flexibility hypothesis. Lastly, Leverage is the variable that will test for capital structure and how it will affect the company’s decision between paying taxes or possibly repurchase shares. As a way of testing the veracity of the influence of the chosen variables that one considers to be the characteristics that influence the decision and motives to incur in share repurchasing, a logistic regression was conducted. Due to the ordinary notion of the dependent variable (binary, 1 or 0), the typical method (OLS) would distort and compromise the results. The regression run was:
𝐿𝑛 ( P
1−P ) = 𝛽0 +𝛽1MVBV(𝑡 − 1)+𝛽2Earn (𝑡 − 1)+𝛽3Assets (𝑡 − 1)+𝛽4Div(𝑡 − 1)+ β5Cash (𝑡 − 1) + β6CF (𝑡 − 1) + 𝛽7Leverage (𝑡 − 1)
Finally, the timeframe chosen was selected to represent the digital based era, which is one of the great areas of interest of this project, as well as the periods created for the analysis were carefully and purposely selected to represent critical eras of the recent past history such as the crisis of 2008.
4 Results
4.1 Time Trend of Shares Buyback
As highlighted in the outset, the primary target of this study is to conclude if the buybacks are still a gaining force in firms in the U.S.. As previously mentioned, the analysis was conducted by separating the firms into categories: (1) Repurchasers (R), (2) Non Repurchasers (NR), (2.1) Never Repurchased Before (NB), (2.2) Repurchased Before (RB). Furthermore, it was included in Table 1 a new category called New Lists, to demonstrate which portion of the sample size reflects the new publicly traded companies.
Commenting first on the sample’s size, one can denote that it decreased vastly between 2000 and 2018, where the firm sample is almost three times lower. Even when comparing it with 2017, a year where there is more information, the sample is still reduced from 3,102 to 2,011 companies, for the years 2000 and 2017, respectively. There are two main factors that have to be taken into account when verifying these results. The first one is the Dotcom bubble that burst in the year 2000 and that firms did not fully recover from. It is observed that, for the years to follow, the number of firms in the sample drops almost every year which confirms the statement. Moreover, the second one is the crisis of 2008 that also contributes to the massive decrease in the sample. In 2008, the study records a total of 2,069 companies fit for analysis. However, in 2011, the first complete year out of the crisis cycle for most firms, the sample was already reduced 10.7%, hitting an all-time low for the timeframe chosen of 1,847 corporations, excluding the year 2018.
Regarding the most important metric being studied, the results are going in the opposite direction, where the numbers of firms that developed shares buyback programs are increasing particularly towards more recent years. When comparing the first year of the timeline, 2000, with the last one, 2018, the overall percentage of repurchasing firms, per year, increased from 34.8% to 60.8%. These results denote an increase of a 74% between both years, an astonishing surge and a staggering number that proves the trend is still largely present in today’s financial corporations’ mindset. Nevertheless, observing the findings in detail, a slight decrease occurs between 2001 and 2004, from 36.7% to 26.5%. These findings can be associated with the Dotcom bubble bursting, leaving the corporations focusing more of their resources on survival than in purchasing their stock.
Figure 1 Percentages of sample firms divided into different repurchasing groups. Firms included
Counts of sample firms 2000 2001 2002 2003 2004 2005 2006
All firms 3102 2762 2496 2414 2375 2339 2237 New lists 349 75 72 74 190 189 199
Percentage of sample firms 2000 2001 2002 2003 2004 2005 2006
Repurchasers 34.8 36.7 32.3 31.4 26.5 27.9 29.2 Non Repurchasers 65.2 63.3 67.7 68.6 73.5 72.1 70.8 Never Repurchased Before 65.2 54.3 48.9 44.9 44.4 43.5 42.8 Repurchased Before 0.0 9.0 18.8 23.7 29.1 28.6 27.9 New lists 11.3 2.7 2.9 3.1 8.0 8.1 8.9
Counts of sample firms 2007 2008 2009 2010 2011 2012 2013
All firms 2151 2069 2053 2026 1847 1875 1916 New lists 223 69 59 115 103 126 196
Percentage of sample firms 2007 2008 2009 2010 2011 2012 2013
Repurchasers 33.1 39.9 34.9 34.9 38.3 39.3 37.9 Non Repurchasers 66.9 60.1 65.1 65.1 61.7 60.7 62.1 Never Repurchased Before 41.7 36.7 32.7 33.2 31.7 31.3 33.7 Repurchased Before 25.2 23.4 32.4 31.8 30.0 29.4 28.4 New lists 10.4 3.3 2.9 5.7 5.6 6.7 10.2
Counts of sample firms 2014 2015 2016 2017 2018 2000-2018
All firms 2000 1960 1974 2011 1167 7023 New lists 217 167 101 137 33 2694
Percentage of sample firms 2014 2015 2016 2017 2018 2000-2018
Repurchasers 38.1 42.1 44.0 46.9 60.8 36.4 Non Repurchasers 61.9 57.9 56.0 53.1 39.2 63.6 Never Repurchased Before 36.2 34.1 32.4 31.4 20.6 40.7 Repurchased Before 25.7 23.8 23.6 21.6 18.6 23.0 New lists 10.9 8.5 5.1 6.8 2.8 38.4
Table 1 Counts and percentages of sample firms divided into different repurchasing groups. Firms
Surprisingly enough, during the crisis period, denoted in this paper as the period between 2008 and 2011, firms did not react the same way as in the Dotcom period. In table 2, when comparing the period between the years 2008 and 2011 and the period between the years 2000 and 2003, the number of firms which repurchased their shares is higher in the one that characterises the crisis, 37.1% and 34.1%, respectively. The numbers found further confirms that the mentality was changing increasingly and that even during the hard times, that was the crises of 2008, firms did not, at that moment, changed the way they were starting to behave. As a matter of fact, the companies that did survive the crisis still bought back stock. The strong culture of buying back shares was, at that point in time, fully rooted into the heart of companies and since then it hasn’t seen any deceleration. As demonstrated by table 2, in the period between 2012 and 2015, the number increased again to 39.4% and lastly between the 2016 and 2018 period the highest figure was recorded with a record of 49.8% of firms repurchasing shares in the market. Moreover, in table 1, the findings show that since 2013 there isn’t one single year when the percentage of share repurchasing firms didn’t increase. The continuously increase of the number of firms that aim to buyback their shares, within many reasons, might also be associated, in the more recent years, with the tax reforms the governance of President Trump did, creating an even more suited environment for firms to incur in these practises.
Percentage of sample firms (percent)
2000-2003 2004-2007 2008-2011 2012-2015 2016-2018 2000-2018
Repurchasers 34.1 29.3 37.1 39.4 49.8 36.4 Non Repurchasers 66.1 71.0 63.1 60.7 51.9 63.6 Never Repurch. Before 55.2 43.2 33.7 34.0 30.1 40.7 Repurchased Before 19.1 27.8 29.8 27.0 21.9 23.0
Regarding the Non Repurchasers category, when a closer observation is conducted on the two sub categories within, it is possible to discover two important findings. First, as table 1 shows, although the Never Repurchased Before category starts with a large number, 65.2% in 2000, this number slowly decreases nearly every year. Mid way into the sample period, 2009, the number decreased to 32.7%, a decrease of approximately 50%. For the following years, the percentage remains similar, however, near the end of the timeframe another decline takes place. In 2018, the last year of the sample, the number registered was 20.6%. These observations are
Table 2 Percentages of sample firms divided into different repurchasing groups and year groups.
Firms included were retrieved from NYSE, AMEX and NASDAQ stock exchanges between 2000 and 2018.
interpreted as a proof that more companies are starting to exercise their right of buying back shares and that there are increasingly less firms in the U.S. which have never done a repurchase of their own stock. Once again, there is confirmation that this culture is progressively more ingrained in the corporations’ heart.
The second finding regards the firms that have Repurchased Before. Just as the last finding mentioned, the inferior value registered for this category in 2018, 18.6%, represents the change in culture that was mentioned. Unlike, the Never Repurchased Before category, the numbers in this one started to increase until 2009 when the greatest value is recorded, 32.4%. Since then, the number declines steadily through the whole period, reaching the lowest value in 2018, 18.6%. The decrease in the observation’s value reveals that less firms are starting to repurchase their stock and stop departing from that trend. Firms, once they commence to buyback shares, generally, do not stop. The number of dollars may differ, however, the attitude towards the programs remains unchanged.
Figure 2 Amount spent by the sample firms that repurchased stock. Firms included were retrieved
At long last, the final reference needed to be made regards the amount spent by firms on stock buybacks. As evidenced by figure 2, the capital expended by U.S. corporations increased tremendously in the last two decades from $95,257 million, in the year 2000, to $319,511 million, in the year 2018. This growth displays the strong push that corporations have done towards repurchasing. Particularly in the last six years, the dollar volume expended has not come below $231,145 million and the tendency is to keep increasing as the years progress. Furthermore, the last seven years combined sum a total of approximately $1,888,000 million, which is greater than the sum of the prior twelve years, $1,735,000 million, with no sign of slowing down.
Nonetheless, it is possible to observe two declines in the period studied. The first one, once again, denotes the period after the Dotcom crash. The volume of funds used to buyback shares decreased each and every year until 2003, and only started to increase again in 2004 when it almost doubled the amount of 2003. The second deceleration is recorded in 2008, the crisis period initiation, when the amount expended drops to $183,287 million from the $289,146 million in 2007. Opposing to what was last seen, where the percentage of firms which incurred in stock repurchasing increased during this period, the funds directed to it declined in 2008 and 2009, and only recoopered and gained some strength in 2010. Yet again, there is the perception that although firms went through difficult times and spent less money on this issue, the culture and mentality remained intact and there was, in fact, an increase of firms that repurchased shares.
4.2 Empirical Results
4.2.1 Characteristics of Share Repurchasing Companies per Hypothesis 4.2.1.1 Undervaluation Hypothesis
Table 3 Average firm Market to Book Value, Earnings (measured by Earnings over Market
Value) and size (measured by total Assets). The values shown are aggregated values for the firms in each of the different repurchasing groups, averaged over the years in a period.
2000-2003 2004-2007 2008-2011 2012-2015 2016-2018 2000-2018 MVt/BVt (percent)
All Firms 300.0 334.4 1446.0 373.1 596.7 583.8 Repurchasers 283.7 442.8 238.9 496.1 394.6 365.7 Non Repurchasers 308.4 290.0 2154.5 293.3 790.8 708.5 Never Repurchased Before 297.6 246.9 3801.9 288.8 1432.7 955.9 Repurchased Before 356.8 356.8 270.1 298.7 -76.7 270.4
Earningst/MVt(percent)
All Firms -47.6 -7.8 -35.0 -20.0 -18.9 -27.4 Repurchasers -21.6 -0.4 -11.0 -5.4 -4.5 -9.4 Non Repurchasers -61.0 -10.8 -49.1 -29.5 -32.8 -37.6 Never Repurchased Before -68.6 -10.3 -65.9 -23.8 -28.2 -43.6 Repurchased Before -26.8 -11.5 -30.0 -36.7 -39.1 -27.1
Assetst ($ millions)
All Firms 2124.4 2925.7 4042.6 5295.0 7115.8 3913.0 Repurchasers 3985.1 7431.7 7294.4 10073.2 11482.2 7786.9 Non Repurchasers 1167.8 1076.9 2133.9 2196.3 2922.2 1697.1 Never Repurchased Before 885.6 946.6 1466.8 1579.9 1713.8 1179.8 Repurchased Before 2442.3 1279.3 2897.1 2976.3 4555.3 2613.3
In section 3 of this study, the variables that would be introduced to study this hypothesis were the Market-to-Book Value, the Earnings-to-Market Value and the Total Assets. The Market-to-Book Value and the Earnings are the ones chosen as proxies to study the stock performance erosion and consequently justify the firms that do repurchase their shares.
After the previously conducted research, the expectancy for the first variable is to find values that are lower for firms that bought back their stock than for firms which did not. The expectancy comes from the fact that when the market value is lower than the book value, the market tends to label those firms as undervalued, whereas the market value is trading higher than the firm’s book value it tends to label them as overvalued. For the first variable, as it is
constructed as market value over book value, percentage wise a value above 100% should be consider from an overvalued firm and below 100% from an undervalued one. In table 3, when observing the variable MVt/BVt, the findings denote that throughout the period there is not, on
average, a single point in time where the overall sample is considered to be undervalued as all the values for the two main categories are above the 100% threshold. Nevertheless, it is still noticeable that, on average, the firms that repurchased stock have a Market-to-Book Value lower than the corporations that decided not to have any shares repurchased. On average, for the whole period, the Non Repurchasers have a ratio of 708.50%, whereas the Repurchasers have a ratio of 365.69%, almost two times lower. Although none of the categories seems to be included under the undervaluation label, it is still recognizable that the market feels the market value of the firms that did not repurchased is trading at a more overvalued price than the market value of firms that repurchased their shares. However, even though the overall sample average for the two main categories gives those results, throughout the sample there are, in fact, periods where the corporations that did not repurchased shares have lower Market-to-Book ratios than firms that did so. An example is the period between 2012 and 2015 where the Repurchasers have a ratio of 496.07% and the Non Repurchasers a ratio of 293.30%, leading one to believe that these results do not have a consistent reasoning behind them. As a matter of fact, in section 4.2.2 there is proof of why, in fact, the findings do not show a consistent behaviour.
The second variable studied to attempt to prove the undervaluation hypothesis was the Earnings generated by the companies, specifically using their earnings per share. In previous work, it was found that when firms announce the intention to do a stock buyback, there is abnormal increases in the firms’ earnings (Chan, K., Ikenberry, D., & Lee, I., 2004). Moreover, as the number of shares of the firm is reduced after the buyback happens, it is also logical that in the year of the repurchase the earnings per share would be greater. For those reasons, it’s expected to observe a greater Earnings-to-Market Value ratio in the firms which in reality incur in stock buybacks. However, it was also important to understand that stock that have had a decreasing earnings per share throughout the years would also be more susceptible to be bought. Nevertheless, this effect is very hard to study and to predict and therefore, in this study, instead of comparing the year-to-year earnings decrease of firms that repurchase stock against Non Repurchasers, it was chosen to analyse only the magnitude of the earnings of Repurchasers which should be bigger than Non Repurchasers due to the already mentioned abnormal returns after the announcement.
As expected, on average, firms that repurchased stock have a higher return than firms that did not repurchased their stock. For the whole period studied, Repurchasers show a ratio
of -9.44%, whereas Non Repurchasers a lower ratio of -37.60%. It is worth mentioning that from the beginning of the period observed, the earnings ratio has increased massively. In the period between 2000 and 2003, the first in the sample, Repurchasers and Non Repurchasers had ratios of -21.59% and -61%, respectively. These ratios have been increasing for both categories throughout the years, reaching -4.5% and -31.8%, for the period between 2016 and 2018, for Repurchasers and Non Repurchasers, respectively. For the Non Repurchasers category, the increase is recorded due to the subcategory Never Repurchased Before which have increased from -68.61%, in the period between 2000 and 2003, to -28.19%, in the period between 2016 and 2018. Nonetheless, there is still staggering observation to be made. Throughout the whole period, the Earnings-to-Market Value ratio seems to be negative, on average being -27.4%. The value is an aggregation of all of the companies in the United States suitable for the analysis, which might lead one to think that overall there is a tremendous number of firms which have been having negative returns over the years. Notwithstanding, the broader point was still confirmed leading one to notice than, in fact, Repurchasers have higher Earnings than Non Repurchasers.
Lastly, the last variable that was proposed to study the hypothesis was the Size of the firm here defined as Assets, or Total Assets. There are two main reasons behind the reasoning to choose this variable. The first has to do with the fact that in smaller firms might exist a higher degree of asymmetry of information between managers of the company and the market, which may lead to an advantage for these firms to repurchase their shares. On the other hand, there is also the second reason, which is exactly opposed to the first one. Since there is more information about larger firms, the market may disperse this information quicker, leading the managers to analyse their share price situation and believe what is being said and consequentially repurchase their shares. Larger firms’ information is constantly being scrutinized by market specialists and being divulged constantly. Moreover, the capital needed to incur in such strategy is of great dimension, something that also larger firms would be more suitable to expend. It is easy to believe that due to it, larger firms would incur more in share repurchasing, however, one can only hypothesise before looking into table 3.
After closer observation, on average, for the time period studied, Repurchasers are, in fact, larger than Non Repurchasers, recording a value for Assets more than four times bigger. In real terms, the Total Assets amount for firms that repurchased shares is $7,786.9 million and for firms that did not repurchased is $1,697.1 million. The results obtain confirm that the far more likely hypothesis is the second one where the information of larger firms is more
scrutinized and analysed which leads to executives to incorporate more what the market is suggesting them to do.
It is also striking to see, once the values are analysed, that firms of all categories have been consistently increasing their size. For the whole sample, the average firm size increased from $2,124.4 million to $7,115.8 million, resulting in a total three times bigger when comparing the period between 2000 and 2003 and the most recent one. Following suit, the Repurchasers have also escalated immensely in their firm’s size, going from a mere $3,985.1 million, in the period comprised between 2000 and 2003, to the highest value registered yet of $11,482.2 million for the time period between 2016 and 2018. Although the Non Repurchasers have also increased in size, the overall growth is shorter than the Repurchasers, registering an increase of almost three times but still a shy amount of $2922.2 million.
4.2.1.2 Flexibility Hypothesis
Table 4 Average firm Dividends (measured by Cash Dividends over Net Income), Cash (measured by
Cash over total Assets) and Cash Flow (measured by Cash Flow over total Assets). The values shown are aggregated values for the firms in each of the different repurchasing groups, averaged over the
years in a period.
2000-2003 2004-2007 2008-2011 2012-2015 2016-2018 2000-2018 Dividendst/NIt (percent)
All Firms 12.8 9.8 6.3 30.1 47.8 18.6 Repurchasers 0.6 9.4 -16.6 42.4 40.6 14.1 Non Repurchasers 19.1 9.9 19.7 22.1 54.7 21.1 Never Repurchased Before 12.8 9.0 14.7 12.5 64.1 16.8 Repurchased Before 47.6 11.3 25.4 34.3 42.1 28.6
Casht/Assetst (percent)
All Firms 15.0 15.0 16.6 17.6 16.7 16.0 Repurchasers 13.9 12.2 14.4 13.8 12.1 13.4 Non Repurchasers 15.5 16.1 17.8 20.1 21.0 17.5 Never Repurchased Before 15.9 17.5 20.2 23.5 25.3 19.0 Repurchased Before 13.9 14.0 15.0 15.8 15.3 14.8
CFt/Assetst (percent)
All Firms -10.9 -3.7 -3.2 -5.3 -7.5 -6.3 Repurchasers -1.8 3.3 3.8 2.6 1.9 1.8 Non Repurchasers -15.6 -6.6 -7.3 -10.5 -16.4 -10.9 Never Repurchased Before -16.9 -9.2 -12.1 -14.3 -24.1 -14.5 Repurchased Before -9.3 -2.7 -1.8 -5.6 -6.0 -4.4
The first variable this study investigates when it comes to the flexibility hypothesis is the Cash Dividends to Net Income. With this variable, the intention is to go into a specific hypothesis within the flexibility one called substitution hypothesis. The hypothesis suggests that are benefits within both payout methods. For the repurchasing shares side, as stated earlier, one of the most appealing incentives is that when the intention of doing a stock repurchase is announced, firms do not have to commit to as it will not, generally, affect their share price if they do not pursue with it in the end (Sonika, R., Carline, N. F., & Shackleton, M. B. , 2014). Dividends, on the other hand, induce a stronger stock reaction when firms decide to cut it. For that reason, there is an expectancy that firms which incur in stock buybacks will have a lower percentage of dividends to net income as they choose to allocate their firms more on this method as opposed to pay shareholders in the traditional form. As a consequence, the Non Repurchasers are expected to have a much higher dividends to net income ratio as they choose to pay in this form. Nevertheless, although one can recognize that there is a general belief that share repurchasing and dividends are mutually exclusive, later in this study, on section 4.2.2, this belief will be debunked.
As expected, table 4 shows that, in fact, firms that repurchased stock have, for the period studied, on average, a ratio 7% inferior to firms that did not follow the same methodology (14.1% for Repurchasers vs 21.1% for Non Repurchasers). The result also transmits the idea this paper already mentioned in the very beginning. The ratio of cash dividends paid by Repurchasers between 2016 and 2018 is lower and since it was already found that more firms are repurchasing stock, 49.8% between the same period (table1), one can safely say that the mentality of short-term profit talked in section 1 is again demonstrated. As Repurchasers constantly prefer to allocate a greater amount of funds towards repurchasing shares than paying dividends, as opposed to Non Repurchasers which allocate more, as Guay and Harford demonstrated, this concludes an attitude centred on fast return instead of long-term prosperity. The criticisms also described in section 1 arise once again from this mindset that is traced from this analysis.
As for the cash to total assets and cash flow to total assets variables, there was surprising findings. The results for cash flow behaved as they were expected to behave. On average, stock repurchasing firms had a cash flow of 1.8%, whereas firms which have not done it have a negative cash flow, -10.9%. Likewise, firms that repurchased shares in the past have the same performance on cash flows when compared with the ones which have never done it, -4.4% and -14.5%, on average, respectively. It was expected that this pattern appeared as firms that will repurchase shares need to have a good operational performance in order to keep generating
funds to pursue this strategy. As the findings in table 4 show, firms that buyback shares have always cash flows largely higher than Non Repurchasers, and, in fact, positive throughout the whole period, except for the period between 2000 and 2003, where the Dotcom crash happens. Otherwise, without funds, the only option would be to contract more debt and although they may have incentives to pursue that option, to have an optimal leverage ratio, contracting more debt can be dangerous as the company is originating more long-term financial expenses for itself. Attempting to have good operational performance and generating cash flows, is a better option for this type of strategy pursuing companies, and, as shown, this is what was found, although many still contract debt for other reasons.
As for cash to assets, the findings are opposite to what one would expect initially. In table 4, it is demonstrated that, on average, for the time period studied, Non Repurchasers have a ratio of 17.5%. This ratio is larger than what is found for Repurchasers, 13.4%. Moreover, throughout the sample periods, not only Repurchasers have always had a lower ratio than Non Repurchasers but it has been decreasing, having started in 13.9% for the period between 2000 and 2003, and declined to 12.1% for the latest period. On the other hand, Non Repurchasers have had the opposite relation. The ratio has not only been always greater but over the periods it has been increasing.
As mentioned, firms need the funds to incur in share buybacks and because of it, a higher cash to assets ratio was expected for firms which repurchased shares. Nonetheless, there are some reasons on why the findings may not be so confusing after all. First, the ratio is comparing firms in relative terms which means that the absolute value may, in reality, be greater for firms that repurchase shares. The second possible justification relates to the fact that if a firm constantly incurs in share repurchasing, the possibility is that they will not retain as much cash as others would leaving them with both less gross and relative amounts. However, the most interesting justification has to do with keeping excess cash and for what reasons. As mentioned before, firms which have a tendency to incur in share buybacks will assign a large portion of their funds to do this action, as they are more focused on short-term returns for shareholders and compensation for managers. On the contrary, firms that don’t, will tend to investigate profitable investments and only invest their money when they found the right one. As finding projects that bring a high ROE requires more investigation and, moreover, there are fewer that are worth taking, Non Repurchasers, the ones that tend to retain more funds in search of these projects, will end up having piles of cash and, consequentially, superior ratios than firms that repurchase shares.Despite that, earlier was mentioned that firms do share buybacks and give managers stock options in order to reduce the agency problems and mistrust between
shareholders and management (Teng, M., & Hachiya, T. , 2013). Managers at times incur in projects that have a return lower than the cost of equity for personal benefit since they are not monitored by shareholders. In conclusion, the fact that Non Repurchasers retain cash to invest in better projects may not generate, in the end, better returns for them. In fact, as proven by the findings, the overall generation of cash flow by companies that do not repurchase shares have been substantially lower than the ones that do.
4.2.1.3 Leverage Hypothesis
Table 5 Average firm Leverage ratio (measured by Debt minus Cash over total Assets). The values
shown are aggregated values for the firms in each of the different repurchasing groups, averaged over the years in a period.
As introduced in section 2, firms may incur in share buybacks in order to change the leverage ratio of the company. As previously mentioned, Opler and Titman found that firms would take such move in order to get their debt to assets ratio into the optimal point (Opler, T. C., & Titman, S. , 1994).
The findings on this study prove that such speculations are still valid today. From the sample studied, it was discovered that firms which repurchased shares have a higher leverage ratio than Non Repurchasers, 7.2% and 4.5% respectively. Additionally, Repurchasers have an average 1.7 percentage point higher than the overall sample, which is registered to be 5.5%. The outcome is not a surprising one since it is perceptible that with the stock buybacks, the ratio will increase, and the favourability of tax shields will also increase. This outcome leaves the market to believe they are actively seeking the optimal level of the leverage ratio, which again will be induced to increase as the assets, most likely cash, will decrease. In fact, since the period between 2004 and 2007, the ratio has always increased, reaching ultimately, between the period of 2016 and 2018, the highest value recorded for time period studied of 9.7%. Not only this conclusion can be reached but also the findings evidence the clear incentive to reduce funds (assets), and consequently increase the Debt-to-Assets ratio, in order to keep managers
2000-2003 2004-2007 2008-2011 2012-2015 2016-2018 2000-2018 Debtt/Assetst (percent)
All Firms 5.4 3.9 4.5 5.5 9.7 5.5 Repurchasers 3.2 5.6 5.0 8.9 15.1 7.2 Non Repurchasers 6.6 3.2 4.2 3.3 4.7 4.5 Never Repurch. Before 6.5 2.5 3.2 0.3 -0.9 3.3 Repurchased Before 7.1 4.4 5.3 7.1 12.2 6.5
in check. This way incentives the firm’s management to find projects that earn returns higher than the cost of equity, which otherwise might be left out of the executives’ radar.
In table 5, another interesting result is witnessed. When looking into detail to the Non Repurchasers subcategories, the average for the period studied, from 2000 until 2018, for firms that have already purchased their shares before but stopped, is higher than the ones which have never done such move. Firms which have done in some time in the past have, on average, a ratio of 6.5%, whereas firms that have never done it in their existence have, on average, a ratio of 3.3%. At long last, this observation is consistent with the previously made, which concluded that Repurchasers have a higher ratio than Non Repurchasers, on average. In this event, one can understand that firms which categorize under companies which have already before repurchased shares, due to their past events, will record the same attitude towards the ratio at study.
4.2.2 Regression Results (Logit Regression)
After a careful descriptive statistics analyses, a logit regression was performed not simply with the aim of testing if there were characteristics related to the propensity to incur in stock buybacks but also to confirm the results by understanding the significance level of each variable. The results presented in table 6 further confirm the suspicions already stated in the former findings presented, that some characteristics are very correlated with the propensity to incur in share repurchasing, while other are not.
Starting with the first variable MVBV, the results show that for the majority of the sample years it is not significant. The variable’s lack of strong significance level induces the conclusion that there is lack of evidence that it can be related with share repurchasing. The finding is consistent with the notion that was already created in section 4.2.1.1 where it was found that the Market-to-Book Value ratio seemed inconsistent. It was seen before that, in a portion of the periods, the MVBV ratio was higher for firms that repurchased shares and in other periods for the ones that have not done any stock buyback. The confusing results are now explained after the confirmation that the relationship is none existent.
The second variable analysed was Earn, which represented the Earnings over Market Value ratio. This variable revealed, with no surprise, that earnings are a characteristic that influences the repurchasing motivation of corporations since it is significant for the majority of the sample, lacking only in five out of the nineteen years studied. The positive average of the slope of the Earn variable, 0.272, demonstrates that firms which repurchased shares have, on
average, higher market adjusted earnings than firms that didn’t incur in such activities. Fact that was mentioned before and now confirmed with the regression.
The Assets variable was one of the most consistent throughout the regression findings. The strong significance level was found in all of the periods studied and when combined with the positive average slope discovered, 0.280, provides foundation to the already mentioned discovery that larger firms incur more frequently in share buybacks.
Aforementioned in section 4.2.2, the dividends case is one where a closer look must be taken. During the investigation of dividends payment by firms, the not very surprising conclusion that firms that repurchased shares paid less dividends was reached. However, it was mentioned that the dimension in which people think dividends and stock repurchasing are exclusive was going to be demystified. With the help of the results in table 6, the idea was debunked. As seen in the results, the Div variable is not significant in almost every year of the period, which leads to the understanding that there is no evidence that, in fact, low dividend payments or the absence of them, lead to stock buybacks. One can conclude that the misperception between the mutuality of both methods is not perceived to exist.
The Cash variable results demonstrate that the variable is significant on almost every year and that its slope is on average strongly negative, -1.574. On the other hand, the CF variable, set to study the cash flow of firms, has a strong significance level in every year of the period and its slope is strongly positive, 1.759. The findings on both of these variables further confirm the formerly mentioned results, which have constituted that firms with low cash levels but higher free cash flow, in proportion to their assets, have more incentives to pursue share buybacks.
Lastly, the Leverage variable is also highly significant in every year but with a strong negative average slope. Although, it evidences that it is a characteristic that influences the repurchasing motivation, it is, at a first glance, a shocking result to see a negative slope as it was earlier found that firms that repurchased shares had a higher leverage ratio. Nonetheless, a probable justification of the result arises from the fact that the regression was run with the leverages ratios of t - 1 and the repurchasing choice in t. The negative slope can be justified as the firms that in the period t incurred in share repurchasing had, in their perspective, a suboptimal leverage ratio in the period before and decided to elevate it in order to reach an optimal level.