0
Dissertation under the supervision of Professor José Carlos Tudela Martins
The Estée Lauder Companies Inc.
Equity Valuation Thesis
Mariana Branco Calisto 152416048 Msc in Finance
29-05-2018
Dissertation submitted in partial fulfillment of requirements for the degree Master in Finance at Católica Lisbon School of Business and Economics, May 2018
1
The Estée Lauder Companies Inc.
The Estée Lauder Companies Inc. is listed on the New York Stock Exchange under the symbol EL. It is a multinational company based in New York, New York. Today it is one of the world leading companies in manufacturing and selling prestige skin care, makeup, fragrance and hair care products.
The company is present in more than 150 countries and sells its products through more than 25 prestige brands, some owned and others licensed.
Prestige Beauty products are sold all over the world. The beauty market has been growing worldwide, especially in emerging markets. Regions like the Middle East, Africa, East Asia, Latin America and Eastern Europe are experiencing fast growth and the beauty industry is no exception.
In fiscal year 2017 The Estée Lauder Companies reached net sales of $11.82 billion, operating income of $1.69 billion and diluted earnings per share of $3.35.
The company has been increasing its dividend; in 2016 the dividend rate was increased by 25 percent and in 2017 increased yet again by 13 percent. Last fiscal year the company returned $899 million to stock holders’ through cash dividends and stock repurchases.
Source: Company Data, Calisto Securities, and Reuters
Source: Company Data
Mariana Calisto [email protected] Ticker EL Price Target: $158,44 Price (08/05/2018) $133,79 52-Week Range: $91-153 Shares Outstanding: (MM) 367.04 Market Cap.: (MM) $49,106.28
2 Abstract ... 6 Sumário Executivo ... 6 Acknowledgements ... 7 1. Introduction ... 8 2. Literature Review ... 9 2.1 DCF ... 9 2.1.1 Cash Flow ... 10 2.1.2 Perpetuity... 13 2.2 Multiples ... 14 2.2.1 Peer Group ... 15
2.3 Dividend Discount Model ... 15
2.4 Adjusted Present Value ... 16
2.4.1 Tax Shield... 16
2.4.2 Bankruptcy Costs ... 17
2.5 Option Pricing Theory ... 17
2.6 Sensitivity Analysis ... 17
2.7 The Estée Lauder Companies case ... 18
3. Global Overview ... 19 3.1 U.S. TCJA 2017 ... 19 3.2 Currency ... 19 3.3 Industry Overview ... 20 3.3.1 Products ... 21 3.3.2 Channels ... 22 3.3.3 Demographics ... 22 3.3.4 Geography ... 23
4. The Estée Lauder Companies Inc. Overview ... 25
5. Company Valuation ... 32
5.1 Revenues ... 32
5.2 Cost of Sales ... 35
5.3 Operating Expenses ... 35
5.4 Depreciation and Amortization ... 38
5.5 Interest ... 38
3
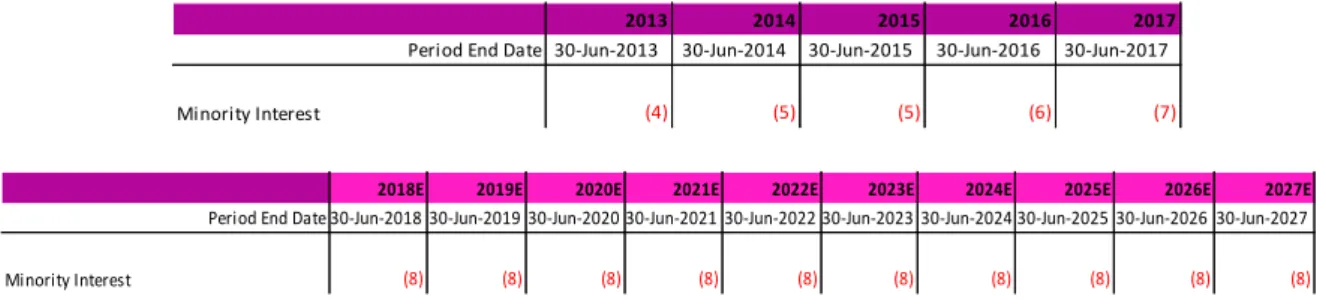
5.7 Minority Interest ... 40
5.8 Extraordinary Items ... 40
5.9 Shares, EPS and Cash Dividends ... 40
5.10 Free Cash Flow to the Firm ... 43
5.10.1 Growth Rate ... 43
5.10.2 Perpetuity Value ... 44
5.11 DCF ... 44
5.11.1 Tax Rate ... 44
5.11.2 Market Risk Premium ... 45
5.11.3 Beta ... 45
5.11.5 Cost of debt ... 45
5.11.6 Required Rate of return ... 46
5.11.7 WACC ... 46
5.12 Equity Value ... 46
5.13 Sensitivity analysis ... 47
5.14 Multiples ... 48
6. Investment Note ... 51
7. Comparison with Investment Bank Report ... 52
8. Conclusion ... 54
9. Appendix ... 55
9.1 Appendix 1 – Contribution from online sales between ranges of products ... 55
9.2 Appendix 2 – Contribution from online sales through geographic regions ... 55
9.3 Appendix 3 – Average net sales growth 2011-2016, year ended June 30 ... 56
9.4 Appendix 4 – Net sales as reported and in constant currency, year ended June 30 ... 56
9.5 Appendix 5 –Total stockholders return 2012-2017, year ended June 30 ... 56
9.6 Appendix 6 – Top outside holders of The Estée Lauder Companies ... 57
9.7 Appendix 7 – Net sales 2016- 2017 and forecasted net sales 2018 ... 59
9.8 Appendix 8 – Net sales 2013-2017 and forecasted net sales 2018-2027 (annual standardized in Millions of U.S. Dollars) ... 59
9.9 Appendix 9 – Debt and Facility tables ... 60
9.11 Appendix 10 – Income Statement (annual standardized in Millions of U.S. Dollars) ... 61
9.11 Appendix 11 – Balance Sheet (annual standardized in Millions of U.S. Dollars) ... 63
9.12 Appendix 12 - Working Capital table ... 65
9.13 Appendix 13 – CAPEX table ... 65
9.14 Appendix 14 – FCFF and DCF valuation... 66
9.15 Appendix 15 – Rating and Spread table based on interest coverage ratio ... 67
4
9.17 Appendix 17 – Multiples analysis ... 69
9.18 Appendix 18 – Wells Fargo recommendation ... 69
9.19 Appendix 19 – Wells Fargo Quarterly Earnings Model ... 70
5
List of Tables and Graphs
Table 1 - EL portfolio of products ... 26
Table 2 – Annual growth of EL from 2013-2017 ... 32
Table 3 - EL net sales by trimester and geographic region ... 33
Table 4 - EL historical and forecasted net sales from 2013-2027 ... 34
Table 5 - EL historical and forecasted cost of sales from 2013-2027 ... 35
Table 6 - EL historical and forecasted Restructuring Charge from 2013-2027 ... 36
Table 7 - EL historical and forecasted Selling, general and administrative expenses from 2013-2027 37 Table 8 - EL historical and forecasted Depreciation and Amortization from 2013-2027 ... 38
Table 9 - EL historical and forecasted Interest from 2013-2027 ... 39
Table 10 - EL historical and forecasted Taxes from 2013-2027 ... 39
Table 11 - EL historical and forecasted Minority Interest from 2013-2027... 40
Table 12 - EL historical and forecasted Basic and Diluted Weighted Average Shares and EPS from 2013-2027 ... 41
Table 13 - EL historical and forecasted Cash Dividend from 2013-2027 ... 42
Table 14 - EL Free Cash Flow to the Firm ... 43
Table 15 - EL WACC calculation ... 44
Table 16 - Equity Value calculation ... 46
Table 17 - Sensitivity Analysis ... 47
Table 18 - EL original peer group ... 49
Table 19 - EL peer group ... 49
Table 20 - Exchange rates ... 50
Table 21 - Multiples Valuations ... 50
Table 22 - Results of EV/EBITDA, P/E and DCF valuations ... 51
Table 23 - Share Price Comparison ... 52
Table 24 - Multiples results ... 52
Table 25 - Comparison between Calisto and Wells Fargo valuation ... 53
Graph 1 - YoY global market size ... 21
Graph 2 - Make-up and skin care evolution from 2002-2015 ... 22
Graph 3 - EL business distribution across geographic regions ... 26
Graph 4 - Increase in cash dividends from 2013-2018 Graph 5 - Cash dividends value from 2013-2018 ... 27
Graph 6 - EL Share price May 2013-2018 ... 28
6
Abstract
This dissertation presents a valuation of The Estée Lauder Companies Inc., this company is listed on the New York Stock Exchange under the symbol EL. At the time of this valuation EL was trading at $133.79 a share, with market capitalization of $49.106,28 million (08/05/2018). Two methods were applied, DCF and Multiples. Some Sensitivity scenarios were made as a complement of the DCF. The multiples used were EV/EBITDA and P/E. The value obtained in the DCF valuation was the one chosen as final Equity Value, corresponding to $58.154.5 million, and a share of $158.44. Multiples method was used only as a market comparison. As a result of this valuation we give Estée Lauder a Buy recommendation. After all analysis complete, a comparison was made between Calisto and Wells Fargo valuations, where major differences were highlighted.
Sumário Executivo
Esta dissertação apresenta a avaliação da The Estée Lauder Companies Inc., esta empresa está cotada na Bolsa de Nova Iorque com o símbolo EL. No momento desta avaliação as ações da EL estavam em bolsa a $133.79, e com uma cotação de mercado de $49.106.28 milhões (08/05/2018). Dois métodos foram realizados, DCF e Múltiplos. Foi realizada uma análise de sensibilidade a alguns dos componentes de modo a complementar o DCF. Os múltiplos utilizados foram o EV/EBITDA e o P/E. O valor final do Capital Próprio foi de $58.154.5 milhões, correspondente a $158.44 por ação, obtido através do modelo DCF. O método dos múltiplos foi calculado apenas para servir de termo de comparação. A recomendação dada com base nesta avaliação é a de Comprar. Após a finalização de todas as análises comparámos as avaliações feitas por Calisto e Wells Fargo, destacando as diferenças entre as duas.
7
Acknowledgements
First I want to thank my mother for always supporting my decisions, believing in me and making this Master’s at Católica Lisbon School possible. I also want to thank her, my sister, my aunt Sara and my cousins for the support they have been given me in these last two years. I am also grateful for my boyfriend’s help and valuable input in this project. I want to thank him and my friends for accompanying me in this journey and making time for listening to me over and over again about my thesis dilemmas.
For this dissertation be possible I had valuable help from my former professor and advisor, José Carlos Tudela Martins.
I want to thank the Professor for his time and attention, and I want to thank as well Wells Fargo Securities Managing Director of Equity Research Bonnie Herzog, for lending me equity research reports of The Estée Lauder Companies.
8
1.
Introduction
The Estée Lauder Companies is a multinational company based in New York. The company operates in the Prestige Beauty Industry, and is one of the industry leaders with $11.82 billion net sales in fiscal 2017. EL is listed on the New York Stock Exchange.
The purpose of this dissertation is to give a buy, hold, or sell recommendation on The Estée Lauder Companies based on Equity Valuations pursued; as well as comparing our valuation results with the ones of an established investment bank.
This Equity Valuation Thesis will first present a Literature Review, with descriptions of several valuation methods and author’s perspectives, including, at the end, a selection of the methods that will be used in the valuation. The next chapter will introduce a Global Overview featuring important matters that may affect the company such as U.S. TCJA 2017 and Currency; also under this chapter it will be introduced the Prestige Beauty industry.
Following the introduction of the industry where EL operates, the company itself will be presented. The Estée Lauder Companies Inc. overview includes details on the company’s brands and products, geographic areas of business, some important numbers, and a short description of company initiatives.
After the presentation of the models, industry, and the company itself, it will be presented the company valuation. In Company Valuation we will guide you through the models used and explain the forecasts made. With the valuation finished an Investment Note will be presented with an investment recommendation.
The next and final chapter will feature a comparison between our valuation and the one made by the investment bank, Wells Fargo.
9
2.
Literature Review
When analysts and shareholders want to decide to make or not an investment they need to have information on the company to make a decision. For investors be convinced of their sentiment on buying or not a company’s stock, a valuation of the company is required. When it comes to making a valuation there are a lot of models that we can use, so many, that the challenge is choosing which to implement. “One reason why such a variety of approaches to valuation has been developed is that different approaches make different aspects of the valuation problem clear at the expense of obscuring other aspects” (Young, et al., 1999).
A short resume about absolute and relative valuation models will be presented. After an insight on the models, its constituents and some commons mistakes to be aware, it will be presented the ones used in the valuation of The Estée Lauder Companies and an explanation why.
2.1 DCF
Valuation is not as objective as it can seem, it is actually really subjective. To make a valuation one has to make several assumptions. Different assumptions can lead to far different outcomes. When making assumptions is important to be as accurate as possible because as Goedhart et al. (2005) said “Any analysis, however, is only as accurate as the forecasts it relies on”.
It is known that “the value of a business equals its expected future cash flows discounted to present value at the weighted-average cost of capital” (Luehrman, 1997), so in order to fully understand the DCF model let us introduce its components.
= ∑ + ��
10
2.1.1 Cash Flow
The cash flow used in the model is either Free Cash Flow to the Firm or Free Cash Flow to Equity, depending on what our valuation proposes are. It is very common to get the FCFE from the FCFF equation, since the model is easy to adjust. When using FCFF our goal is to evaluate the enterprise, its equity and debt (Young, et al., 1999). While using FCFE in the DCF model our valuation is aiming specifically to valuate only the equity as the name indicates.
= � × − + & − ∆ � � − − ℎ ℎ
2.1.1.1 FCFF and FCFE
When computing FCFF we have to give particular attention to some aspects of the financial items that we are using, such as adopting the effective tax rate to correctly calculate tax on EBIT and dealing with deferred taxes (Fernandéz, 2004). In the traditional formula of FCFF the Other Changes are implied, and sometimes can be forgotten. All items have to be carefully used so it can be the most accurate.
When computing the DCF model we can use as cash flow the FCFE, and for that we can start from the FCFF equation. Being calculated as follows:
= − � × − + ∆
2.1.1.2 Discount Factor
The next step in the DCF model is discounting the factors, the expected future cash flows, for which we need to have a discount factor. Depending if we are using FCFF or FCFE we will have to use different discount factors. When using FCFF as the expected future cash flows the discount factor used will be the weighted average cost of capital, and in case of choosing FCFE to run the model the discount factor used will be the required return to equity (Fernandéz, 2011). � = ∑ + ∞ − � = ∑ + ∞ −
11 2.1.1.2.1 WACC
As we can see below in WACC’s formula one of its building blocks is the required rate of return (re), which makes absolute sense once the FCFE is computed from the FCFF formula. In order to get the WACC it is needed to first compute the required rate of return as well as the cost of debt. The values of Equity and Debt used must be market values and not book values, as stated by Fernandéz (2011) is one of the most common errors in valuation.
WACC can simply be described as a “tax adjusted discount rate, intended to pick up the value of interest of tax shields that come from using an operation’s debt capacity” (Luehrman, 1997).
= × + × × −
2.1.1.2.2 Required rate of return
The required rate of return value can be computed using the Capital Asset Pricing Model (CAPM). CAPM approach states that the required return of an asset is estimate by adding the risk free rate plus beta times market risk premium. The market risk premium is adjusted by beta to reflect the market risk of the asset (Zenner, et al., 2008).
= + � × [ − ]
2.1.1.2.3 Market risk premium
Market risk premium“reflects the incremental premium required by investors” (Zenner, et al., 2008). It comes from the difference between the expected market risk and the risk free rate. There are several models to compute the market risk premium, each with strengths and weaknesses. It is recommended to use a range of values instead of a single one. That range can then be tested in a sensitivity analysis.
12 2.1.1.2.4 Beta
Beta is going to calibrate the equation. If it is higher than one it means that the asset has more risk than the market risk, if lower than one the oposite stands (Zenner, et al., 2008). To find beta calculations have to be made. For the next assumption to hold, the company can not have a lot of leverage.
� = [ + − × ] × ��
Assuming that:
�� = � × �−� + � ×� and � =
2.1.1.2.5 Risk free rate
The risk free rate “is the rate on a zero-coupon government bond that matches the time horizon of the cash flow being analyzed” (Damodaran, 2001), to know which rate to choose we have to take in consideration our type of investment, its maturity, if it is a short-term or long-term investment; and use in our models the one that is more adequate. When choosing a risk-free rate investors have to be aware that sometimes there is sovereign risk; it is usual to assume that governments do not default, but some do, if our company is from a certain group of developed countries, it might have failed to meet some promised obligations; and some markets just issue short-term rates.
“The riskless rate has to be defined in the same terms as the cash flow on the analysis” (Damodaran, 2001), if a company does its analyses using dollars, it must use a U.S. government security rate; the firm and the project itself do not have to be American, it can be from another country.
2.1.1.2.6 Cost of debt
The cost of debt used in WACC is computed as presented bellow. When determining this cost it has to be taken into account variables such as the current level of interest rates, the default risk of the company, and the tax advantadge associated with debt. When companies hold long
13
term bonds outstanding that are widely traded, it is easier to compute the yield we will use as cost of debt. Companies that hold bonds that do not trade on regular basis can estimate cost of debt by using their ratings and associated default spreads (Damodaran, 2001). Firms that hold private debt can use a discount rate that is similar to the ones used by its peers companies. When valuating private debt, it can be extremely helpful to give it a rating. If the company does not have tax exemption, the must be compute on after tax basis.
= ( + ) × −
2.1.2 Perpetuity
The DCF model is composed by two stages, its “first stage is a period of explicit forecasts while the second one assumes the cash flow to perpetually grow at a constant growth rate” (Cassia, et al., 2006). In order for the calculation to be the most accurate, it has to include the expected value that will be created in perpetuity. Perpetuity or terminal value is what we expect the company to create in an “infinity” time frame. The formula of the terminal value is the rest of the division between FCFF and the difference between the WACC and the growth rate.
� = −+
2.1.2.1 Growth rate
Growth rate is key to compute the value of a firm, especially when forecasting the ‘forever’ growth of a company. The Terminal Value is going to be where the majority of our firm valuation is going to be represented, once it is forecasted the perpetuity value of the company. According to Damodaran (2001) “no firm can grow forever at a rate higher than the growth rate of the economy in which it operates”, as a result, before reaching a value for the perpetual growth rate, investors should forecast company’s results until it stabilizes; where the firm shows a stable-growth rate. Our time frame will then be the explicit period until the company develops into a stable-growth state.
14
2.2 Multiples
In a relative valuation, all that we are concluding is if a stock is under or overvalued, relative to the comparable group. Multiples valuation supports the decision to buy, hold or sell recommendation.
Multiples are useful as a second opinion on a valuation. After analysts make a valuation using a certain model they should use multiples as a comparison with other firms multiples to be able to identify differences between the two (Fernandéz, 2001).
The concept of this model is that a company is evaluated by comparing the value of its assets with ones valued on the market, or in other words: “Relative valuation methods are those in which market multiples of “comparable” companies are used to value the target company” (Lee, 2003).
Multiples are simple to use and compute (Lee, 2003) and usually do not require as much data as an absolute valuation, however it has to be done properly to be viable or otherwise will not be objective.
There are plenty of different multiples, each one more adequate to a certain industry. The most used market multiples for valuing firms are: P/E multiple, it is widely used due to be very easy to compute and to understand; and enterprise value (EV), in particular EV/EBITDA but it has some limitations as it does not include the changes in Working Capital requirements and does not consider capital investments (Fernandéz, 2001).
/ = � ℎ ℎ
/ � = � � , ,� � � � �
When using multiples we can also decide between trailing or forward multiples, according to our preferences and evaluation of the market. Trailing multiple is based on historical data while forward multiple looks into the future and is computed on forecasted data (Fabozzi, et al., 2017).
15 2.2.1 Peer Group
One of the problems that can arise while using multiples is a bad choice of comparable companies. To the group of comparable companies we give the name Peer Group. Lee (2003) observed that “the key to a good multiple based approach is a judicious selection of peers”, but it is almost impossible to find a company that is exactly the same as the one you want to value.
According to Damodaran (2001) a comparable company can be from a totally different industry as long as it has the same fundamentals as: risk, growth and cash flow. A company outside the industry of our valuation company is as comparable with ours as a company in the same industry, as long as they share similar fundamental characteristics. In the perspective of (Foushee, et al., 2012) the relevant comparable companies have to be from the same markets and be subjected to the same set of macroeconomic factors.
2.3 Dividend Discount Model
The Dividend discount model measure present values of future dividends. The DCF model and the DDM are similar, they both focus on cash flows but that are at different stages of the wealth distribution process (Lee, 2003). In DCF we value the company based on its cash flows and in DDM on its dividends.
=
+ �
The DDM can easily misreflect companies’ value once the majority of companies are not stable with their dividends policy (Campbell & Shiller, 1988). Analysts essentially have to make two different forecasts, first estimate the dividends and then anticipate managers’ decision about its distribution, but other forecasting problems can arise such as the company deciding to do corporate share buyback (Fabozzi, et al., 2017). For these reasons the model can only be reliable if it is applied to companies where a firm pays stable dividends and there is no projected corporate share buybacks.
16
2.4 Adjusted Present Value
The Adjusted Present Value model values ongoing business, it can be used to value a product, market or even line of business. Valuing operations is difficult, and this model is going to help make such a valuation. The question that this model tries to answer is “How much are the expected future cash flows worth, once the company has made all the major discretionary investments?” (Luehrman, 1997).
APV believes that each part of the company or project can be valued piece by piece and in the end all sum up. The model relies on the principle of ‘value additivity’. The APV model is really useful when making valuations with the purpose of selling or to make an acquisition; once managers get to know the value of each piece of the business, the value of synergies, tax savings, and all other specific details that with just a DCF valuation would not be possible to know (Luehrman, 1997).
To get the adjusted present value the FCFF have to be discounted at the cost of capital or cost of debt, and then has to be added to it the tax shields and other possible adjustments. Adjustments as flotation costs or costs of financial distress are usually already included. APV is a more flexible model once it is open to adjustments that are not previously included in the discount factor (Capi´nski & Patena, 2008).
= � + ℎ� −
2.4.1 Tax Shield
The tax shield value is not direct, it has to be found the tax shield for every year and then discount it, to get its present value (Capi´nski & Patena, 2008). The method used to calculate the tax shield and to discount is not straight forward; different academics follow different models. For Fernandéz (2004), if the company expects to increase its debt the required rate of unleveraged return should be used to calculate the tax shield and as well to discount it; if not use the cost of debt for both operations.
� = ∑ ��×��×�
+�� � ∞
− � = ∑∞− ��×�+�� ��×�
17 2.4.2 Bankruptcy Costs
In the APV approach, after the estimation of the value of the unlevered firm and the expected tax benefit from borrowing, “the third step is to evaluate the effect of the given level of debt on the default risk of the firm and on expected bankruptcy costs” (Damodaran, 2001); in this evaluation it has to be considered direct and indirect costs of bankruptcy.
= � � ×
2.5 Option Pricing Theory
“How do corporations typically evaluate opportunities? A common approach is not to value them formally until they mature to the point where an investment decision can no longer be deferred” (Luehrman, 1997).
The basics of option pricing are that a buyer of a call option gets the right to buy the underlying asset at a fixed price; the buyer of a put option has the right to sell the underlying asset at a fixed price (Damodaran, 2001). Fisher Black and Myron Scholes developed a model for financial options that requires a small number of inputs. Today the Black-Scholes model can be used to value investment opportunities in real markets as it allows for a flexible response to the outcomes. Managers can now apply the model to their business situations, especially in investment intensive industries such as oil extraction. With real options managers can decide “whether to invest now, to take preliminary steps reserving the right to invest in the future, or to do nothing” (Leslie & Michaels, 1997).
2.6 Sensitivity Analysis
Sensitivity analysis is very important in valuations, as stated before valuations are not objective, and the more forecasts a valuation has the more subjective it can be. The valuations based in “free-cash-flow methodologies are only truly meaningful when they are complemented by sensitivity analysis and scenario analysis” (Fabozzi, et al., 2017). Free-cash flow methodologies incorporate a large number of projections and, as a result it has more building blocks that can be potentially wrong than other models.
18
To give the best valuation, an analyst must do a lot of research and know all the valuation models, and even that way he can make mistakes by simply making a forecast that later might not become a reality. It is important to stress test our forecasts to be aware of potential different outlooks, and to identify potential problems or mistakes with certain estimates and critical parameters (Cassia, et al., 2006).
2.7 The Estée Lauder Companies case
Valuation models were presented in the Literature Review, after its analysis some methods were chosen to value The Estée Lauder Companies.
Regarding the Discount Cash Flow Model, the Discounted Free Cash Flow to the Firm appears to be the most suitable method. Some forecasts made in the DCF will be challenged with a Sensitivity Analysis, so we can measure its impacts on the Equity Value.
A relative valuation with the EV/EBITDA and P/E multiples will be made since both match the company’s characteristics, and are the most popular amongst analysts.
The Dividend Discount Model will not be applied. EL distributes a quite stable dividend since 2013, but also repurchases stock in a regular basis. It is possible to adjust the DDM for share buybacks, but the model would not be as accurate.
The APV model will not be computed since the company has a quite constant debt to equity ratio. Neither will be the Option Pricing Theory since it is not an investment intense industry.
19
3.
Global Overview
In order to understand the challenges that The Estée Lauder Companies Inc. faces we have to know what is going on with the world, and specially, know the industry trends. Since the company is from the United States, everything that happens with the country currency and laws will have a major influence in the company’s outcomes.
Other countries, political situations and currencies may as well have a significant impact on the company, that impact will differ according to its exposure to the other markets, and if it is or not operating business in them.
3.1 U.S. TCJA 2017
December 22nd 2017 President Trump signed into law the “Tax Cuts and Jobs Act”, these changes will affect individuals and companies in the United States. TCJA is effective since December 31st 2017, the major impacts it has on companies is on its business provisions (Brady, 2017). Changes on corporate tax rate, corporate AMT (Alternative Minimum Tax), excess loss limitation, full and immediate capital asset expensing, net business interest expense, and other notable provisions were made.
The most straight forward change was corporate tax rate; the rate is now flat at 21%. Corporate alternative minimum tax rate was eliminated, before it graduated from 10% to 35%. This rate reduction is expected to produce considerable tax savings for corporations.
3.2 Currency
Currently EURO/US dollar spot rate is 1.19 (May 8). In mid 2014 the US dollar started to strengthen in comparison with the euro, reaching almost parity on March 2015 and again on the end of December 2016 and beginning of 2017. Since 2017 the dollar has been weakening, it has been trading at its lowest level in more than three years, not just comparing to euro but also with other currencies.
At first glance there is no reason for this weakened rate since the Federal Reserve has been raising interest rates for the past year. Rate hikes are usually very attractive for foreign investors; higher interest rates lead investors to buy American assets.
20
The U.S. economy is experiencing a solid growth, and expects to maintain it due to the recent tax cuts. Some reasons that can explain why the dollar has not been boosting are the shift of investors to invest in euro, once countries like Germany and France are having strong performances and showing strong economies. Also strong expectations of changes in the bond-buying program and raise of interest rates by the European Central Bank are making euro so much more attractive.
From another perspective, it can be said that the euro is looking more attractive comparing with the dollar. Political uncertainties in the country are not helping the dollar as well, but so far the weakness of the dollar has not reflected in the U.S. economy or its stock market. As La Monica (2018) stated “A weaker dollar lifts the value of foreign sales and profits for U.S.
multinational companies like Apple (AAPL), Microsoft (MSFT), Johnson &
Johnson (JNJ), Exxon Mobil (XOM) and Procter & Gamble (PG) once they are translated back into dollars.”
3.3 Industry Overview
The Estée Lauder Companies belongs to the Prestige Beauty industry. The Prestige Beauty industry is composed by premium products like body care, including skincare and hair; makeup and fragrances. This is an industry that has been growing worldwide and outpacing most other household and personal care sectors since 2013. According to (Deloitte, 2017) estimations, between 2013 and 2015 the market has grown approximately 4.8%, with the total market valued at about $78 billion a year.
With the new era of digital technologies, social media is gaining more and more power and the e-commerce is becoming key to the business. Companies have to adapt to this online era and be able to rapid change; the market has been seeing a fast emergence of new brands, expansion to new geographic markets and new subcategories.
Today is not as important for consumers the brand itself but the way brands engage with them, awareness and sampling of new products. Thanks to digital commerce and social media, entry barriers have come down, which has helped the beauty and luxury field to expand. Consumers today give more importance to image; they want to look camera ready every day. In order to know what to buy they are relying on advices from their peers, obtained through digital influencers that test products for them.
21
Graph 1 - YoY global market size
Partnerships of brands with influencers are becoming more and more important to raise awareness of their products amongst consumers. Recently, to make sales, is important to have in-store beauty consultants that help the consumer and let them test the products in order to find the product that better suits them.
The Prestige Beauty industry is being confronted with the growth of niche and indie disruptors; companies to fight the loss of market share to new brands are making more mergers and acquisitions. Companies in the industry are focusing in a more inorganic strategy to grow. With current short life of product lunches, this is the way companies found to maintain a viable brand portfolio.
3.3.1 Products
Beauty is driving growth in makeup, not only Millennials and Generation Z, but across demographic groups around the world (EL annual report, 2017). For many years skincare growth was bigger than make up, but with the boost from digital activation makeup took the lead in recent years. This trend is expected to shift in the next decades, with these generations more passionate with beauty and perfection, skincare products are expected to increase sales while Millennails age. Millennials are focusing more in themselves and want to be unique, when they are buying fragrances they are looking more for individuality.
22
Graph 2 - Make-up and skin care evolution from 2002-2015
3.3.2 Channels
Online is the channel of today and the future of the industry, with majority of clients checking products through digital channels before buying it becomes priority for brands to look appealing on those channels and to provide tools that engage the consumer to come back for future purchases.
Contribution from online sales is still very low but its growth is the only one that has been significant since 2005, either between ranges of products and geographic regions (see appendices 1 and 2).
3.3.3 Demographics
The demographic of consumers is shifting, younger generations are projected to represent a big part of the market, with Millennials expected to represent 30% of total global retail sales by 2020.
Digital engagement is growing importance with this expected new trend; Millennials, a generation defined by individuals born between 1980 and 2000 and Generation Z or iGeneration, born post Millenials, use social media in an everyday basis; before committing to purchase they seek information about the products with online influencers, older demographics are adopting these purchase methods as well.
23 3.3.4 Geography
Prestige Beauty products are sold all over the world. The beauty market has been growing worldwide, especially in emerging markets. Regions like the Middle East, Africa, East Asia, Latin America and Eastern Europe are experiencing fast growth and the beauty industry is no exception.
Between 2010 and 2015 Prestige Beauty industry grew around 10.5% in the regions of Middle East and Africa, 10% in East Asia, 9.8% in Latin America, and 5.1% in Eastern Europe, against estimated 3% growth in developed regions like North America, developed Asia and Western Europe. In these new fast growing regions new sources of innovation arise, with South Korea leading the innovative regions in producing skin care products.
After a period of low growth for developed regions, the markets are improving; developed region consumers continue to have more purchase power (Deloitte, 2017).
3.3.4.1 United States
According to The NPD Group, an American market research company, the U.S. Prestige Beauty industry reached $17.7 billion in 2017, a 6 percent increase over 2016. Skincare was the category that had the biggest growth in sales, accomplishing a 9 percent figure, and contributing 45 percent of the industry’s total gains; makeup was the second category with a 6 percent increase in sales, and fragrance followed with 4 percent growth.
Skincare category saw revitalization this last year, and reached a 9 percent grew on sales, but was not sufficient to outperform total sales of makeup. Its growth was essentially from smaller segments including masks, facial exfoliators, cleansers, and also some larger segments such as facial moisturizers; the body, sun and hair care segments all experienced growth. All these products made skincare category reach $5.6 billion in sales in 2017.
Makeup in 2017 maintained the lead, bringing the most dollar volume of the industry; it reached $8.1 billion in sales last year. Growth was driven by high volume segments including foundation and eye shadow, as well as other face products and key segments such as face primers, concealer, eyebrow makeup and lip color.
With a 4 percent growth and a total of $4 billion in sales was the fragrance category. 2017 was a good year for niche areas of the market, with natural fragrances growing its sales by 32
24
percent, and artisanal fragrances by 14 percent. Home scents market is booming since 2014, this last year the market made $80.4 million in sales, a growth of 59 percent comparing to 2016, where the growth was already a solid 18 percent.
For the Prestige beauty industry the fourth quarter is key, it includes different holiday’s seasons that boost sales. In 2017 this quarter was good in the US; the beauty was the growth leader during several weeks including Thanksgiving and Black Friday. Overall the fragrance category was the one that had the best performance through Christmas week, followed by makeup and skincare face products (Guyduy, 2017).
25
4.
The Estée Lauder Companies Inc. Overview
The Estée Lauder Companies is listed on the New York Stock Exchange under the symbol EL. It is a multinational company based in New York, New York. It was founded in 1946 by Estée Lauder and her husband, Joseph Lauder; in that same year the company launched 4 products. Today it is one of the world leading companies in manufacturing and selling prestige skin care, makeup, fragrance and hair care products.
The company is present in more than 150 countries and sells its products through more than 25 prestige brands, some owned and others licensed such as: Estée Lauder, Aramis, Clinique, Prescriptives, Lab Series, Origins, Tommy Hilfiger, MAC, Kiton, La Mer, Bobbi Brown, Donna Karan New York, DKNY, Aveda, Jo Malone London, Bumble and bumble, Michael Kors, Darphin, Tom Ford, Smashbox, Ermengildo Zegna, AERIN, Tory Burch, RODIN olio lusso, Le Labo, Editions de Parfums Frédéric Malle, GLAMGLOW, By Kilian, BECCA and Too Faced.
26
Beauty is an industry that has been steadily growing in the last years; Global prestige beauty has grown around 4 to 5 percent a year, outpacing some household and personal care sectors (appendix 3). The Estée Lauder Companies believe that the key factor to success is staying ahead; in this online world of today everyone wants to be camera ready, the new generations give more importance to appearance such as Millennials and Generation Z, what is driving growth of the makeup sector. The company has a diverse portfolio of products under several brand names.
The Estée Lauder Companies operates all over the world; it divides its business in three main geographic regions: Asia/Pacific, with 21% of total net sales; Europe, the Middle East and Africa (including Travel Retail) contributing with 39%; and the Americas with the remaining 40%. The sales of more than a quarter of the company’s markets grew by double digits this last fiscal year. It benefited from growth in each region and in some key emerging markets.
Graph 3 - EL business distribution across geographic regions
21% 39%
40%
EL business distribution across geographic regions
Asia/PacificEurope, the Middle East and Africa (including Travel Retail)
Americas
Skin Care Makeup Fragrance Hair Care
Moisturizes Lipsticks Eau de perfume sprays and colognes Shampoos Serums Lip glosses Lotions Conditioners Cleansers Mascaras Powders Styling products
Toners Foundations Creams Treatment
Body care Eyeshadows Candles Finishing sprays Exfoliators Nail polishes Soaps based on a particular fragrance Hair color products Acne and oil correctors Powders
Facial masks Compacts Cleansing devices Brushes Sun care products Other makeup tools
27
The end of fiscal year 2017 The Estée Lauder Companies reached net sales of $11.82 billion ($11.26 billion 2016), operating income of $1.69 billion ($1.61 billion 2016) and diluted earnings per share of $3.35 ($3.20 2016). An evolution of net sales of the period 2013-2017 can be observed in appendix 4.
The company has been increasing its dividend; in 2016 the dividend rate was increased by 25 percent and in 2017 increased yet again by 13 percent. Last fiscal year the company returned $899 million to stock holders’ through dividends and stock repurchases.
Graph 4 - Increase in cash dividends from 2013-2018 Graph 5 - Cash dividends value from 2013-2018
The company has been investing in their digital capabilities due to the world of today and the increasing importance of online presence; making partnerships with brands’ influencers and integrating digital marketing, social media and e-commerce in their brands’ strategies.
Fiscal 2017 was a year with a lot of economic challenges and political uncertainty, but the company kept its focus on long term value creation and achieved good results.
In this second quarter of fiscal 2018 the company had net earnings of $123 million ($428 million 2017), including already provisional one-time charges of $394 million due to the U.S. Tax Cut and Jobs Act that was signed last December, this may still require adjustments due to changes in regulatory interpretation of the Tax Act.
This quarter the diluted earnings decreased to $.33 ($1.15 2017) a share in relation to TCJA provisions. The acquisition of two new makeup brands in fiscal 2017, Too Faced and BECCA, contributed for the incremental sales around 2 percentage points this quarter.
$0.10 $0.20 $0.30 $0.40 2013 2014 2015 2016 2017 2018
Cash dividends value
2013-2018
0.00% 10.00% 20.00% 30.00% 2014 2015 2016 2017 2018Increase in cash dividends
2013-2018
28
The six months results (ended December 31, 2017) confirmed the strong growth the company had in the last fiscal year, reporting net sales of $7.02 billion ($6.07 billion 2016), a 16% increase compared to the same prior-year period.
Net earnings this period were lower than the prior-year six months due to the already mentioned provisional one time charges, restructuring and other charges; net earnings were $550 million, a decrease comparing with $722 million comparable prior-year six months. Diluted earnings per share basis were $1.46 ($1.94 2016), but adjusting for the restructuring and other charges and the impact of TCJA provisional charges, diluted net earnings per common share for this six months period were $2.73.
The company is currently valued at $133.79 a share (8/5/2018). From the periods of 2013 till 2014 the share price of the company was between $64 and $77 a share, during 2015 share price increase reaching $90 a share, during the summer months it was observed a decrease in the company’s value, which quickly changed from the beginning of September till mid 2016. From mid 2016 till the end of the year share price value decreased sharply and reached $75 a share, the lowest in more than one and a half year. 2017 showed to be the greatest year for the company so far, share price sharply rose through all the year, going from $77.33 to $127.24, corresponding to an increase of around 65%.
In 2018 The Estée Lauder Companies continues the previous year’s growth trend; the company hit a new 52-week hit of $153.88 on 8th of April.
Graph 6 - EL Share price May 2013-2018
At year-end 30 June 2017 the company had 368,103.5 thousand common stock outstanding, 224,341.2 thousand Class A, and 143,762.3 thousand Class B. The diluted net earnings were
40.00 60.00 80.00 100.00 120.00 140.00 160.00 $ /Sh are
29
$3.35 per common share. The company has a share repurchase program, as of June 2017 the Board of Directors had authorized the repurchase of 14.5 million shares of Class A Common Stock. EL returns value to its shareholders through share repurchase programs and by distributing quarterly dividends; on August 17 2017 a dividend was declared in the amount of $0.34 per share on the Company’s Class A and Class B Common Stock; for the first quarter (September 2017) a dividend of $0.34 a share was paid as announced, for the followed two quarters a dividend of $0.38 was distributed (appendix 5).
The Estée Lauder Companies Executive Chairman is William P. Lauder, grandson of Estée and Joseph Lauder; and Fabrizio Freda as President and Chief Executive Officer. EL is controlled by the Lauder family, which owns around 40 percent of total common stock (Class A and Class B) and about 87 percent of voting power. Class A shares have one vote per share, and Class B has 10 votes per share.
EL has several big corporations that hold a considerable amount of shares, two of the biggest holders are Fidelity Management and Research Company, with 4.67% of the company; and Vanguard Group Inc, with 4.37%. To consult all the top holders of the company check appendix 6.
The company has been considered as one of the best places to work in several regions. Last year they have been awarded a spot on Indeed’s “50 Best Places to Work in the Fortune 500”; a mention in “Top Companies to Work in UAE” by the Great Place to Work Institute UAE; considered “China Top Employer 2017” by the Top Employers Institute; in Mexico honored by Expansion Magazine for the 10th consecutive time in “The Places Everyone Wants to Work”; and in the U.K. and Ireland received a mention on “30 Best Big Companies to Work For” by Sunday Times. These numerous recognitions show the commitment and appreciation that the company has for their employees.
The Estée Lauder Companies continues the tradition initiated by their founder of empower women at all levels of the company. They recently supported the Equal Pay Act and launched the Women’s Leadership Network that supports, encourages and engages women across the company to reach their full potential. At the start of the current fiscal 2018 year, about 84 percent of their global workforce is female, with nearly 50 percent of U.S.-based senior positions held by women, and women constitutes 40 percent of their Board of Directors. The company empowers its employees giving them opportunities, a good place to work, fighting for their rights; and also helps society, supporting and conducting numerous social
30
responsible initiatives. It raises funds and awareness to different important issues such as helping education reach girls across all five continents, under The Estée Lauder Companies Charitable Foundation; through The Breast Cancer Campaign the company wants “a world without breast cancer” (company 2017 report, William lauder), and for that helps with brand contributions and outside donations.
Other project that is dear by the company is MAC AIDS Fund, through each they have annual campaigns to raise funds for treatment and prevention, and gather volunteer from the company to give a hand in several HIV/AIDS organizations. The company is also committed in another important issue: the environment; they want to reduce their carbon footprint and are proud to be part of the fight against climate change.
32
5.
Company Valuation
5.1 Revenues
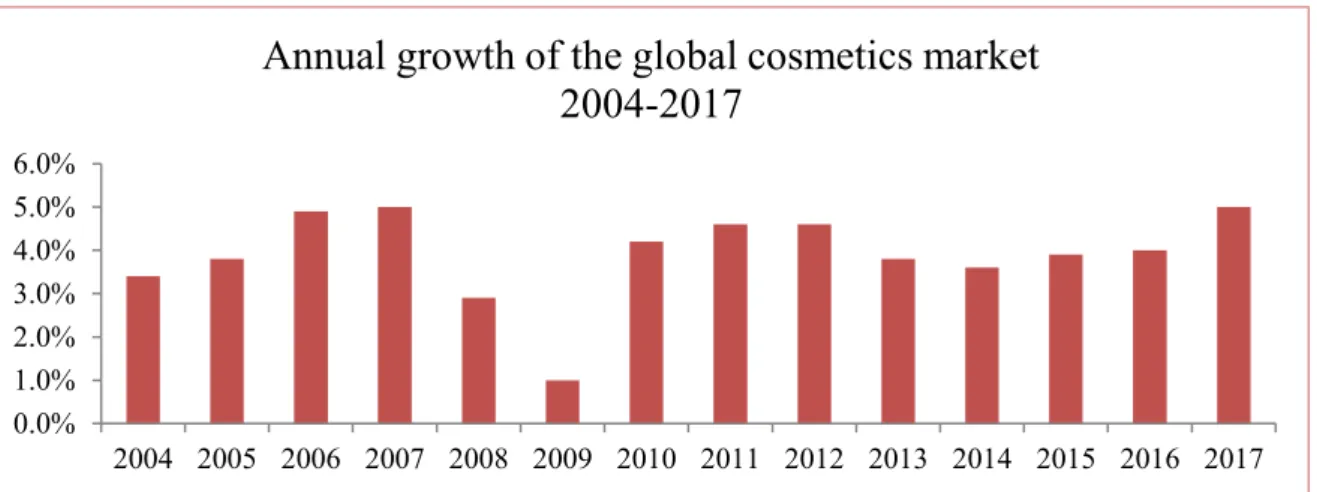
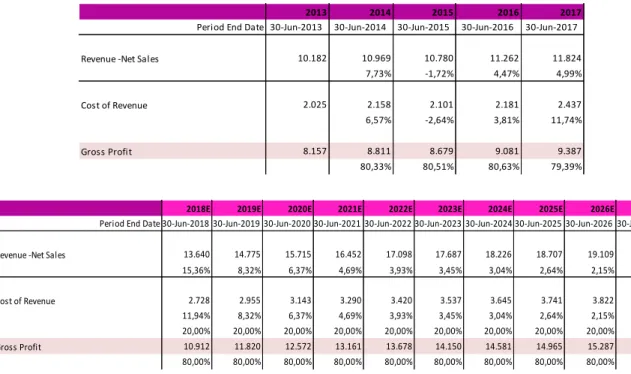
In Estée Lauder Companies yearly report of 2017 (30 June 2017), the company estimates a 5% growth of the market. This estimate seems accurate since studies (Statista, 2018) of the global prestige beauty industry show that global cosmetics market has been constantly growing in the last three years, from an annual growth of 3.6% in 2004 to 5% in 2017.
Growth average for the market in the last 13 years (2004-2017) is around 4%. In 2016 The Estée Lauder Companies grew 4.50% in comparison with the previous year, a bit over the 4% of the industry; and in 2017 the company’s growth accompanied the markets with a 5% growth in comparison with the previous year.
Graph 7 - Annual growth of the global cosmetics market from 2004-2017
With exception of 2015, the company’s growth since 2013 always outpaced or matched the industry. 2015 was a special year; the company faced some global uncertainties, including significant movement in key currencies. That same year the company expanded their portfolio through the acquisition of four brands.
Table 2 – Annual growth of EL from 2013-2017
0.0% 1.0% 2.0% 3.0% 4.0% 5.0% 6.0% 2004 2005 2006 2007 2008 2009 2010 2011 2012 2013 2014 2015 2016 2017
Annual growth of the global cosmetics market
2004-2017
2013 2014 2015 2016 2017
Period End Date 30-Jun-2013 30-Jun-2014 30-Jun-2015 30-Jun-2016 30-Jun-2017
Revenue -Net Sales 10.182 10.969 10.780 11.262 11.824 7,73% -1,72% 4,47% 4,99%
33
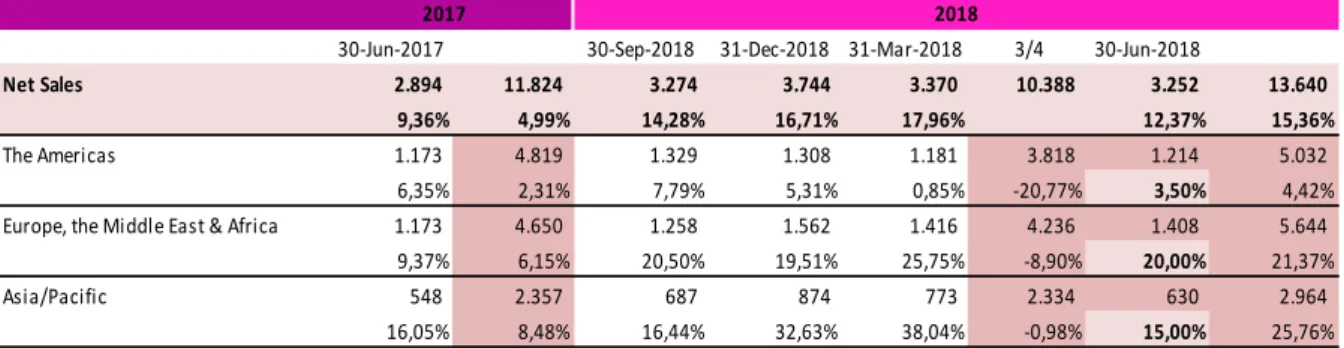
After these analyses we looked carefully at the company’s net sales, taking in consideration each trimester growth by geography. We compared trimester results by geography between 2016 and the 3rd trimester of 2018. Big differences stand out comparing fiscal 2018 trimesters’ growth to previous years (appendix 7).
Table 3 - EL net sales by trimester and geographic region
The growth in the American segment is similar to previous years, but for the segments of Europe, the Middle East & Africa and Asia/Pacific we saw at least a 16% increase in net sales comparing with the same previous periods.
Looking at table 3, in column 3/4 we added the three trimesters of fiscal 2018, and as it can be observed the results of 3/4 of the year for the Asia/Pacific segment are just slightly below net sales of the full previous year (-0.98%), Europe, Middle East & Africa have approximately less 10% of the full previous year. The Americas is the one that stands out with results more similar to previous year.
2018 has been an outstanding year for the company, so when forecasting its final fiscal trimester, the growth rates will be a bit different than the historical ones.
Taking in consideration the results of the past three trimesters, ending the fiscal year with similar growth and bearing in mind trimester usual growth rates, we choose a growth rate of 3.50% for The Americas, 20% for Europe, Middle East & Africa, and 15% for Asia/Pacific. It will reflect a 12.37% growth in comparison with same period last year, and a 15.34% growth of net sales in comparison with fiscal 2017.
For the next years we continued to forecast net sales by geographic region, with each region growth estimated we got the yearly growth of net sales for the company.
30-Jun-2017 30-Sep-2018 31-Dec-2018 31-Mar-2018 3/4 30-Jun-2018
Net Sales 2.894 11.824 3.274 3.744 3.370 10.388 3.252 13.640
9,36% 4,99% 14,28% 16,71% 17,96% 12,37% 15,36%
The Americas 1.173 4.819 1.329 1.308 1.181 3.818 1.214 5.032 6,35% 2,31% 7,79% 5,31% 0,85% -20,77% 3,50% 4,42% Europe, the Middle East & Africa 1.173 4.650 1.258 1.562 1.416 4.236 1.408 5.644
9,37% 6,15% 20,50% 19,51% 25,75% -8,90% 20,00% 21,37% Asia/Pacific 548 2.357 687 874 773 2.334 630 2.964
16,05% 8,48% 16,44% 32,63% 38,04% -0,98% 15,00% 25,76%
34
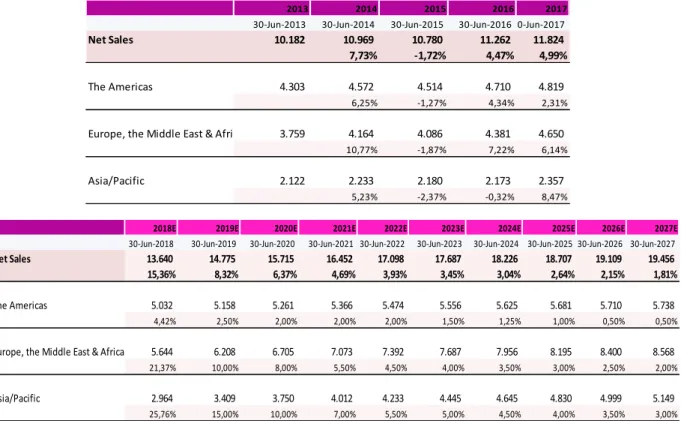
Table 4 - EL historical and forecasted net sales from 2013-2027
As it can be observed in the previous table, 2018 has an outstanding growth, and the following years we see net sales growth decrease, especially from fiscal 2018 to fiscal 2019. The Americas is a region where EL has been quite stable in the last years, having a moderate growth that with the years will decrease even more once the market is becoming fully explored (appendix 8).
The beauty market has been growing worldwide; and as we referred in the industry overview, emerging markets are experiencing fast growth. The Estée Lauder Companies is not an exception, looking at Europe, the Middle East & Africa, and Asia/Pacific regions on the table we can see that fast growth.
2013 2014 2015 2016 2017
30-Jun-2013 30-Jun-2014 30-Jun-2015 30-Jun-2016 30-Jun-2017
Net Sales 10.182 10.969 10.780 11.262 11.824
7,73% -1,72% 4,47% 4,99%
The Americas 4.303 4.572 4.514 4.710 4.819
6,25% -1,27% 4,34% 2,31%
Europe, the Middle East & Africa 3.759 4.164 4.086 4.381 4.650
10,77% -1,87% 7,22% 6,14%
Asia/Pacific 2.122 2.233 2.180 2.173 2.357
5,23% -2,37% -0,32% 8,47%
2018E 2019E 2020E 2021E 2022E 2023E 2024E 2025E 2026E 2027E
30-Jun-2018 30-Jun-2019 30-Jun-2020 30-Jun-2021 30-Jun-2022 30-Jun-2023 30-Jun-2024 30-Jun-2025 30-Jun-2026 30-Jun-2027 Net Sales 13.640 14.775 15.715 16.452 17.098 17.687 18.226 18.707 19.109 19.456
15,36% 8,32% 6,37% 4,69% 3,93% 3,45% 3,04% 2,64% 2,15% 1,81%
The Americas 5.032 5.158 5.261 5.366 5.474 5.556 5.625 5.681 5.710 5.738
4,42% 2,50% 2,00% 2,00% 2,00% 1,50% 1,25% 1,00% 0,50% 0,50%
Europe, the Middle East & Africa 5.644 6.208 6.705 7.073 7.392 7.687 7.956 8.195 8.400 8.568
21,37% 10,00% 8,00% 5,50% 4,50% 4,00% 3,50% 3,00% 2,50% 2,00%
Asia/Pacific 2.964 3.409 3.750 4.012 4.233 4.445 4.645 4.830 4.999 5.149
35
5.2 Cost of Sales
Gross Profit from 2013 to 2017 was around 80% of Net Sales, which is the same that stating that Cost of Sales was around 20% of Net Sales. Since it has been stable during the last 5 years, we choose to compute the following years Cost of Sales as 20% of Net Sales.
Table 5 - EL historical and forecasted cost of sales from 2013-2027
5.3 Operating Expenses
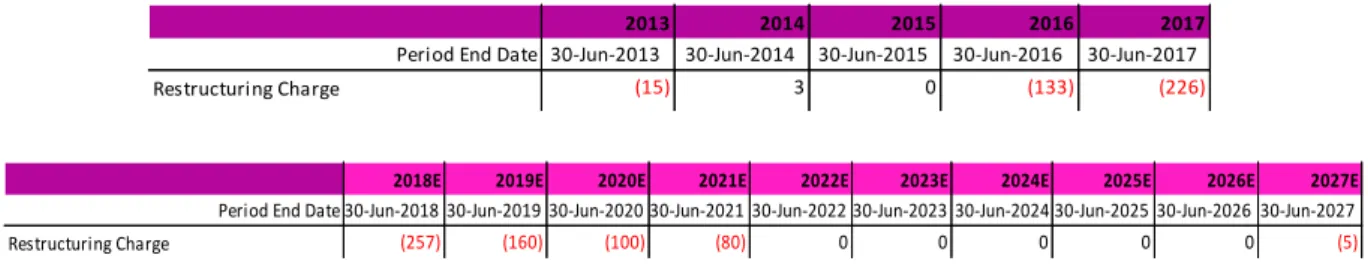
To forecast the Restructuring Charge we based our estimates in the company’s plans. In May 2016 the company announced an initiative called Leading Beauty Forward – LBF; this program is designed to “enhance the Company’s go-to-market capabilities, reinforce its leadership in global prestige beauty and continue creating sustainable value”.
Specific initiatives under LBF such as optimization of select corporate functions, supply chain activities, corporate and regional markets support structures, and exit of underperforming businesses, will start to be approved through fiscal 2019, and are expected to be completed by fiscal 2021.
The Estée Lauder Companies expects that LBF will result in about $600- $700 million of restructuring charges before taxes; in this item are also included charges from the inception through June 30, 2017. These expected charges are the result of employee-relates costs, asset write-offs and other costs needed to implement these initiatives.
2013 2014 2015 2016 2017
Period End Date 30-Jun-2013 30-Jun-2014 30-Jun-2015 30-Jun-2016 30-Jun-2017
Revenue -Net Sales 10.182 10.969 10.780 11.262 11.824
7,73% -1,72% 4,47% 4,99%
Cost of Revenue 2.025 2.158 2.101 2.181 2.437
6,57% -2,64% 3,81% 11,74%
Gross Profit 8.157 8.811 8.679 9.081 9.387
80,33% 80,51% 80,63% 79,39%
2018E 2019E 2020E 2021E 2022E 2023E 2024E 2025E 2026E 2027E Period End Date 30-Jun-2018 30-Jun-2019 30-Jun-2020 30-Jun-2021 30-Jun-2022 30-Jun-2023 30-Jun-2024 30-Jun-2025 30-Jun-2026 30-Jun-2027
Revenue -Net Sales 13.640 14.775 15.715 16.452 17.098 17.687 18.226 18.707 19.109 19.456 15,36% 8,32% 6,37% 4,69% 3,93% 3,45% 3,04% 2,64% 2,15% 1,81% Cost of Revenue 2.728 2.955 3.143 3.290 3.420 3.537 3.645 3.741 3.822 3.891 11,94% 8,32% 6,37% 4,69% 3,93% 3,45% 3,04% 2,64% 2,15% 1,81% 20,00% 20,00% 20,00% 20,00% 20,00% 20,00% 20,00% 20,00% 20,00% 20,00% Gross Profit 10.912 11.820 12.572 13.161 13.678 14.150 14.581 14.965 15.287 15.564 80,00% 80,00% 80,00% 80,00% 80,00% 80,00% 80,00% 80,00% 80,00% 80,00%
36
After the full implementation of the program, it is expected that LBF yield annual net benefits in Selling, general and administrative expenses between $200- $300 million before taxes. The company expects then to reinvest a portion of these savings in future growth initiatives. In fiscal 2017 alone the company already incurred in $226 million in charges, and in the first nine months of fiscal 2018 it reported a restructuring cost of $207 million. The company expected restructuring costs between $600-$700 million to be incurred between fiscal 2017 and fiscal 2021.
After analyzing these results we believe that the company in these first years of the project will incur in more costs than it will in the following years, none the less we estimate that the LBF program will result in a bit more than $700 million of restructuring costs.
Table 6 - EL historical and forecasted Restructuring Charge from 2013-2027
In the next few years after the conclusion of Leading Beauty Forward initiative we estimate that the company will not incur in restructuring costs, but in our final year of forecast (2027), we will account for a $5 million charge.
We believe that not all years the company will be incurring in restructuring costs, but eventually it will have new programs to adapt the company’s performance to the market’s evolution.
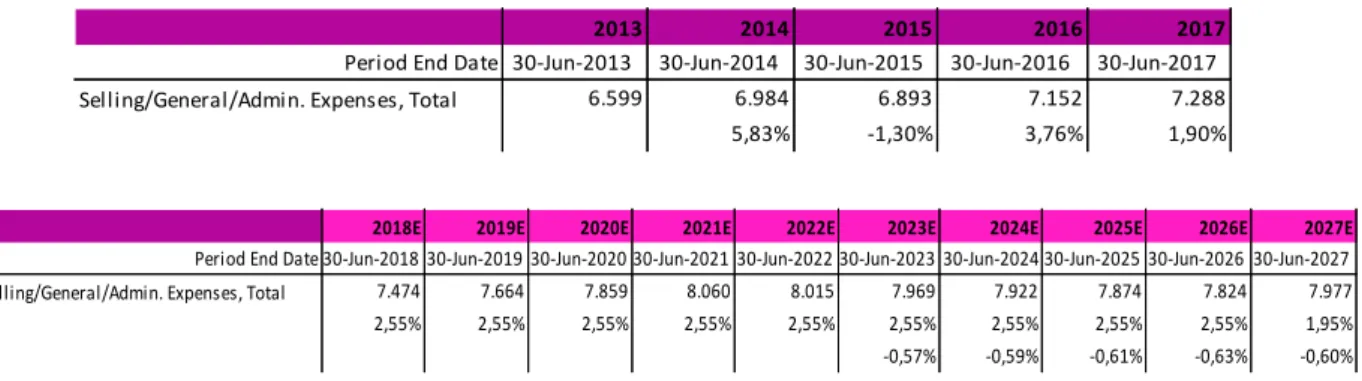
In order to forecast the following years of Selling, general and administrative expenses, a year on year growth rate was computed for each of the last 5 years. Then, an average of the last 5 years growth rates was computed (2.55%) and applied to all the subsequent years. This method was applied because the company did not provide sufficient data for us to forecast each year separately.
2013 2014 2015 2016 2017
Period End Date 30-Jun-2013 30-Jun-2014 30-Jun-2015 30-Jun-2016 30-Jun-2017
Restructuring Charge (15) 3 0 (133) (226)
2018E 2019E 2020E 2021E 2022E 2023E 2024E 2025E 2026E 2027E
Period End Date 30-Jun-2018 30-Jun-2019 30-Jun-2020 30-Jun-2021 30-Jun-2022 30-Jun-2023 30-Jun-2024 30-Jun-2025 30-Jun-2026 30-Jun-2027
37
Table 7 - EL historical and forecasted Selling, general and administrative expenses from 2013-2027
Leading Beauty Forward initiative is expected to save costs in Selling, general and administrative expenses from fiscal 2021 onward. The savings are expected to be around $200-$300 million per year. We followed the company’s expectations and applied a $250 million reduction in each year from 2022 to 2026; the reduction was not applied in 2027 because we do not believe that the company can cut that precise amount forever, but we do believe that they will keep up with some costs reduction.
To forecast the Selling, general and administrative expenses for 2027, growth rates on Selling, general and administrative expenses were computed for the years 2022-2026 (where we applied a $250 million reduction). Next an average of those growth rates was computed (-0.60%).
To determine the 2027 growth rate for Selling, general and administrative expenses, we took the average growth rate of the years 2022-2026 (-0.60%) from the already computed and applied growth average (2.55%), giving us a terminal growth of 1.95%. Now, from 2027 onwards the company item will not be growing as much in the following years, reflecting some cost saving from the LBF initiative.
2013 2014 2015 2016 2017
Period End Date 30-Jun-2013 30-Jun-2014 30-Jun-2015 30-Jun-2016 30-Jun-2017 Selling/General/Admin. Expenses, Total 6.599 6.984 6.893 7.152 7.288
5,83% -1,30% 3,76% 1,90%
2018E 2019E 2020E 2021E 2022E 2023E 2024E 2025E 2026E 2027E
Period End Date 30-Jun-2018 30-Jun-2019 30-Jun-2020 30-Jun-2021 30-Jun-2022 30-Jun-2023 30-Jun-2024 30-Jun-2025 30-Jun-2026 30-Jun-2027 Selling/General/Admin. Expenses, Total 7.474 7.664 7.859 8.060 8.015 7.969 7.922 7.874 7.824 7.977 2,55% 2,55% 2,55% 2,55% 2,55% 2,55% 2,55% 2,55% 2,55% 1,95% -0,57% -0,59% -0,61% -0,63% -0,60%
38
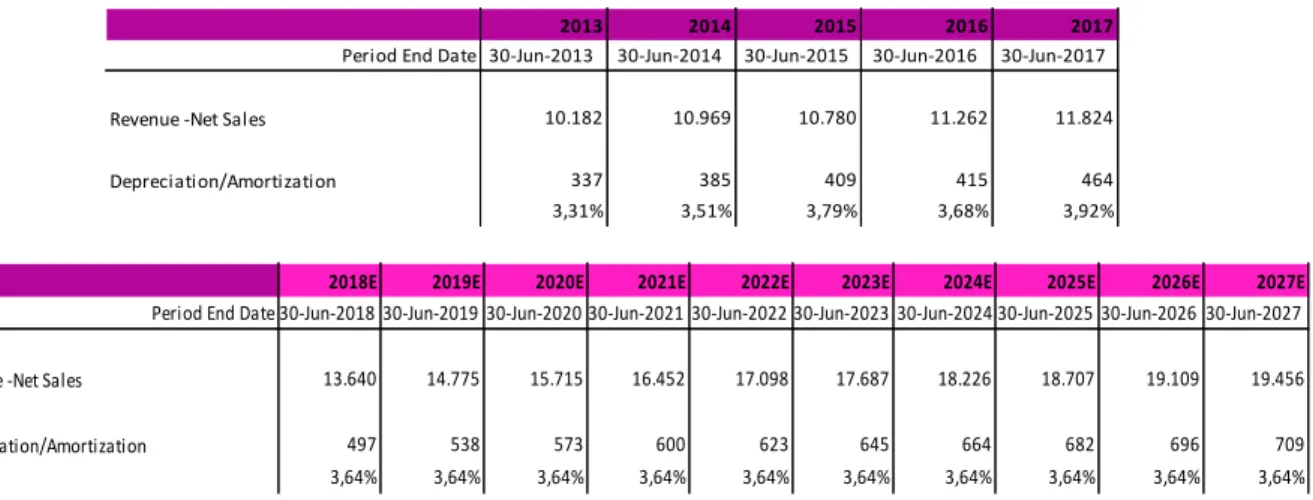
5.4 Depreciation and Amortization
The company informs in their reports that the Depreciation and Amortization is based on the item net sales, for that reason a ratio was computed for the years 2013-2017 between D&A and Net Sales, with this ration we can better analyze their relationship. The percentages are all quite similar, it can be observed in table 8, because of that an average of those percentages was computed and applied to the following years. Finally, to forecast the D&A we multiplied net sales of each year with the average ratio.
Table 8 - EL historical and forecasted Depreciation and Amortization from 2013-2027
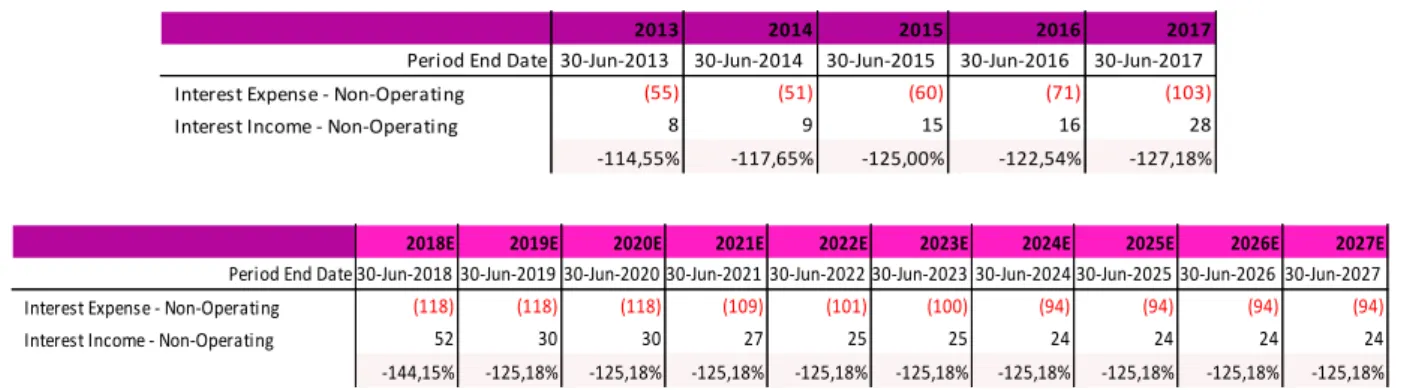
5.5 Interest
Interest item includes Interest Expense and Interest Income. Interest Expense was forecasted by computing each year’s interest expense on the corresponding debt (appendix 9); for that, special attention was given to maturity dates of bonds and loan. The loan, called New Facility, may be used for general corporate purposes.
The New Facility was not used yet, but to get it the company incurred in approximately $1 million to establish the credit line, this amount will be amortized during the term of the facility. Besides the cost incurred to establish it, there is an annual fee of approximately $1 million.
In our estimates we were conservative and did not account for issues such as new bonds or loans, instead, we maintained the value of interest expense at that time. We are accounting for at least the same interest on debt in the following years, which is not strange since the company is constantly issuing or renegotiating debt.
2013 2014 2015 2016 2017
Period End Date 30-Jun-2013 30-Jun-2014 30-Jun-2015 30-Jun-2016 30-Jun-2017
Revenue -Net Sales 10.182 10.969 10.780 11.262 11.824
Depreciation/Amortization 337 385 409 415 464
3,31% 3,51% 3,79% 3,68% 3,92%
2018E 2019E 2020E 2021E 2022E 2023E 2024E 2025E 2026E 2027E
Period End Date 30-Jun-2018 30-Jun-2019 30-Jun-2020 30-Jun-2021 30-Jun-2022 30-Jun-2023 30-Jun-2024 30-Jun-2025 30-Jun-2026 30-Jun-2027
Revenue -Net Sales 13.640 14.775 15.715 16.452 17.098 17.687 18.226 18.707 19.109 19.456
Depreciation/Amortization 497 538 573 600 623 645 664 682 696 709
39
Table 9 - EL historical and forecasted Interest from 2013-2027
To forecast Interest Income first we forecasted fiscal 2018 results, using the data available of the first 3 trimesters. Then we computed historical ratios between Interest Expense and Interest Income, from fiscal 2013 to fiscal 2018. An average of those ratios was computed and applied to the following years.
5.6 Taxes
In order to forecast the Provision for income taxes we computed the implied tax rate of past years. With this calculation we could better see how many taxes had the company paid in the last years, but it does not give us a precise estimate for the future, especially in the next years, since the new US tax law was approved.
Table 10 - EL historical and forecasted Taxes from 2013-2027
The US now has a flat corporate tax rate of 21%, but it cannot be directly applied to EL in fiscal 2018 due to the impact of TCJA provisional charges. For fiscal 2018 we applied a tax rate of 23%, following company’s estimate, and 21% for the remaining years. We believe that
2013 2014 2015 2016 2017
Period End Date 30-Jun-2013 30-Jun-2014 30-Jun-2015 30-Jun-2016 30-Jun-2017
Interest Expense - Non-Operating (55) (51) (60) (71) (103)
Interest Income - Non-Operating 8 9 15 16 28
-114,55% -117,65% -125,00% -122,54% -127,18%
2018E 2019E 2020E 2021E 2022E 2023E 2024E 2025E 2026E 2027E
Period End Date 30-Jun-2018 30-Jun-2019 30-Jun-2020 30-Jun-2021 30-Jun-2022 30-Jun-2023 30-Jun-2024 30-Jun-2025 30-Jun-2026 30-Jun-2027 Interest Expense - Non-Operating (118) (118) (118) (109) (101) (100) (94) (94) (94) (94)
Interest Income - Non-Operating 52 30 30 27 25 25 24 24 24 24
-144,15% -125,18% -125,18% -125,18% -125,18% -125,18% -125,18% -125,18% -125,18% -125,18%
2013 2014 2015 2016 2017 Period End Date 30-Jun-2013 30-Jun-2014 30-Jun-2015 30-Jun-2016 30-Jun-2017 Net Income Before Taxes 1.483 1.786 1.561 1.555 1.617
Provision for Income Taxes 451 568 467 434 361 tax rate % 30,41% 31,80% 29,92% 27,91% 22,33%
2018E 2019E 2020E 2021E 2022E 2023E 2024E 2025E 2026E 2027E Period End Date 30-Jun-2018 30-Jun-2019 30-Jun-2020 30-Jun-2021 30-Jun-2022 30-Jun-2023 30-Jun-2024 30-Jun-2025 30-Jun-2026 30-Jun-2027 Net Income Before Taxes 2.618 3.369 3.952 4.341 4.965 5.461 5.924 6.339 6.696 6.803
Provision for Income Taxes 602 708 830 912 1.043 1.147 1.244 1.331 1.406 1.429 tax rate % 23,00% 21,00% 21,00% 21,00% 21,00% 21,00% 21,00% 21,00% 21,00% 21,00%