Comparative Analysis on Country Reputation through Patterns of Intellectual Capital: The case Portugal Versus Romania.
Florinda Matos1, Válter Vairinhos1, Alexandru Capatina2, Gianita Bleoju2, Maria do Rosário Cabrita3 1 ICLab - ICAA - Intellectual Capital Accreditation Association, Santarém, Portugal.
2 Dunarea de Jos University of Galati, Galati, Romania.
3 UNIDEMI, Department of Mechanical and Industrial Engineering, Faculty of Science and Technology, FCT, Universidade Nova de Lisboa, Lisboa, Portugal.
[email protected] [email protected] [email protected] [email protected] [email protected]
Abstract: In the last decade the world economy has undergone numerous transformations that have changed the way we evaluate the assets of organizations, cities and countries. In this context, Intellectual Capital (IC) and Knowledge Management (KM), based on the management of intangible assets, became a factor of differentiation and competitiveness. The way countries are dealing with IC and knowledge management is a decisive factor in their international reputation, which in turn acts as country branding.
Country branding is the image of a nation-state and from the link between this image and the success of its economy, corresponding to its competitiveness, its richness, the efficiency of the state and the quality of life of its citizens, among others.
Reputable countries usually attract more investment and, consequently, are more innovative. While some decision makers argue that economic development should focus on investment and the creation of jobs, many studies have shown that this growth should be underpinned by the proper management of IC in all its dimensions.
Assuming that is proved a cause-effect relationship between IC management and innovation - the most innovative countries are those with a better IC management and vice versa - the purpose of this study is to search for empirical evidence of a possible relationship between these indicators and the reputation of the countries.
If it is possible to identify a connection between the variables that compose each index, we can design patterns that can guide the management of international branding strategy of each country. This paper uses multivariate data analyses techniques, including biplots methodology, in its attempt to study the case of Portugal versus Romania. These countries have different indicators, but both have problems in reputation management. In terms of originality, this empirical study aims to create discussions about the factors that determine the reputation of these countries.
Keywords: intellectual capital, innovation, competitiveness, reputation, branding Introduction
The main hypothesis subjacent to this work is the idea that National Intellectual Capital (NIC) is a strategic factor to be considered in the formulation of national policies. It is generally believed that NIC influences Innovation; Innovation influences Competitiveness; Competitiveness influences Economic Wealth. NIC, Innovation, Competitiveness and Economic Wealth influence the Reputation or Image of countries, which have important consequences in economy.
With this exploratory and descriptive study, we try to support in empirical evidence, the aforementioned relations and findings, already discovered or suggested by other works. Specifically, we study the relation between NIC as measured according with (Lin and Edvinsson, 2011) and (Lin et al., 2013) and the concept of image of a country as measured by a suitable index – brand or reputation index – such as recently proposed by Anholt, Simon(2006) and Anholt, Simon; Govers, Robert (2014).
The present work addresses also, in a quantitative way, the relations between NIC and other variables representing innovation, competitiveness and economic wealth, measured by appropriate indexes, trying to open ways for future research. We also try to compare, given the available evidence, the relative positions of Romania and Portugal with respect to concepts of NIC and branding.
When analysing a country reputation, we cannot neglect the metasystemic approach of IC (IC) and Territorial Intelligence as emerging subject/object of the research, which aim to educate and understand the logic of sustainable territorial change. This new object of research is an opportunity to bring together the complementary skills that traditionally have little dialogue between them and, thereby, create a true interdisciplinary discussion on a common purpose (See Passow et al., 2005, Bertacchini et al., 2013, Andersson, G., 2013; Garcia-Alsina et al, 2013). This important emerging subject, associated to the problem of Regional Intellectual Capital (RIC) will not be examined here with the detail it deserves, being the object of a future work. The structure of this paper is as follows: in section number 2, we formulate the hypothesis of interest and the corresponding model and outline the methodology employed to analyse the data available. In this section, we also identify the variables and data sources used. In section 3, we present the main results of data analysis and comment the results obtained, justifying the conclusions, presented in section 4.
1. Literature Review
A knowledge-driven economy is an economy in which the process of wealth creation takes place by generation and exploitation of knowledge and Intellectual Capital (IC) plays a predominant role. The increasing importance of IC has recognized it as valuable strategic asset with impact on the firm’s sustainable performance and innovation capability (Goh & Lim, 2004). Thus, IC is considered a driving force to gain competitive edge in the dynamic environment of globalization (Tovstiga and Tulugurova, 2007). It is widely accepted that an organization’s capability to innovate for competitive advantage is closely tied to its IC. In other words, the IC of an organization represents the wealth of the ideas and the ability to innovate that will determine its competitive position and the future of the organization.
The literature stresses that innovation is linked to IC management and competitiveness is a variable that interrelates with these two variables. There are few studies with explicit focus on IC and innovation driving competitiveness. The aim of this study is to contribute to this underdeveloped area of IC and innovation, through competitiveness framework.
Intellectual Capital
Intellectual capital is a complex concept. Different definitions have been set forward for exploring this complex concept. Furthermore, it has been recognized as the most important source of competitive advantage of various organizations which led to the increase of the business performances and a country’s economic growth. Stewart (1997) defines the IC as valuable intellectual asset that can be put to use to create wealth. Edvinsson and Malone (1997) defined IC as knowledge that can be transformed to generate value. Brooking (1996) argues that IC is the term given to the combined intangible assets that enable the company function. Williams and Bukowitz (2001) propose that IC embraces all forms of knowledge, ranging from the abstract (i.e. culture, norms, values, group dynamics and individual member’s knowledge and skills) to the concrete (i.e. documents, databases, process maps). Important underlying concepts in these definitions include the notion that: i) IC is an intangible asset; ii) it is closely related to knowledge, and; iii) it is the result of a collective practice. Bearing this in mind, it appears that different authors agree that: i) IC is an intangible asset that needs to be managed; ii) management of IC can create value; ii) management of IC can generate competitive advantages; iv) Human capital, Structural capital and Relational capital are the main components of IC. These three elements of IC represent and comprise the organization’s stock of intangible assets. Value creation takes place as knowledge is exchanged between these three elements (Cabrita, 2009).
Innovation
There is a diverse range of definitions of innovation in the literature, but a recurring theme across the definitional debate is that “new ideas” represent the starting point for innovation (Sexton and Barrett, 2003). In the literature, innovation is generically associated to how an organization develops new knowledge or modifies the existing one to create new products and processes that help to increase value for the company. Whatever the accepted definition is, there is a consensus about its importance in economic development, because successful innovation gives a company something unique that its competitors lack (Hill and Jones, 1998).
Innovation depends heavily on knowledge and for IC to be leveraged, an innovation is needed. The innovation acts as a pivot to create products and services that offer additional value to customer (Yitmen, 2011). Innovation is a process of creating something new and, hence, organizations that encourage leveraging IC are more competitive.
Competitiveness
Today, innovation in processes that enable the development of new products, techniques, business models and even ideas, determine the rate at which companies must adapt. Therefore, competitiveness has become one key challenge in the corporate agenda. Porter’s theory has been the dominant tool for analyzing the firm’s competitiveness, in the past two decades. Major components in Porter’s theory are: 1) the five competitive forces model; 2) the three generic competitive strategies, and; 3) the value chain (Porter, 1985). In a turbulent environment, organizations undergo substantial change which creates continuous pressure to innovate in products and processes to maintain or increase their value to customers. In such context to maintain the competitive advantage is critical to success.
The effects of intellectual capital and innovation in competitiveness
In the era of the knowledge economy, IC, which would dominate the growth of a firm, is an important asset for future development. Moreover, there is a positive relationship between IC and innovation (Zerenler et al., 2008). As mentioned by Edvinsson and Malone (1997), the more IC in a company, the more distinctive is the unique competence of the company and so, more competitive it becomes. Yitmen (2011) examined the relationship between IC, innovation and competitiveness in a particular sector in Turkey and found a causality path where IC is positively associated with competitiveness and innovation drivers. The potential to innovate can be regarded as the result of IC within the firm. Hence, we can propose that there is positive relationship between IC and competitiveness.
2. Methodology and Data Sources
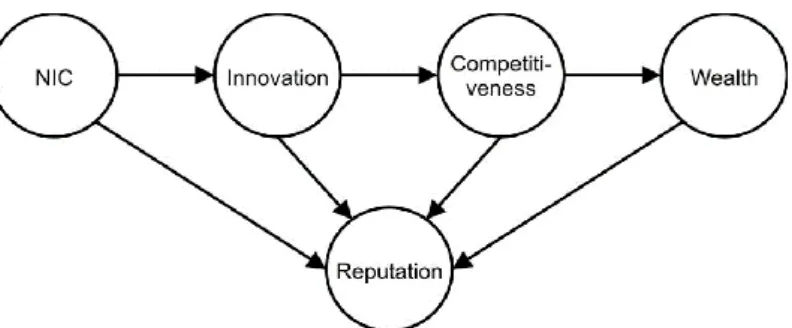
The general idea expressed in the introduction, relating NIC with Innovation, Competiveness, Wealth and Image can be translated in the following influence graph, where the arrows express “influence” and the nodes correspond to the variables involved. So, for instance, it is assumed in the graph that NIC influences Innovation, expressed by a convenient observable variable; the direction of this arrow means causality and this assertion corresponds to a hypothesis or belief that must be validated, “demonstrated” or “tested”.
Figure 1: Hypothetical relations between variables involved
The influences between variables - expressed by direction of arrows - correspond to hypothetical relations of the type cause -> effect that, ideally, should be proven. The “proof” of such relations using statistical methods is very difficult if not impossible, since there is no experimentation in this domain. What can be done in a first exploratory stage is to study the available data using descriptive techniques and try to discover empirical evidence or manifestations of the assumed relations.
If the assumed hypothesis - the model expressed in the graph - was true (for example: NIC has an important influence on Innovation), it would be expected that countries were NIC was used during a convenient period of time, as a decision variable in formulating national policies, some results, expressed by available data, would be observed in subsequent periods of time. And the reverse: for countries where that was not the case, absence of those manifestations would be expected. As a methodological consequence, it would make sense, in this context, to correlate, for example, values of NIC, observed during the period 2004-2010, with values of its possible consequences (observed values of dependent variables), manifested in the years 2013, 2014 or later - as we did in the analysis. This should be contrasted with similar consequences for countries where NIC was not used in strategic planning and policies formulation.
Unfortunately, the concept of NIC is relatively recent and its values have been estimated only for a small group of countries (about 50) – see Lin and Edvinsson, 2011; Lin et al., 2013 - and, for these, there is a small fraction where it is possible to use NIC as a decision factor in national policy formulation. In this descriptive study, we
used the available data for NIC (according to References) and, just for these countries, we considered the values of three available brand indexes - Country Brand Ranking©, Country Brand Index (CBI), Good Country Index© - and international statistics of Innovation, Competiveness and Wealth for the countries belonging to that limited set.
In this work, we limit our investigative activity to the examination of data available relative to the just mentioned set of countries, aiming to detect correlation based associations between appropriate indicators representing the aspects mentioned. SPSS has been used to perform descriptive statistics. Biplots - see Matos et al., 2014; Gabriel, 1971; Vairinhos, 2003; Vairinhos and Galindo, 2004 - are useful descriptive instruments to discover and show graphically such associations since it is possible to plot simultaneously the variables involved and the countries that contribute for those associations. We reserve for future work the formulation and study of more elaborate models such as structural equations involving the aforementioned indicators and the corresponding latent variables or Bayesian networks - where hypothetical causal relations can be addressed more explicitly. The variables/indicators involved in the statistical study that follows, its meaning and symbols are:
NIC – National Intellectual Capital - As defined in Lin and Edvinsson, 2011. This index is the sum (see Lin and Edvinsson, 2011) NIC = HIC + RIC + FIC + PIC + MIC, where HIC = Human Intellectual Capital, RIC = Renewal Intellectual Capital, FIC = Financial Intellectual Capital, PIC = Process Intellectual Capital, MIC = Market Intellectual Capital.
The data source for MIC are the two references Lin and Edvinsson, 2011 and Lina at al., 2013. In Lin and Edvinsson, 2011, values for the mentioned components are presented for a period of time from 1995-2008, involving 40 countries but not Romania. In Lina et al., 2013, a study of countries of the PIGS group is presented and, for 48 countries including Romania, the averages for the period 2005–2010 are presented.
GII - The chosen indicator for Innovation was the Global Innovation Index (GII). This index is published by the
business school INSEAD and covers 143 countries. (see
http://www.globalinnovationindex.org/content.aspx?page=gii-full-report-2014. For each year there is a report). There are available all the reports for years 2007 to 2015. As can be read from reports, it is a human centric index.
GCI - Competitiveness is characterized in this study through the Global Competitiveness Index, defined and published by World Economic Forum. According with this institution (see http://www.weforum.org/reports/global-competitiveness-report) “...Global Competitiveness Report 2014/2015
assesses the competitiveness landscape of 144 economies, providing insight into the drivers of their productivity and prosperity. The report remains the most comprehensive assessment of national competitiveness worldwide, providing a platform for dialogue between government, businesses and civil society about the actions required to improve economic prosperity. Competitiveness is defined as the set of institutions, policies and factors that determine the level of productivity of a country. The level of productivity, in turn, sets the level of prosperity that can be earned by an economy”.
HDI – Human Development Index has been selected in this study to represent the countries’ economic wealth. This index is published every year for all countries and measures the wealth of people in every country by the United Nations Development Programme (see http://hdr.undp.org/en/content/human-development-index-hdi). From this site, consulted in 24 March 2015, we extracted the following definition: “…The Human
Development Index (HDI) is a summary measure of average achievement in key dimensions of human development: a long and healthy life, being knowledgeable and have a decent standard of living. The HDI is the geometric mean of normalized indices for each of the three dimensions”.
IMAGE – We selected three indexes among several currently in use: the Country Brand Ranking© (Bloom Consulting, 2013), the Country Brand Index from FutureBrand and the Good Country Index, from Anholt, 2006 and Anholt and Govers, 2014.
For the definition, methodology and ranks of the Country Brand Ranking© (see: http://www.bloom-consulting.com/pdf/rankings/Bloom_Consulting_Country_Brand_Ranking). Specifically, for the definition and methodology used to calculate this index for year 2013 see: http://www.bloom-consulting.com/pdf/rankings/Bloom_Consulting_Country_Brand_Ranking_Trade_2013.pdf,consulted in 24/03/2015.
From this publication we extracted the following definition: “…This ranking contemplates the Trade (investment)
try to measure solely country brand perception. The objective of this ranking is to classify how well each and every country is doing in terms of branding , that is, to measure how effective their brand is in the most tangible and realistic manner…”.
The Country Brand Index, published for the first time in 2015 and available at: http://www.futurebrand.com/cbi/2014, uses a methodology built around the following idea: “…, we set out to
test an emerging hypothesis that not all countries qualify as ‘brands’. But when they do, they have a measurable competitive advantage over their peer countries…”
Another index related to country image and reputation is the Good Country Index, created by Simon Anholt and Robert Govers (2014). See: http://www.goodcountry.org/overall. From this site, consulted in 24/03/2015, we extracted the following definition: “…The idea of the Good Country Index is pretty simple: to measure what each
country on Earth contributes to the common good of humanity and what it takes away…” In this same site, the
corresponding methodology can be consulted and studied. This index has seven components. 3. Data Analysis: Main Findings
3.1 Symbols and meanings of variables
The symbols and meaning of variables used in the analysis and results obtained with statistical software are: NIC– National Intellectual Capital (average 2004-2008) with components: HIC – Human Intellectual Capital (average 2004-2008); MIC– Market Intellectual Capital (average 2004-2008) ; PIC– Process Intellectual Capital (average 2004-2008); RIC– Renewal Intellectual Capital (average 2004-2008); FIC– Finance Intellectual Capital (average 2004-2008).
GCI_13_14 – Global Competitive Index (2013 - 2014) GII_14 – Global Innovation Index (2014)
HDI_13 – Human Development Index (2013) Brd13 – Country Brand Rating (2013)
BR_14_15 – Country Brand Index (2014-2015)
GoodCI – Good Country Index with components: ScAndTech – Science & Technology; Culture; IntPeaceSec - International Peace and Security; ProspEqual - Prosperity and Equality; WorldOrder – World Order; PlanetClimate – Planet and Climate; Health – Health and Wellbeing.
NIC CtrGrp - It is an auxiliary variable that identifies countries belonging to groups (1, 2 and 3) according to First Quartile (1), Interquartile range (2) and Third quartile (3) of NIC_S.
3.2 Results of basic descriptive statistic
The results that follow were obtained with SPSS vs 17.0. Table 1 shows the basic statistics relative to the variables involved:
Table 1: Basic Statistics
NIC_S GII_14_S GCI_13_14S HDI_13S BR_13R BR_14_15R GoodCI
N Valid 46 46 46 46 46 44 46 Missing 0 0 0 0 0 2 0 Mean 29,74896 47,3396 4,74998 ,82834 30,57 28,64 39,02 Median 29,05650 47,9200 4,63535 ,86513 27,50 24,50 30,50 Mode 20,092a 40,64 3,351a ,586a 1a 1a 1a Percentiles 25 24,26700 38,2375 4,32286 ,76241 12,75 11,25 11,75 50 29,05650 47,9200 4,63535 ,86513 27,50 24,50 30,50 75 35,27625 55,6975 5,18260 ,89819 45,50 45,75 57,25
Figures 2 to 7 show, for each variable, the corresponding box plot for the group 1, 2 and 3 of NIC. Except for the values of variable BR_13R (Country Brand Ranking©), we see that there is a clear differentiation corresponding
to the values of NIC associated to the groups of countries; this trend is sharp and corresponds to an increase of the mean – except for GoodCI, that, being a rank, the tendency is decreasing. In synthesis, for these variables, the good looking countries are also those for which the NIC, GII, GCI, HDI is greater; and the reverse.
The corresponding pattern for Country Brand Ranking© is undefined.
The examination of figures 2-7 suggests an emerging pattern that can be confirmed with the results of an analysis of variance (ANOVA), as shown in Table 2: as anticipated by the examination of figures, this analysis confirms that the means of the distinct variables are significantly different inside the groups of countries defined by values of NIC. The notable exception, once more, is for Country Brand Ranking©: the means of this index are practically the same for the three groups.
Except for Country Brand Ranking©, the means of the other variables are significantly distinct when the values of NIC (1, 2 and 3 for variable NIC CtryGrp) are used as factor levels.
Table 2: Anova
Sum of
Squares df
Mean
Square F Sig. NIC_S Between Groups 1270,308 2 635,154 84,447 ,000
Within Groups 323,417 43 7,521
Total 1593,726 45
GII_14_S Between Groups 3132,862 2 1566,431 43,145 ,000
Within Groups 1561,161 43 36,306
Total 4694,023 45
GCI_13_14S Between Groups 7,070 2 3,535 23,277 ,000
Within Groups 6,530 43 ,152
Total 13,600 45
HDI_13S Between Groups ,212 2 ,106 36,863 ,000
Within Groups ,124 43 ,003 Total ,336 45 BR_13R Between Groups 43,183 2 21,592 ,048 ,953 Within Groups 19436,121 43 452,003 Total 19479,304 45 BR_14_15R Between Groups 3673,212 2 1836,606 5,499 ,008 Within Groups 13692,970 41 333,975 Total 17366,182 43
GoodCI Between Groups 28148,971 2 14074,485 28,291 ,000
Within Groups 21392,008 43 497,489
Total 49540,978 45
Figure2 GII vs NIC Figure 3 GCI vs NIC Figure 4 HDI vs NIC
Figure 5 BR_13 vs NIC Figure 6 BR_14_15 vs NIC Figure 7 GoodCI vs NIC
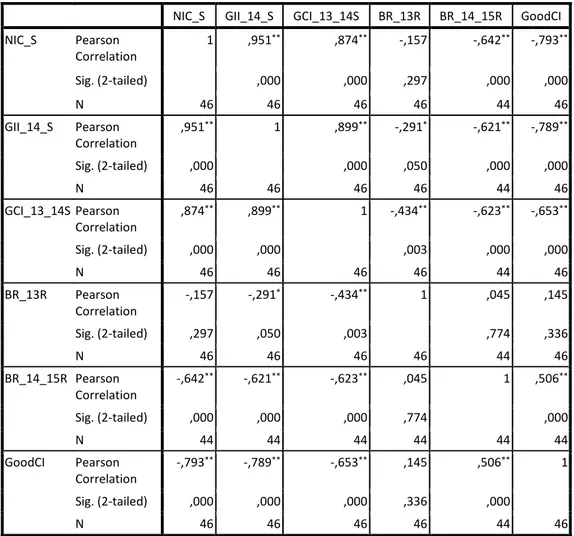
These findings are reinforced with the correlation coefficients, shown in Table 3. As expected, all values are significant at the 0.01 level, except for Country Brand Ranking©. This seems to suggest that there are linear relations between all variables except for Country Brand Ranking©.
Table 3: Spearman correlations between variables
NIC_S GII_14_S GCI_13_14S BR_13R BR_14_15R GoodCI NIC_S Pearson Correlation 1 ,951** ,874** -,157 -,642** -,793** Sig. (2-tailed) ,000 ,000 ,297 ,000 ,000 N 46 46 46 46 44 46 GII_14_S Pearson Correlation ,951** 1 ,899** -,291* -,621** -,789** Sig. (2-tailed) ,000 ,000 ,050 ,000 ,000 N 46 46 46 46 44 46 GCI_13_14S Pearson Correlation ,874** ,899** 1 -,434** -,623** -,653** Sig. (2-tailed) ,000 ,000 ,003 ,000 ,000 N 46 46 46 46 44 46 BR_13R Pearson Correlation -,157 -,291* -,434** 1 ,045 ,145 Sig. (2-tailed) ,297 ,050 ,003 ,774 ,336 N 46 46 46 46 44 46 BR_14_15R Pearson Correlation -,642** -,621** -,623** ,045 1 ,506** Sig. (2-tailed) ,000 ,000 ,000 ,774 ,000 N 44 44 44 44 44 44 GoodCI Pearson Correlation -,793** -,789** -,653** ,145 ,506** 1 Sig. (2-tailed) ,000 ,000 ,000 ,336 ,000 N 46 46 46 46 44 46
**. Correlation is significant at the 0.01 level (2-tailed). *. Correlation is significant at the 0.05 level (2-tailed). 3.3 Results obtained with multivariate data analysis
The results presented in 3.1 anticipate clearly the main findings of this study. But it is also interesting to relate simultaneously all the variables and the variables with the countries where the variables obtain its values. Figures that follow were obtained with biplots (Gabriel, 1971; Vairinhos, 2003; Vairinhos and Galindo, 2004). The biplots were obtained with the components of NIC_R. The same results could have been obtained with values of components expressed as scores (symbol _S). The choice is only a graphical convenience. In a simplified way, these graphics show simultaneously the results of an analysis in Principal Components and also the positions of markers representing, in the present case, the countries.
Since NIC is considered in this study the factor or independent variable, the other variables are plotted in these graphs as supplementary variables, meaning that they are placed without having contributed for the shape of the graph. In this way, we can discover by visual inspection some relations potentially interesting.
Figure 8 shows clearly that GoodCI and also BR_14_15R are related with NIC (expressed as NIC_R and also as NIC_S); GoodCI has a higher association with NIC than BR_14_15R. We see also that BR_13R (Country Brand Rating 2013) occupies the center of biplot (origin that coincides with the average of all variables). This means that this indicator has not any interesting association with other variables or countries. On the other side, GoodCI is related with RIC (Renewal Capital- Research and Development) and BR_14_15 with HIC (Human IC) and FIC
(Financial Capital). The figure shows also that the countries for which NIC_R has larger values (NIC_S small values) – for example Philippines, Mexico or Venezuela - are also the countries for which GoodCI (expressed as a rank) and BR_14_15 have larger values and the reverse (GoodCI has smaller values for the countries where NIC_R has larger values such as Denmark, Canada or Norway).
In this figure we can see also the positions of Portugal and Romania and its respective neighbors; although rankings for the indexes are different - absent in Top 20 - we see that both countries are neighbors in the plot, meaning that from the point of view of GoodCI and BR_14_15 and also from NIC, they are seen as similar.
Figure 8: NIC_R and NIC_S – plotted as supplementary variables, occupy opposite positions since that increasing values of NIC_S correspond to decreasing values of NIC_R. This figure shows also the positions of “dependent variables”, GoodCI, BR_13R - Country Brand Rating (2013) and BR_14/51 Country Brand Index.
Figure 9 shows now the components of NIC, GoodCI and BR_14_15, allowing a global impression and to discover associations between components of NIC and GoodCI. We see that components PlanetClimate and WorldOrder are associated with HIC (Human Capital) and FIC (Financial Capital). In its turn, the components Culture, Health Wisdom and Science and Technology are very associated with RIC (Renewal Capital). This means that the countries that score the less (greater ranks) in HIC and FIC are also the ones for which the ranks of PlanetClimate and WorldOrder are higher) – and the reverse. Similarly, the countries that score the less for RIC are also the ones that score the less for Culture, Health Wisdom and Science; and the reverse. Note the position of component IntPeaceSe – International Peace and Security - associated to countries where NIC has larger values: the image associated to countries that have concerns of this kind corresponds to countries very wealthy and technologically very sophisticated.
Figure 9: In this figure, we see now the components of GoodCI and its positions in relation to the components of NIC. Notice the behavior of component IntPeaceSec (International Peace and Security)
If the names of the countries are replaced with the ranks corresponding to BR_14_15R, Figure 10 is obtained after plotting also the variables GII_R (Global Innovation Index), GCI (Global Competitive Index) and HDI (Human Development Index) as supplementary variables, allowing a great association between all variables and, specifically, the similar position of Romania and Portugal in relation to these indicators.
Figure 10: Big Picture. The names of countries have been replaced with the ranks GoodCI. Relation between Image (GoodCI, BR_14_15) and NIC, GII, GCI, HDI.
3. Conclusion
Through this study, it has been shown that the available empirical evidence supports some relevant assumptions of the hypothesis (and model) formulated in the introduction - Figure 1. It has been shown that the Country Brand Ranking© has not any relevant relation with NIC, GII, GCI and HDI. On the other hand, there is plenty of evidence that the image of countries expressed by the ranks of indicator GoodCI, defined in Anholt and Govers, 2014, is well predicted by NIC, GII, GCI and HDI, supporting partially the corresponding assumptions expressed by the formulated hypothesis.
The available data cannot be used to support all the causal aspects of the formulated model since the use of NIC as a decision variable/factor in the formulation of national policies has not yet taken place in an adequate number of countries for a large enough period of time. Meanwhile, this study has strengthened the initial idea of the strategic nature of this concept, to be investigated with more observational data and appropriate statistical methodologies.
Both Romania and Portugal, being aware of the fact that knowledge and innovation played a crucial role in territorial economic and social development and that this factors are becoming the catalyst of competitiveness in the last decades of ICT acceleration. We are now assisting to institutional reconfiguration attempts, in different levels of implementation and success, depending upon the adequate understanding of territorial specificity.
References
Anholt, S. (2006). Competitive identity: The new brand management for nations, cities and regions. Palgrave Macmillan.
Anholt, Simon; Govers, Robert (2014). Overall Rankings. The Good Country Index. Retrieved 1 July 2014. Andersson, G. (2013). Rethinking regional innovation. Systemic Practice and Action Research, 26(1), 99-110. Bertacchini, Y., Déprez, P., & Perez-Rubio, A. M. (2013). The way and Tracks of mediation in action into a territorial sustainable development project: sharing skills & actors knowledge through ICTs. Revue internationale
d'intelligence économique, 5(2), 113-123.
Bloom Consulting (2013). Country Brand Rank. Available at: http://www.bloom-consulting.com/pdf/rankings/Bloom_Consulting_Country_Brand_Ranking
Brooking, A. (1996). Intellectual capital. International Thompson Business Press.
FutureBrand (2014) Country Brand Index (CBI) report for 2014-2015, available at http://www.futurebrand.com/cbi/2014
Cabrita, M.R. (2009). Intellectual capital: A phenomenon of interrelationships, International Journal of Business
and Systems Research, 3(2), 229-256. DOI: 10.1504/IJBSR.2009.024864.
Edvinsson, L. and Malone, M. (1997). Intellectual capital: The proven way to establish your company’s real value
by measuring its brain power. Harper Collins.
FutureBrands (2015) Country Brand Index. Available at: http://www.bloom-consulting.com/pdf/rankings/Bloom_Consulting_Country_Brand_Ranking_Trade_2013.pdf
Gabriel, K.R. (1971) The biplot - graphic display of matrices with applications to principal component analysis,
Biometrika, 58, 453-467.
Garcia-Alsina, M., Wartena, C., & Lieberam-Schmidt, S. (2013) Regional Knowledge Maps. 5th International
Conference on Knowledge Management and Information Sharing – KMIS 2013.
Goh, P. C., and Lim, K. P. (2004) Disclosing intellectual capital in company annual reports: Evidence from Malaysia. Journal of Intellectual Capital, 5(3), 500-510.
Hill, C. and Jones, G. (1998) Strategic Management: An Integrated Approach. New York: Houghton Mifflin Company.
Lin, Carol Yeh-Yun; Edvinsson, Leif (2011) National Intellectual Capital A Comparison of 40 Countries. Springer Verlag.
Lin, Carol Yeh-Yun; Edvinsson, Leif; Jffrey Chen; Tord Beding (2013) National Intellectual Capital and the Financial
Crisis in Greece, Italy, Portugal, and Spain. Springer Verlag.
Matos,F.; Valter Vairinhos,V.M.; Cabrita,M.R. (2014) The Intellectual Capital of the Countries: A New Perspective using Biplots. Proceedings of the 6th European Conference on Intellectual Capital: ECIC 2014.
Passow, T., Fehlmann, R. and Grhlow, H. (2005) Country reputation –from measurement to management: The case of Liechtenstein. Corporate Reputation Review, 7(4), 309-326.
Poter, M. (1985) Competitive advantage : creating and sustaining competitive performance. New York : Free Press, 1985.
Sexton, M. and Barrett, P. (2003) Appropriate innovation in small construction firms, Construction Management
and Economics, 21 (6), 623-633.
Stewart, T. (1997) Intellectual capital: the wealth of nations. Doubleday.
Tovstiga, G. and Tulugurova, E. (2007) Intellectual capital practices and performance in Russia enterprises.
Journal of Intellectual Capital, 8(4), 695-707.
Vairinhos, V.M. (2003) BiplotsPMD - Un programa para Análisis Multivariante Centrada en Biplots. Congreso
Internacional de Estadística y Medio Ambiente (EMA4), Salamanca, Espanha.
Vairinhos, V.M.; Galindo, M.P. (2004) BiplotsPMD - Data Mining Centrada em Biplots. Apresentação de um Protótipo, XI Jornadas de Classificação e Análise de Dados. Associação Portuguesa de Classificação e Análise de Dados, Lisboa.
Zerenler, M., Hasiloglu, S. and Mete, S. (2008) Intellectual capital and innovation performance: Empirical evidence in the Turkish automotive supplier. Journal of Technology Management and Innovation, 3(4), 31-40. Williams, R. and Bukowitz, W. (2001). The yin and yang of intellectual capital management. Journal of Intellectual
Capital, 2(2), 96-108.
Yitmen, I. (2011).Intellectual capital: A competitive assets for driving innovation in engineering design firms.