A work project, presented as part of the requierement for the award of Masters in
Economics in Faculdade de Economia da Universidade de Lisboa
The Impacts of Free Trade Agreements on use of Antidumping
Selçuk Cemal SUMER 14000175
A Project carried out on the course with the supervision of
Prof. Chrysostomos TABAKIS
The Impacts of Free Trade Agreements on
Use of Antidumping
Abstract
This paper investigates the effects of bilateral trade agreements on the antidumping use. It points out the antidumping investigations and measures imposed from the 16 major members of WTO, in the recent years. It also states the increasing number of use of antidumping and its policies in developing countries. From the available data it examines the alterations of antidumping investigations initated by a developed country (the USA) and a developing country (Brazil) against their major trading partners under bilateral trade agreements. It states that if there is more or less antidumping use depending on a country being developed or developing.
1.Introduction
Many countries take action against dumping. The General Agreement on Tariffs and Trade lays down the principles to be followed by the member countries for imposition of anti-dumping duties. It has been argued that in the post-Uruguay-Round world, anti-dumping (AD) actions, as with other contingent protection measures, may become an 'instrument of choice' in place of tariffs to restrict international trade (Llyod and Morrissey, 1998). Pursuant to GATT, 1994, detailed guidelines have been prescribed under the specific agreements which have also been incorporated into the national legislation of the member countries of the WTO. If investigations show that dumping is taking place and domestic industires are being hurt or in other words if there is injury to imports-competing with domestic industry, legislation pertmits countries to act against dumping. In order to do that the government has to be able to show that dumping is taking place, calculate the extent of dumping (how much lower the export price is compared to the exporter’s home market price), and show that the dumping is causing damage or threatening to do so.
According to the WTO antidumping action can be defined as, charging additional import duty on the particular product from a foreign country in order to bring its price closer to home country`s. The exporting country can undertake to raise its price to an agreed level in order to avoid antidumping import duty. The GATT/WTO statues over the past 25 years, the legal definition of ‘dumping’ is almost completely divorced from any economic notion of antidumping (Blonigen-Prusa, 2001). There are many different ways of calculating whether a particular product is being dumped heavily or only lightly. The agreement follows a range of possible options.1 Before 1980 almost all AD activity was restricted to six major countries: The USA, the EU, Australia, Canada, South Africa and New Zealand with a total number of cases of two or three-dozen per year at the most. After 1980, not only the EU and the USA still had the most AD cases but also developing countries such as Brazil, India and Turkey have become intense users of AD. The trend has been altered recently where the developing countries have started using antidumping to limit their imports, many of them have also given up most other forms of flexibility in trade policy adopting WTO diciplines and agreeing to bind their tariffs ( Bown, 2007).
In this paper, first of all we want to demonstrate the alterations in the new antidumping initiations and the antidumping measures that are imposed by the WTO members and we will compare the adjustments that took place during the 2007-2008 time period. By doing so we will be proving how the trend changes in terms
of AD initiations from developed to developing countries.
Secondly we will show how the Free Trade Agreements affect the use of antidumping on goverments. Depending on the size of the economy( developed or developing countries) we want to figure out what the impact is of FTAs on antidumping use . In our examples we will use the AD initiations of the USA and Brazil, depending on whether it is a developed or developing country, respectively. Latterly, we will show the case of AD initiations without any FTAs.
Then, we will estimate some econometric models, explaining the number of AD initiations by using the macroeconomic determinants, to see what the significance of FTAs is on the use of antidumping. We will estimate the USA-Canada, under a FTA (CUSTA) , the USA-Mexico under NAFTA, as the USA is reporter country whereas Canada and Mexico are its trading partners. Also we will review of developing countrys’ use of antidumping investigations and measures imposed after the 1980s. Finally, we will estimate the model for Brazil and its trading partner Argentina under MERCOSUR.
2.The new AD investigations and measures imposed during
2007-2008
According to recent data from WTO , comparing 2008 to 2007, the number of new antidumping investigations increased by 31%, whereas the number of antidumping measures applied increased by only 19%. During the same period developing countries dominated this trend in terms of AD investigations and AD
2 These 16 Members are: developing countries such as; Argentina, Brazil, China, Colombia, Egypt, India, Pakistan,
measures. They initiated 73% of all new investigations but on the other hand they were the target of 78% of all new initiations (Bown, 2007).
Pursuent to data from WTO, 16 Members2 initiated 85% of all antidumping investigations by the WTO membership during 1995-2006. In 2007 those sixteen WTO members initiated a total number of 143 new antidumping investigations while in 2008 the total number of initations was 188. They applied 100 AD measures in 2007 and 120 AD measures in 2008 with an increase of 20% in one year. Developed countries, in 2007, initated 58 (41%) new investigations and applied 23 (23%) new AD measures, comparing to 2008. In 2008 they initiated 50 (27%) of the total 188 new investigations and imposed 54 (45%) of the 120 new AD measures. On the other hand, in 2008, developing countries initiated 138 (73%) of the 188 new investigations and imposed 66 (55%) of the 120 new final measures for 2008. This compares with 85 (59%) new investigations and 77 (77%) new measures that developing countries applied in 2007.
In 2008 The most antidumping investigations in developed countries were from the United States and the European Union (18 each), followed by Australia (6), South Korea (5), Canada (3). From the developing countries India initiated the most antidumping investigations in 2008, with 54 new initiations. It was followed by Turkey and Brazil (23 each), Argentina (19), China (7), Colombia (6), Pakistan, and South Africa (3 each). Egypt and New Zealand had initiated new investigations in 2007, but they did not initiate any new investigations in 2008.
of AD initiations for Canada, the European Union, India, Pakistan, Turkey, China, Colombia, Australia, Brazil, and Argentina. The most commonly investigated products in 2008 were raw materials such as; the steel and iron sector with a number of 48 initiations, followed by the chemical sector and the textile/apperal sectors (35 initiations each). In the iron and steel sector, India initiated one half of them, while the EU initated only 11.
In 2008 China’s products were most fequently subjected to new antidumping measures, comprising of 41% (49 new measures) of the 120 new measures imposed during that period. These 49 measures were imposed on Chinese exports, followed by the EU (9), Taiwan (8), South Korea (7), the US (6), India and Indonesia (4 each).
3. Developing countries and AD Policy
Implementation of antidumping in developing countries has become frequent in recent years. Before a government can enforce an antidumping import restriction, WTO Agreement requires sufficient economic corroboration to confirm that behaviour of foreign exporters and the market conditions convince the legal criteria and procedures. Within antidumping laws and the economic incentives , domestic
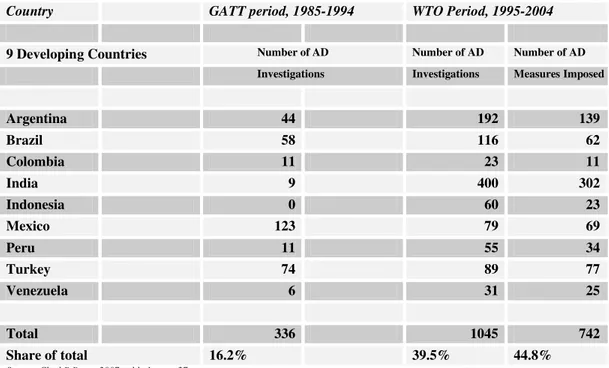
industries diverge in their need and skill to attain import protection. Table 3.1. Presents the antidumping investigations and imposed measures among the
GATT (before 1995) and under WTO (after 1995). A substantial amount of antidumping investigation and imposed measures have been utilized by developing countries such as: Argentina, Brazil, Colombia, India, Indonesia, Mexico, Peru, Turkey and Venezuela. Between 1995-2005 these nine developing countries utilized 39.5% of all the new investigations and 44.8% of all the new measures imposed.
Table 3 .1 . - Nine De ve loping c ountries Us e of AD unde r GATT and WTO Pe riods
Country GATT period, 1985-1994 WTO Period, 1995-2004
9 Developing Countries Number of AD Number of AD Number of AD Investigations Investigations Measures Imposed
Argentina 44 192 139
Brazil 58 116 62
Colombia 11 23 11
India 9 400 302
Indonesia 0 60 23
Mexico 123 79 69
Peru 11 55 34
Turkey 74 89 77
Venezuela 6 31 25
Total 336 1045 742
Share of total 16.2% 39.5% 44.8%
Source: Chad P.Bown, 2007, table 1, page 27.
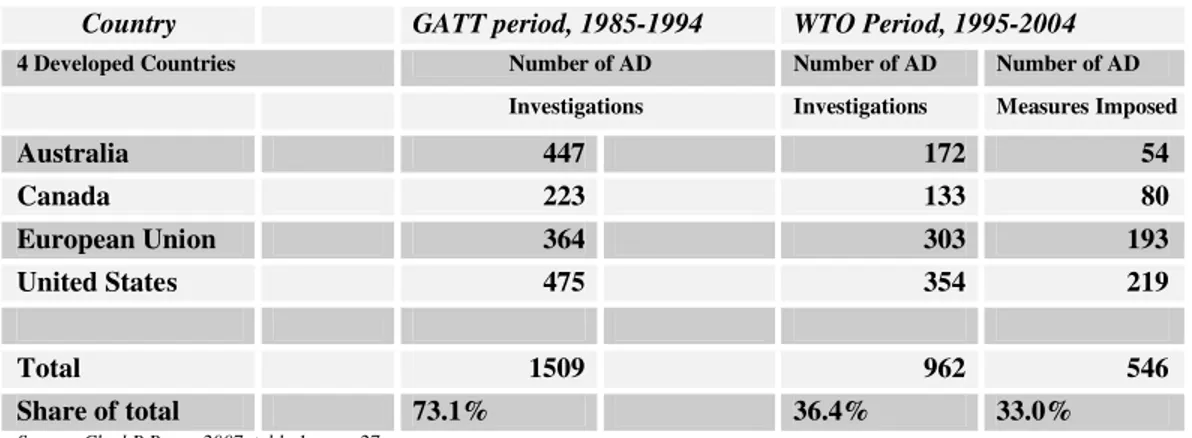
Table 3 .2 .-Four De ve lope d Country Us e of AD unde r GATT and WTO Pe riods
Country GATT period, 1985-1994 WTO Period, 1995-2004
4 Developed Countries Number of AD Number of AD Number of AD
Investigations Investigations Measures Imposed
Australia 447 172 54
Canada 223 133 80
European Union 364 303 193
United States 475 354 219
Total 1509 962 546
Share of total 73.1% 36.4% 33.0%
Source: Chad P.Bown, 2007, table 1, page 27.
Table 3.3 presents some of the products which industries use more number of antidumping protection from imports. Each developing country initiated at least one antidumping investigation and received import protection under at least one imposed measure.
Table 3 .3 .- Antidum ping Us e by Indus try Ac ros s Nine De ve loping Countrie s , 1995-2002
COUN TRY I r on a n d
St e e l
Ch e m ica ls Fa br ica t e d M e t a l
Gla ss pr o du ct s
Food pr odu ct s
Te x t ile s TOTAL
ARGENTINA 5 5 6 5 3 2 2 6
BRAZIL 6 6 4 3 3 2 2 4
COLOMBIA 3 3 0 0 0 1 7
INDIA 6 7 1 0 0 2 1 6
INDONOSIA 5 2 0 0 1 0 8
MEXICO 5 5 2 0 3 1 1 6
PERU 2 3 1 0 3 1 1 0
TURKEY 1 3 1 0 0 3 8
VENEZULA 4 2 1 0 0 0 7
Source: Global Antidumping Database
Brazil (24) , India and Mexico (16 each). Peru (10), Turkey (8), Colombia and Venezuela (7 each). Antidumping investigations tend to be disproportinately concentrated in a few industries. Within active user industries, there are large and powerful firms that dominate the use of antidumping (Aggarwal,2007).
According to data from the WTO, more than 2500 antidumping investigations were initiated globally between January 1995 and June 2004. However not all of these investigations yielded definitive measures. The number of measures actually in force as of the 30 June 2004 was just under 1350.
4. FTAs and the impacts on use of AD
In this part we will demonstrate the chrolonological evolution of AD initiations of the USA against Canada and Mexico, and also intiations of Brazil against Uruguay and Argentina under the bilateral agreements. Later on we will compare Brazil as a reporter country against its trading partners the USA and the EU without any bilaterel agreement and also with the rest of the world. ( major trading partners)
4 .1 . CUSFTA: the USA and Canada Case (the USA-AD use r)
period between 1980 and 2006. Table 4.1.A shows us the evaluation of AD investigations of the USA against Canada from 1980 to 1988 when is the negatiation date of bileteral agreement.
Table 4 .1 A.- Pe riods be fore CUSFTA (1980-1988)
Ye a r s 1 9 8 0 1 9 8 1 1 9 8 2 1 9 8 3 1 9 8 4 1 9 8 5 1 9 8 6 1 9 8 7 1 9 8 8
I n ve st iga t ion s
pe r y e a r 2 1 2 3 3 4 3 2 4
Pe r iods 1 9 8 0 - 1 9 8 8
Ave r a ge in ve st iga t ion pe r ye a r 2 .6 6
From the table, the total number of AD investigations is 24. In 1981 there is only one investigation while in 1985 and 1988 have the highest number of investigations (4 for each year). Before the CUSFTA during 1980-1988 the average AD investigation initiated per year is 2.66. Similarly table 4.1.B. demonstrates us the number of AD investigations after the biletarel agreement, the period of 1989-2006.
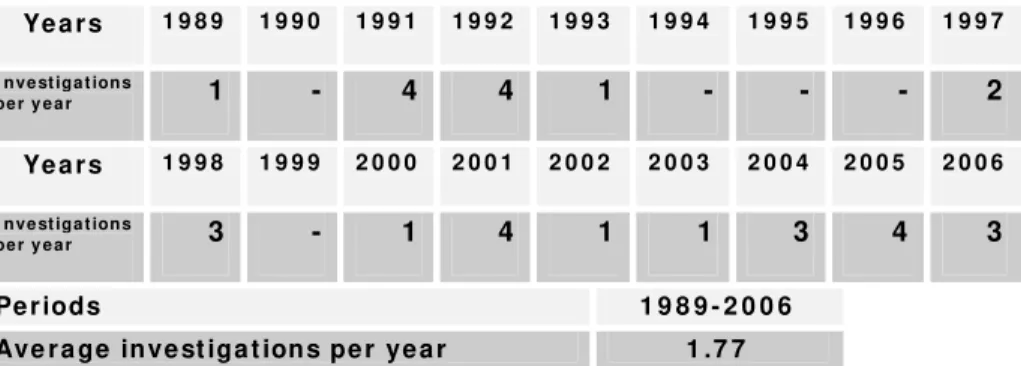
Table 4 .1 B. Pe riods afte r CUSFTA (1989-2006)
Ye a r s 1 9 8 9 1 9 9 0 1 9 9 1 1 9 9 2 1 9 9 3 1 9 9 4 1 9 9 5 1 9 9 6 1 9 9 7
I n ve st iga t ion s
pe r y e a r 1 - 4 4 1 - - - 2
Ye a r s 1 9 9 8 1 9 9 9 2 0 0 0 2 0 0 1 2 0 0 2 2 0 0 3 2 0 0 4 2 0 0 5 2 0 0 6
I n ve st iga t ion s
pe r y e a r 3 - 1 4 1 1 3 4 3
Pe r iods 1 9 8 9 - 2 0 0 6
Ave r a ge in ve st iga t ion s pe r ye a r 1 .7 7
after the negotiation, the average antidumping investigations per year against Canada diminished from 2.66 to 1.77.
4 .2 . NAFTA: the USA and Me xico Case
North American Free Trade Agreement (NAFTA) is a trilateral trade bloc in North America shaped by the governments of the United States, Canada, and Mexico. The agreement came into force on January 1, 1994. It superseded the Canada-United States Free Trade Agreement in 1988.
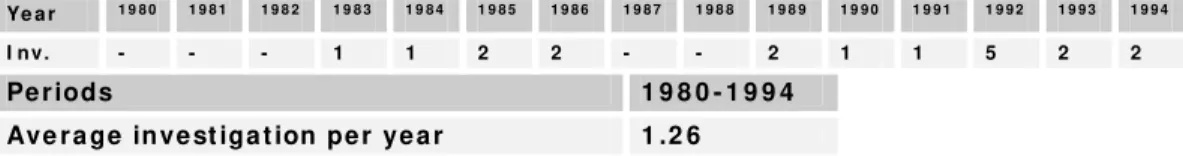
Table 4.2A. points out the AD investigations since 1980 untill the negotiation date 1994. the total number of AD investigations initiated against Mexico is 19. During 1980-1983 and 1987-1989 there are no reported AD investigations by the USA. In 1992 the highest number of initiations occur (5).
Table .4 .2 A- Pe riods be fore NAFTA (1980-1994)
Ye a r 1 9 8 0 1 9 8 1 1 9 8 2 1 9 8 3 1 9 8 4 1 9 8 5 1 9 8 6 1 9 8 7 1 9 8 8 1 9 8 9 1 9 9 0 1 9 9 1 1 9 9 2 1 9 9 3 1 9 9 4
I n v. - - - 1 1 2 2 - - 2 1 1 5 2 2
Pe r iods 1 9 8 0 - 1 9 9 4
Ave r a ge in ve st iga t ion pe r ye a r 1 .2 6
To see the path of number of AD investigations after the FTA, table 4.2.B. presents summary data of the cases in each year from 1995 to 2006.
Table 4 .2 B-Pe riods afte r NAFTA (1995-2006)
Ye a r 1 9 9 5 1 9 9 6 1 9 9 7 1 9 9 8 1 9 9 9 2 0 0 0 2 0 0 1 2 0 0 2 2 0 0 3 2 0 0 4 2 0 0 5 2 0 0 6
I n v. 1 1 - 4 2 - 3 1 1 2 5 6
Pe r iods 1 9 9 5 - 2 0 0 6
The total amount of AD investigations initiated against Mexico after 1994 is 26. In 1997 and 2000 there are not any investigations whereas in 2006 there are 6 investigations. These results present the total number of AD investigations initiated against Mexico increases after the negotiation of free trade agreement. The total antidumping cases that are initiated against Mexico has increased from 19 to 26 between the time period stated above. The average investigation per year increases from 1.26 to 2.16 after bilateral agreement. On the other hand, the cases in each year grow significantly and almost every year at least exists 1 investigation-except in 1997 and 2000 after the negotiation date.
4 .3 .The U.S. and the Re st of the World
What about the rest of the world that is trading with the USA? Do biletarel agreements effect the rest of the world? Using the required database for the USA we can state that starting from 1980 untill 1988 - the negotiation date for the CUSFTA ( Canada-USA FTA)- the total amount of AD investigations in the USA is 445. after the negotiation date to the year 2000 the total amount of AD investigations is 505. Similarly, with NAFTA from 1980 to the negotiation date the total amount of AD investigations is 761. Later, the total number of investigations is 395. However, in contrast there is a diminishing number of investigations initiated from the rest of the world, whereas there is an increasing number of investigations after the trading agreements were in enforced.
4.4. MERCOSUR: Brazil-Argentina and Uruguay Case
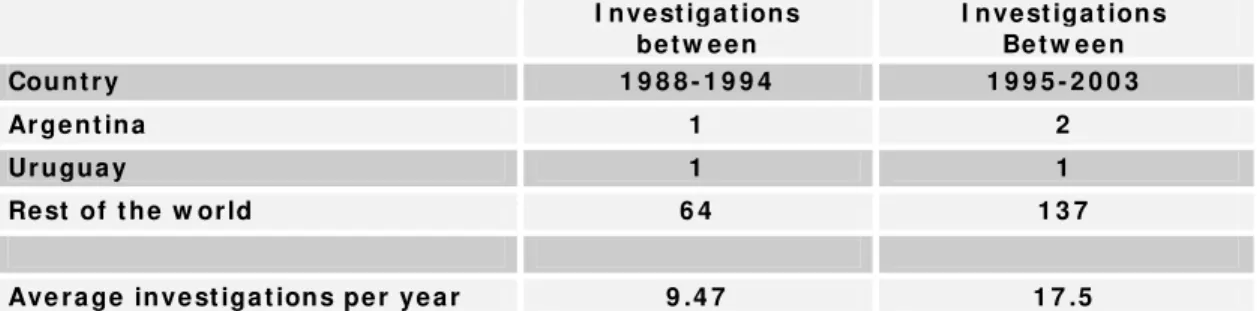
later modified and updated by the 1994 Treaty of Ouro Preto. From the available data, from 1988 to the negoatiation date 1994 there are only 2 AD investigations initated against both Argentina and Uruguay (1 initiation from each country). Later on 1995 to 2003 there are 3 initiations, 2 against Argentina and 1 against Uruguay by Brazil. However, comparing this situation with the rest of the world, there is a high increasing number of total antidumping investigations. For the period from 1988 to 1994 the total cases initiated are 64, but also the period of from 1995 to 2003 the total number of cases initiated are 137.
Table 4.4. AD inve s tig ations by Brazil afte r and be fore M ERCOSUR
I n ve st iga t ion s be t w e e n
I n ve st iga t ion s Be t w e e n
Cou n t r y 1 9 8 8 - 1 9 9 4 1 9 9 5 - 2 0 0 3
Ar ge n t in a 1 2
Ur u gu a y 1 1
Re st of t h e w or ld 6 4 1 3 7
Ave r a ge in ve st iga t ion s pe r ye a r 9 .4 7 1 7 .5
The average number of investigations initited by Brazil against the all trading partners has been increased from 9.5 to 17.5 after the MERCOSUR.
4 .5 Brazil- the EU and Brazil-the USA and the Re st of the w orld
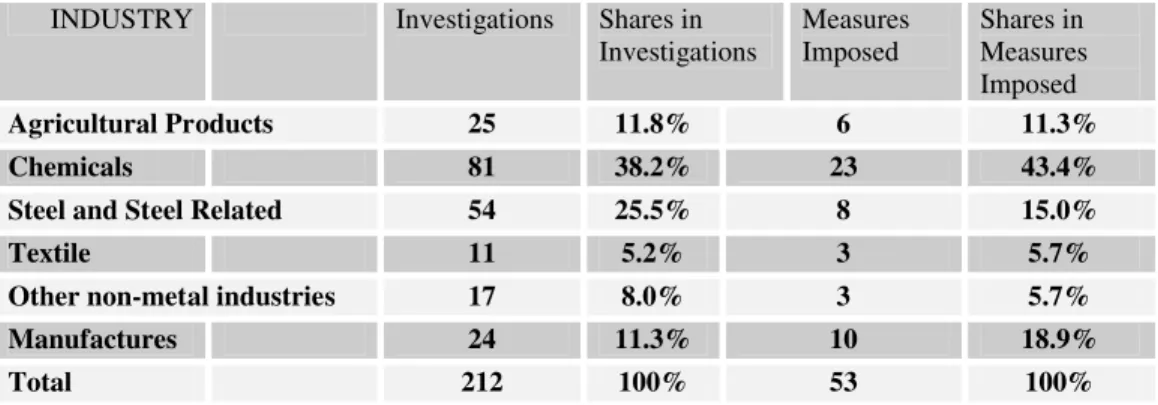
Referring to data between 1988-2003 the total number of AD investigations initiated from the EU is 25 and from the USA is 32. The most protected goods were industrial chemicals from both countries. From the necessary data in GATT for the period (1985-1994) Brazil reported 58 AD investigations on the other hand , in WTO period (1995-2004), it reported 166 AD investigations from all over the world. During the same period the total number of antidumping measures imposed was 62. Brazil is one of the most frequent AD users in the developing countries. But which industries use antidumping to pursue protection? The following table identifies the sectors targeted in the majority of Brazilian trade cases.
Table 4 .5 A- Brazil- the AD inve s tig ations and m e as ure s im pos e d from the im porte d g oods
INDUSTRY Investigations Shares in
Investigations
Measures Imposed
Shares in Measures Imposed
Agricultural Products 25 11.8% 6 11.3%
Chemicals 81 38.2% 23 43.4%
Steel and Steel Related 54 25.5% 8 15.0%
Textile 11 5.2% 3 5.7%
Other non-metal industries 17 8.0% 3 5.7%
Manufactures 24 11.3% 10 18.9%
Total 212 100% 53 100%
Source: 2003 DECOM Annual Report
Table 4 .5 B- Brazil- the AD inve s tig ations and m e as ure s im pos e d in m ajor trading partne rs
Initiations Reviews
China 21 9
India 6 5
Russia 7 3
South Africa 5 2
Mexico 4 2
Germany 4 1
Kazakhstan 3 2
Total 164 35
Source: Global Antidum ping Database
Brazil’s use of antidumping investigations increased as the country became more integrated to its trade liberalization program in the 1990s. However, compared to the United States, where almost the entirety of antidumping investigations involve the application of provisional duties, in Brazil only 46% of the cases resulting in the application of antidumping duties involved provisional measures. In sum, Brazil’s antidumping legislation and procedures are similar to that of other WTO Members (Barral- Brogini, 2005).
5. Methodology and Data
variables needed for the econometric estimation is obtained from United Nations Statistic Division- Commodity Trade Statistics Database (COMTRADE).
5.1. Econometric Model
The econometric model is constructed as follows: The dependent variable is antidumping investigations while the explanatory variables are macroeconomic trends and a dummy variable. We want to explain the initiations in a given year by the imports of a reporter country and the exports of its partner country in a given year. And also the damage to the domestic importing country and the threat of retaliation maybe important answers to this research question (Jallab, 2005). We also add a dummy variable which considers the bilateral agreements between reporter and its trading partner country. The econometric model approach uses maximum likelihood estimation.
One can demonstrate this relationship as ;
y
it
0
1tM
it
2tX
jt
3tm
it
4tx
jt
5t
itWhere; yitis the number of AD investigations initiated by country i
it
M is the imports from country jto country i
jt
X is the exports of countryi to country j
it
m is damage to domestic importing country and can be defined as;
1 1
it it it it
jt
x is potential threat to domestic exporting industry because of possible retaliation and can be defined as;
1 1
jt jt jt jt
X X X x
is the dummy variable (FTA),
it
is the standard error term.Also; i is the reporting country and j is its trading partner.
o is the constant term and 1,2,3,4,5 are the coefficients of the explanatoryvariables. It is important to mention that
y
it =0,1,2,3… is a count variable, ranging from zero to many.Hence ,count data models are commonly applied to this problem. Choice of model depends on the Poisson regression model, which assumes that
y
it is conditional upon the imports and exports, follows a Poisson distribution.In this paper; the estimations of the use of antidumping cases based on two reporting countries ,USA and Brazil respectively ,with their trading partners. First of all we estimated the case of USA-Canada and USA-Mexico under bilateral agreements, then we continued with the case of Brazil-Argentina under a bilateral agreement. In some of the estimations we add lags for both imports exports of trading countries, because the antidumping authorities frequently rely on data from the most recently completed one or two or sometimes three year period in their consideration of injury trends.
5.2. The case of USA-Canada under CUSFTA in 1988
The table A in the appendix, reports the basic estimation equation of Poisson regression model by maximum likelihood estimation. The times series show yearly antidumping investigations between 1980 to 2006. The signs of the coefficients are positive for the first lag of imports and exports and also consistent for the potential threat to the domestic exporting country whereas the signs of coefficients are negative for the constant term, the damage for the domestic importing country and the dummy variable. The predicted probability of the dummy variable is 0.018 and it is significant at 5% significance level. The coefficient of imports in the first lag is negative, which means, the injury in the industry level is caused by the imports from its trading partner. The result for the dummy variable is consistent with the theory that it is mentioned previously. After the negotiation date it is expected to have less antidumping investigations initiated from Canada. This situation can be seen from the table A in the appendix with a negative coefficient and with a significant p-value for the dummy variable, CUSFTA bilateral trade agreement.
5.3. The case of USA-Mexico under NAFTA in 1994
Table B from the appendix, it reports the estimation using the same explanatory variables for Mexico as a result of trade with the USA. The dummy variable is the NAFTA regional trade agreement.
significant, the estimation result is consistent with the theory. After the NAFTA, there are more AD investigations initiated against Mexico by the USA.
5.4.The case of Brazil-Argentina under MERCOSUR in 1994
Appendix C presents the outcomes from the regression. The FTA agreement MERCOSUR is the dummy variable of the regression. Estimation results show the only the coefficient of exports and dummy are positive. The dummy variable is not significant at any significance level. Because the number of AD investigations is only 3, hence it is not the model. The econometric estimation of the AD investigations from Argentina does not justify the empirical results demonstrated in 4.4.
6. Conclusions
The USA is still the one of the major users of antidumping between developed countries. After the negotiation date of CUSTA in 1988 with Canada and under NAFTA in 1994 with Canada and Mexico, the USA initiated more antidumping investigations against Mexico but less AD investigations against Canada. After NAFTA the USA has initiated less antidumping investigation against the rest of the world.
Brazil is the one of the major users of antidumping in recent years. Brazil´s use of antidumping measures increased as the country integrated to its trade liberalization programme in the 1990s. After MERCOSUR in 1994 between Argentina and Uruguay, Brazil initiated slightly more antidumping investigations. In recent years , most of the AD investigations were against China and Russia In Brazil the AD investigations concentrated into industries such as; chemicals, steel, agricultural products and manufactures. In Brazil only 46% of the cases resulting in the application of antidumping duties involved provisional measures.
USA. On the other hand dummy variable for Brazil and Argentina is not significant but with a positive coefficient because the number of initiations is very small.
REFERENCES
Aggarval, Aradhna. 2007. “Antidumping Protection: Who gets it? An Exploratory
Analysis of Antidumping Use in the Most Active User Countries” Centre for Trade & Development: 26-27
Barral, Welber and Brogini Gilvan. 2005. “ The Use of Antidumping in Brazil,
China, India and South Africa-Rules, Trends and Causes” Kommerskollegium National Board of Trade Sweeden: 11-25
Bloginen Bruce A. and Prusa, Thomas J. 2001. “Antidumping” NBER Working
Paper : 2-6.
Bown , Chad P. 2007. “The WTO and Antidumping in Developing Countries”
Economic and Politics: 3-27
Bown , Chad P. 2007. “Global Antidumping Database” World Bank Policy
Research Paper no.3737
Jallab, Mustapha Sadni. 2005 “Political Influence of European and American
Antidumping Decisions: Some Empirical Evidence”Economics Bulletin: 3-6
Llyod Tim and Morrissey Oliver 1998 “Estimating the Impact of Antidumping
and Anticartel Action Using Intervention Analysis” Economic Journal: 1
WTO ,1995 Agreement on Implementation of Article VI of the General Agreement on Tariffs and Trade 1994 (The “Antidumping Agreement”). WTO, Geneva.
WTO ,2005“Anti-dumping Initiations: by Reporting Member,” on-line excel
spreadsheet available ahttp://www.wto.org/english/tratop_e/adp_e/adp_stattab2_e.xls
WTO ,2005“Anti-dumping Measures: by Reporting Member,” on-line excel
spreadsheet available at
http://www.wto.org/english/tratop_e/adp_e/adp_stattab7_e.xls
United Nations Statistic Division- Commodity Trade Statistics Database
(COMTRADE),
APPENDIX-
Estimation Outcome sTABLE A
Explanatory Variables
Dependent Variable : Number of Antidumping Investigations Initiated by the USA against Canada 1980-2006
Number of Observation 16 after adjustments R –square 57%
Explanatory Variables Coefficient z-statistic p-value
Constant -6.592 -1.558 0.119
Imports in t-1 0.463 1.357 0.174
Damage to the domestic importing industry
-0.217 -0.069 0.658
Exports in t-1 0.514 1.277 0.201
Potential threat to the domestic exporting industry
0.615 0.864 0.387
Dummy -1.385 -2.357 0.0184**
LR-Statistic 6.6700
Loglikelihood -43.095
TABLE B
Explanatory Variables
Dependent Variable : Number of Antidumping Investigations Initiated by
the USA against Mexico 1980-2006 Number of Observation 14 after adjustments R –square 57%
Explanatory Variables Coefficient z-statistic p-value
Constant -1.387* -2.947 0.0032
Imports in t 0.494 0.419 0.6747
Damage to the Domestic importing industry
-0.469 -0.415 0.6776
Exports in t 0.832 0.638 0.5235
Potential threat to the Domestic exporting industry
-1.478 -1.244 0.2133
Dummy 3.330** -1.405 0.0451
LR-Statistic
11.382
Loglikelihood -22.6531
*significant at 1% significance level
TABLE C
Explanatory Variables
Dependent Variable : Number of Antidumping Investigations Initiated by the Brazil against Argentina 1988-2006
Number of Observation 19 R –square 23%
Explanatory Variables Coefficient z-statistic p-value
Constant -4.835 -0.177 0.8592
Imports -2.567 3.819 0.5016
Damage to the domestic importing industry in t
-2.500 -1.182 0.2369
Exports in t 2.858 0.936 0.3492
Potential threat to the domestic exporting country in t
0.735 1.865 0.0621***
Dummy 1.282 -0.481 0.6303
LR-Statistic