Justifying business intelligence systems adoption in SMEs:
Impact of systems use on firm performance
Aleš Popovič (Department of Business informatics and logistics, Faculty of Economics,
University of Ljubljana, Ljubljana, Slovenia) (NOVA Information Management School (NOVA IMS), Universidade Nova de Lisboa, Campus de Campolide, Lisboa, Portugal)
Borut Puklavec (Department of Information Management, Faculty of Economics, University of
Ljubljana, Ljubljana, Slovenia)
Tiago Oliveira (Department of Information Management, NOVA Information Management
School (NOVA IMS), Universidade Nova de Lisboa, Campus de Campolide, Lisboa, Portugal)
This is the author accepted manuscript version of the article published by EMERALD as:
Popovič, A., Puklavec, B., & Oliveira, T. (2019). Justifying business intelligence systems adoption in SMEs: Impact of systems use on firm performance. Industrial Management and Data Systems, 119(1), 210-228. https://doi.org/10.1108/IMDS-02-2018-0085
This work is licensed under a Creative Commons Attribution-NonCommercial 4.0 International License.
Justifying Business Intelligence Systems Adoption in SMEs:
Impact of Systems Use on Firm Performance
Abstract
To realize returns, mere use of business intelligence systems (BIS) after effective adoption is insufficient. It is essential for BIS use to also create a business value by generating an impact on firm performance. Existing BIS research merely focuses on adoption and adoption determinants, or at the most on the innovation usage as the last phase in the adoption process. In response, we developed a conceptual model for assessing the determinants of BIS impact on firm performance in SMEs. The model is based on the Diffusion of Innovation post-adoption phase of use, and the Resource-Based View, extended with our findings from the other IS/IT research literature. Our conceptual model encompasses two independent post-adoption variables of routine use and innovative use; three dependent variables of partial impacts on firm performance (impact on marketing and sales, impact on management and internal operations, impact on procurement); and an ultimate dependent variable of impact on firm performance. Drawing on the data collected from 181 small and medium enterprises (SMEs) our results provide valuable insights about how BIS usage influences firm performance, extending our understanding of this intriguing field of research. Implications of the findings are further discussed and practical implications for managers are provided.
Keywords: business intelligence systems (BIS); routine use; innovative use; firm
1. Introduction
In the literature on the business value of information technology (IT), the relationship between IT investments and their effects on firm performance continues to interest academics and practitioners (Devaraj & Kohli, 2003; Hsieh, Rai, & Xu, 2011; Liu, Ke, Wei, & Hua, 2013; Melville, Kraemer, & Gurbaxani, 2004; Schryen, 2013). Empirical evidence to unequivocally support the view that IT investments enhance firm performance has been elusive (Bharadwaj, 2000; Kohli & Grover, 2008; Nevo & Wade, 2010; Santhanam & Hartono, 2003). In enterprise-wide information systems (IS) research, the adoption, use, and value of business intelligence systems (BIS) and the link to firm performance has emerged as an active research area within the discipline (Audzeyeva & Hudson, 2015; Işık, Jones, & Sidorova, 2013; Popovič, Hackney, Coelho, & Jaklič, 2012). We define BIS as ‘quality information in well-designed data stores, coupled with software tools that provide users timely access, effective analysis and intuitive presentation of the right information, enabling them to take the right actions or make the right decision’ (Popovič et al., 2012).
Today, IS researchers still face strong pressure to answer the question of whether and how IT investments add to firm performance (Hsieh et al., 2011; Liu et al., 2013; Sabherwal & Jeyaraj, 2015). Answers to this persistent challenge have important implications for the way firms approach IT investment and management (Zhu & Kraemer, 2005). To respond to this challenge, some efforts have been devoted to studying BIS adoption and firm performance (e.g. Côrte-Real, Oliveira, & Ruivo, 2017; M. Gupta & George, 2016; Wamba et al., 2017). While these studies contributed to our understanding of BIS innovation, several gaps can be identified in the literature. To begin with, although innovation diffusion represents a complex process, much of the existing research has focused on the adoption decision (e.g. Puklavec, Oliveira, & Popovič, 2014; Yeoh & Popovič, 2016) and less on the post-adoption environment (e.g. Popovič, Hackney, Coelho, & Jaklič, 2014). In fact, prior research has shown that actual usage may be an important link to IT value, but this link seems to be missing in the literature (Devaraj & Kohli, 2003).
Next, there is a lack of empirical evidence to gauge BIS use and its impact on firm performance (Elbashir, Collier, & Davern, 2008). Extant studies have addressed this issues from various (partial) perspectives (e.g. Wamba et al., 2017), yet there is a need for a theoretically thorough and empirically relevant framework to examine the use and value of BIS in organizations.
Third, earlier research explored the BIS adoption stage and use stage in the context of large firms and called for future research to re-examine the mechanisms linking adoption and use to performance outcomes in other contexts (Li, Hsieh, & Rai, 2013; Popovič et al., 2014). We believe it is important to investigate whether prior assumptions can be generalized and empirical findings are applicable in different firm-size contexts. To achieve this, we study BIS in SME setting to encompass the experience of smaller firms that might represent different aspects of BIS use in transforming firm performance.
In summary, these gaps in the literature limit our understanding of the process of BIS use for attaining higher levels of firm performance. Our study seeks to narrow these gaps. The following research questions motivating our work are: (i) What
framework can be used as a theoretical basis for studying BIS use and firm performance? (ii) Within this theoretical framework, how can different usage behaviors affect value in the context of SMEs? (iii) How would various BIS-enabled partial impacts on firm performance then affect the overall firm performance? To
better understand these issues, from a resource-based perspective we analyzed the BIS impact on firm performance that stems from the unique characteristics of the BIS (Popovič et al., 2012). Then, an integrative model for BIS use and its impact on firm performance is developed. We tested this model using survey data from 181 SMEs. Data analysis was performed by partial least squares. The results demonstrate varied impacts of distinct usage behaviors on firm performance. These results contribute to the continued debate on IT payoffs (Davern & Kauffman, 2000; Melville et al., 2004) and their state in BIS context (Elbashir et al., 2008; Popovič, Turk, & Jaklič, 2010).
2. Theoretical framework
Firm performance denotes collective IT-enabled performance across all firm activities, with metrics capturing bottom-line firm impacts such as cost reduction, revenue enhancement, and competitive advantage (Melville et al., 2004). Prior research on the business value of enterprise-wide IT adoption has investigated the direct effect of IT implementation and use on firm performance, but rarely how this effect is realized through the partial impacts of IT use on firm performance.
2.1 Linking IS use to firm performance
The importance of the link between IS use and firm performance has long been conversed in the literature (Aral & Weill, 2007; Devaraj & Kohli, 2003; Mithas, Ramasubbu, & Sambamurthy, 2011). IS use has been proposed as a pivotal construct in the system-to-value chain that links research on IS adoption/success
with research on organizational impacts of IS (DeLone & McLean, 1992; Doll & Torkzadeh, 1998).
For IS impacts to occur, it is essential that use is tied to firm performance goals. IT use results in organizational impacts only when the suitability of the application is matched with technology (Devaraj & Kohli, 2003). Goodhue and Thompson (1995) argue that task-technology fit has to be established before IS use can produce performance impacts. Task-technology fit is achieved when the technology is compatible with the targeted application and there are skilled users who use it (Devaraj & Kohli, 2003). In our research, the importance of BIS (technology) to SMEs and the business value of the marketing, sales, internal operations, and procurement activities (tasks) mediated by IS use are steps that facilitate the BIS investment toward organizational performance outcomes. Thus, the task-technology fit suggested by Goodhue and Thompson holds true in our research setting. What is more, required specialized skills affirm that the BIS users and technology form a synergy to monitor marketing, sales, internal operations, and procurement, the key business areas that are critical to the firm’s stability and growth. Such argumentation is in line with Weill’s (1992) call to examine the steps between IS investment and the resulting performance impacts.
2.2 The importance of IS use and its distinct usage behaviors
Whereas early IS adoption stages establish indicators of initial IS success (Thong, 1999), the use stage is critical for firms to realize returns on IS investments (Bhattacherjee, 2001; Jasperson, Carter, & Zmud, 2005). According to Li et al. (2013), two distinct usage behaviors in the IS adoption use stage, namely routine use and innovative use, are vital in leveraging implemented systems and alleviating low returns on IS investments.
Routine use reflects employees’ using an IS in a routine and standardized manner to support their work. This usage behavior is repetitious and perceived as a normal part of employees’ work activities and has been standardized and incorporated into individual employees’ work processes (Li et al., 2013). Such repetitive and standardized use of a system in the IS adoption use stage aids employees develop acquaintance with the implemented system, thus facilitating IS use to be integrated in their individual work processes (Saga & Zmud, 1994). Innovative use, on the other hand, describes employees’ use of IS in novel ways to support their work, thereby realizing its further value (Li et al., 2013). In the post-acceptance stage, through accumulated experiences with the implemented IS, employees are able to apply the IS in innovative ways, thereby realizing its further value (Jasperson et al., 2005).
The main difference between the two presented usage behaviors lies in the nature of these two behaviors; namely, how the employee uses the system (Li et al., 2013). Consider a procurement analyst whose job responsibilities include evaluating suppliers, develop innovative approaches to review procurement process effectiveness, provide recommendations on all procurement related issues (e.g. plans, reports and metrics), and suggesting procurement strategies. To fulfill the assigned work, the procurement analyst is expected to use a BIS supplied with various analytical capabilities to examine data that are consolidated in a central data store (e.g. a data warehouse) and are linked to vendors, sales, inventory levels, replenishment cycles and product lead time. In this setting, routine use could refer to the analyst generating regular reports on a routine basis; by reviewing these reports, the analyst can understand current procurement performance and external conditions and then suggest modifications in procurement strategies. Moreover, if the procurement analyst believes that he or she can attain advanced insights that could not be attained via the routine use of the BIS, he or she can engage in innovative use, such as exploring new dimensions and measures from the data store, combining them across several routine reports to generate novel views of potential and established vendors or synthesizing the analysis functions used in various routine reports to analyze the data in very different manners. In effect, innovative use relates to the analyst using the BIS in fresh ways to creatively analyze data in the data store and suggest alternatives for procurement strategies. Thus, although routine use and innovative use exemplify very diverse ways of using the BIS, both usage behaviors can enable the procurement analyst to accomplish the assigned work.
According to Li et al. (2013), routine use and innovative use also differ in their learning orientation such that they bear resemblance to the twin concepts of exploitation and exploration in organizational learning research (March, 1991). We draw on learning as a supplemental theoretical lens because learning influences the utilization of existing knowledge and/or the creation of new knowledge (A. K. Gupta, Smith, & Shalley, 2006), thereby reducing barriers to assimilating IS in work processes (Robey, Ross, & Boudreau, 2002). This also responds to scholars’ call to apply the learning perspective to understand post-acceptance IS usage behaviors (Cooper & Zmud, 1990; Jasperson et al., 2005). In the organizational learning literature, exploitation refers to the utilization of existing resources and competencies, and exploration describes organizations’ experimentation with new alternatives (A. K. Gupta et al., 2006; March, 1991). Arguably, employees’ repetitive use of BIS captures the idea behind exploitation because employees’ cognition is anchored and refined with respect to standardized ways of using BIS. On the other hand, attempts at novelty are similar to exploration, which goes
beyond standardized ways of applying the BIS to support employees’ work (Jasperson et al., 2005). Compared to routine use, innovative use involves more intense learning and requires employees’ to expand their knowledge about the potential of the implemented BIS for their work.
2.3 BIS value creation
A firm’s resources and capabilities are valuable if they reduce a firm’s costs or increase its revenues compared to what would have been the case if the firm did not possess those resources (Amit & Zott, 2001). For the purpose of this work, we examine the unique characteristics of BIS (as an IT capability) and connect them in three ways through which BIS may create value for various business areas – marketing and sales, management and internal operations, and procurement. BIS are data-driven enterprise-wide decision-support systems that integrate data gathering and data storage with advanced analytical functions for decision making (Davenport, Harris, & Morison, 2010; Negash & Gray, 2008). BIS enable employees to apply a variety of analytical functions to analyze large volumes of data, which are typically drawn on or refined from data warehouses of internal and external data, and the results from these analyses are used for firms’ decision making (Li et al., 2013). According Li et al. (2013) to in the post-acceptance stage, complex organizational IS, such as BIS, can be used on a regular basis to analyze customer, product, service, and sales data; monitor competitors’ activities; and observe market conditions and trends in the industry, but may not be utilized to its fullest potential.
Benefiting from data integration and prediction capabilities, BIS can substantially improve a firm’s position in the marketplace (Chen & Siau, 2011). For instance, information richness can help capitalize on marketing investments; advanced analytical capabilities can lead to a closer match between a firm and its customers in greater reach than before; and predictive capabilities enable firms to increase their sales potential (Elbashir et al., 2008; Negash & Gray, 2008).
BIS have been also previously identified to support a wide range of internal operations aspects, such as planning, manufacturing, and quality assurance. Specifically, literature emphasizes four improvements the utilization of BIS brings to operations management. First, BIS-enabled information provides more comprehensive and accurate insights (Waller & Fawcett, 2013). Second, equipment availability for the manufacturing and logistics processes has also improved as a result of exploiting BIS (Munirathinam & Ramadoss, 2014). Third, Lee, Lapira, Bagheri, and Kao (2013) discuss the benefits of BIS use in reducing manufacturing waste, which aided the move toward lean manufacturing. Lastly, the utilization of
BIS improves insights into identification of faulty products, further preventing returns and rework (LaValle, Lesser, Shockley, Hopkins, & Kruschwitz, 2011). Furthermore, BIS value has been often emphasized in connection with procurement process as one of the firms’ key operational processes (Davenport et al., 2010; Elbashir et al., 2008). Within firms, the role of procurement has changed noticeably from that of simply buying goods and services to overseeing an integrated set of management functions. As firms look beyond short-term costs and the scope of procurement-related issues has grown, procurement professionals are paying more attention the broader costs of operating, maintaining, and replacing the items and resources they purchase over time (den Butter & Linse, 2008). BIS enables process analysts and operational managers to get a better insight into procurement processes, so they can identify process inefficiencies, as well as possibilities for improvement (Marjanovic, 2007). For example, in the case of an exception (a delay in the procurement process), using BIS will enable the procurement manager to analyze possible effects of the delay on different operational processes, so they can manage this exception.
In sum, the data integration and analytical capabilities of BIS enable BIS value creation by improving marketing and sales activities, internal operations, and assisting procurement initiatives. Such BIS value may therefore lead to improved firm performance.
2.4 Resource-based theory
The resource-based view (RBV) provides a theoretical lens for linking BIS use and value (Barney, 1991). IS scholars have drawn upon RBV has to analyze IT capabilities and to elucidate how IT value resides more in the firm’s ability to leverage IT than in the technology itself (Wade & Hulland, 2004). That is, IT business value is contingent on the breadth and depth to which IT is used in the key activities in the firm’s value chain (Zhu & Kraemer, 2005). The greater the use, the more likely the firm is to develop distinctive capabilities from its core IT infrastructure (computers, networks, databases, and communication platforms) (Zhu, 2004). The way IT infrastructure components are integrated with the business processes and are aligned with the firm’s corporate strategy is key to organizational effectiveness (Picoto, Bélanger, & Palma-dos-Reis, 2014). In fact, more consideration is given to the processes underlying the bonds proposed by RBV since the firm’s context affects the nature of its processes (Barney, Ketchen, & Wright, 2011).
Drawing upon RBV theory, technology is viewed as a key resource that could directly influence firm performance (Oh & Pinsonneault, 2007). Following this line
of thought, firms that embed BIS more broadly and deeply into their value chain activities (i.e., use BIS to a greater extent) can create superior business value from their usage of BIS. Even though BIS itself could be considered a commodity, the particular ways in which a firm assimilates this technology in its business processes is unique. Higher degrees of BIS usage will consequently be linked with firm performance improvements.
3. Research model
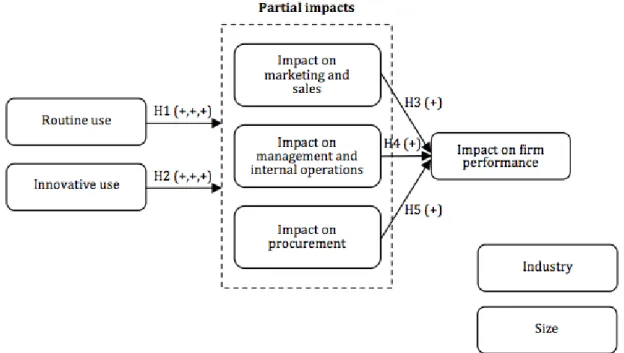
We propose a conceptual research model (shown in Figure 1) grounded on resource-based theory and diffusion of innovation theory and updated with recent findings from the literature.
According to Picoto et al. (2014), a theoretical linkage exists between innovation use and its impact on firm performance and, thus, more comprehensive innovation use elevates innovations’ impact on the sales, marketing, internal operations, and procurement dimensions of firm performance. Elbashir et al.’s (2008) identification of the BIS-supported business activities within a firm uses an industry structure perspective within a value-chain activities framework (Porter & Millar, 1985), which is broadly used for grounding the measures of technology use and performance impact (Elbashir et al., 2008). Porter and Millar (1985) group value chain activities as: (i) primary activities (i.e. sales, marketing, operations, logistics, service); and (ii) support activities (i.e. procurement, human resources, infrastructure management, development). To ensure the conciseness of this research and to be in line with recent research on the issue of IT value (e.g. Picoto et al., 2014; Zhu & Kraemer, 2005), we focus on three major organizational value chain activities, i.e. marketing and sales, management and internal operations, and procurement; and study other activities as part of these three groups of partial impacts on firm performance.
BIS that are focused on management and business processes with a substantial impact on profitability, productivity, and the quality of service are able to contribute to business performance (Popovič et al., 2010). They support improved decision-making within a wide range of business activities as they provide the capability to conduct business information analyses. Further, the incorporation of BIS into firms’ business activities creates business benefits and process enhancements which can improve organizational performance (Elbashir et al., 2008). Trkman, McCormack, de Oliveira, and Ladeira (2010) similarly reported that BIS can support processes such as plan, source, make, and deliver. In this line of research, Sharma, Mithas, and Kankanhalli (2014) suggested that there may be an indirect relationship between BIS and firm performance, noting that BIS enable
manufacturers to apply resources to undertake actions to deliver particular impacts and gains. The authors also noted the use of BIS in quality and process improvement (Teece, Pisano, & Shuen, 1997), which enhances operational performance. Based on the described BIS impact on organizational and business process performance improvements, we suggest the following hypothesis:
Hypothesis 1 (H1): Routine BIS use will positively influence all BIS partial impacts on firm performance.
Considering Po-An Hsieh and Wang (2007), extended use refers to taking advantage of additional features of the technology to support performance of a business task. Namely, a firm that adopts an IS innovation rarely routine uses the new system to its fullest potential or achieves the expected return on investment (Jasperson et al., 2005). Since the described underachievement can be linked to underutilization of the adopted IS, some studies (e.g. Po-An Hsieh & Wang, 2007) considered extended use as the use that goes beyond standard use and holds the potential to lead to enhanced results and higher returns. Also, for example, an innovative use of IT in an organization, such as BIS, may define unique IT features for the new business model in a differentiation with its competitors and further create competitive advantage to the pioneering move of IT applications (Swanson & Ramiller, 2004). Thus, we also propose:
Hypothesis 2 (H2): Innovative BIS use will positively influence all BIS partial impacts on firm performance.
Additional reasoning for the above hypothesis can be found in Zhu and Kraemer (2005) where IT business value is described as being dependent on the extent to which IT is used in the main value chain activities of the firm. In the same research, greater use is linked with a higher probability of the firm developing distinctive capabilities from its core IT infrastructure.
Further, RBV suggests that firms with a greater extent of IT use have a greater probability of creating IT capabilities that are rare, inimitable, valuable, and sustainable, thereby contributing to value creation. Deeper usage in firms leads to IT creation of specific assets and subsequently to competitive advantage (Zhu & Kraemer, 2005). Since many studies support the positive-oriented link between competitive advantage and firm performance (Majeed, 2011), and since firms mainly use IT innovation for the purpose of improving their performance (Stieglitz & Brockmann, 2012), we predict:
Hypothesis 3 (H3): Through its impact on marketing and sales BIS use has a positive impact on firm performance.
Hypothesis 4 (H4): Through its impact on management and internal operations BIS use has a positive impact on firm performance.
Hypothesis 5 (H5): Through its impact on procurement BIS use has a positive impact on firm performance.
The ultimate endogenous variable in our research is thus the impact on general organizational performance, while the partial impacts represent partial effects that BIS usage has on overall firm performance. Hence, a higher level of BIS usage will be associated with firms’ improved performance (Picoto et al., 2014).
In line with some of the preceding studies, we included size and industry dummy variables as control variables that were used to control data variation not explained by the other variables (Gu, Cao, & Duan, 2012; Popovič et al., 2014; Thong, 1999).
Figure 1: Research Model
4. Research methodology
4.1 Measurement
The constructs utilized (routine use, innovative use, impact on marketing and sales, impact on management and internal operations, impact on procurement, impact on firm performance) were based on the existing literature. Measuring applied a seven-point scale on an interval level ranging from “strongly disagree” to “strongly agree” or from “strongly insignificant” to “strongly significant”. Consistently with the respective literature, some of the constructs used were
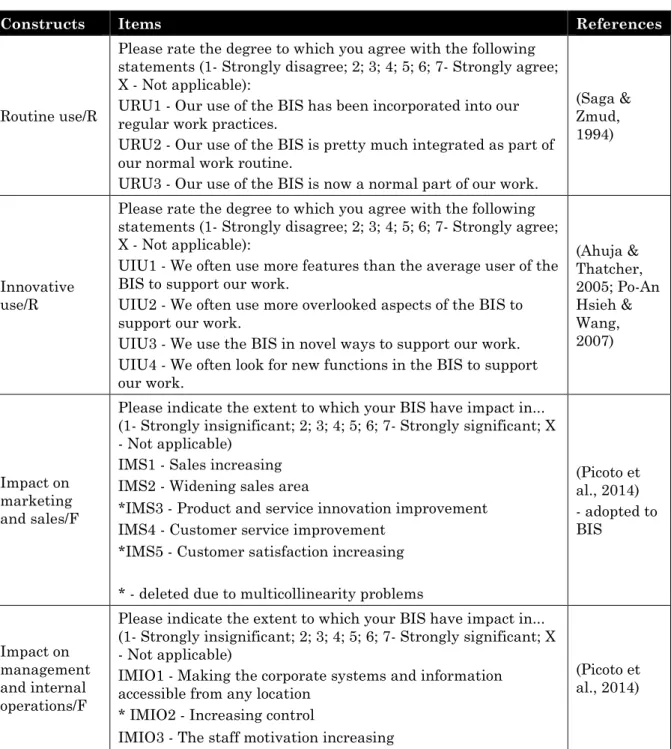
operationalized as reflective (routine use, innovative use, impact on firm performance) and others as formative (impact on marketing and sales, impact on management and internal operations, and impact on procurement) (see Table 1). Items in the questionnaire (see Table 1) were reviewed for their content validity by a group of six IS researchers and BI professionals, all appropriately familiar with BIS use and its impact on firm performance. Following their comments, some amendments to the questionnaire were made. The questionnaire was further pilot tested on 25 randomly selected SMEs from the sample frame, which confirmed its validity and reliability.
Table 1: Measurement items
Constructs Items References
Routine use/R
Please rate the degree to which you agree with the following statements (1- Strongly disagree; 2; 3; 4; 5; 6; 7- Strongly agree; X - Not applicable):
URU1 - Our use of the BIS has been incorporated into our regular work practices.
URU2 - Our use of the BIS is pretty much integrated as part of our normal work routine.
URU3 - Our use of the BIS is now a normal part of our work.
(Saga & Zmud, 1994)
Innovative use/R
Please rate the degree to which you agree with the following statements (1- Strongly disagree; 2; 3; 4; 5; 6; 7- Strongly agree; X - Not applicable):
UIU1 - We often use more features than the average user of the BIS to support our work.
UIU2 - We often use more overlooked aspects of the BIS to support our work.
UIU3 - We use the BIS in novel ways to support our work. UIU4 - We often look for new functions in the BIS to support our work. (Ahuja & Thatcher, 2005; Po-An Hsieh & Wang, 2007) Impact on marketing and sales/F
Please indicate the extent to which your BIS have impact in... (1- Strongly insignificant; 2; 3; 4; 5; 6; 7- Strongly significant; X - Not applicable)
IMS1 - Sales increasing IMS2 - Widening sales area
*IMS3 - Product and service innovation improvement IMS4 - Customer service improvement
*IMS5 - Customer satisfaction increasing
* - deleted due to multicollinearity problems
(Picoto et al., 2014) - adopted to BIS Impact on management and internal operations/F
Please indicate the extent to which your BIS have impact in... (1- Strongly insignificant; 2; 3; 4; 5; 6; 7- Strongly significant; X - Not applicable)
IMIO1 - Making the corporate systems and information accessible from any location
* IMIO2 - Increasing control
IMIO3 - The staff motivation increasing
(Picoto et al., 2014)
Constructs Items References
IMIO4 - Improving decision-making
IMIO5 - Increasing organization profitability * IMIO6 - Better information quality
IMIO7 - Making internal operations more efficient (e.g.: speed up processing, reduce bottlenecks, reduce errors, notification, control emergencies)
IMIO8 - Increasing staff productivity
* IMIO9 - Facilitating communication among employees * IMIO10 - The compression of business processes * IMIO11 - The organizational flexibility
IMIO12 - Reducing the number of employees IMIO13 - Reducing administration workload * IMIO14 - Improved employee effectiveness * IMIO15 - Improved employee learning
* - deleted due to multicollinearity problems
Impact on procurement /F
Please indicate the extent to which your BIS have impact in... (1- Strongly insignificant; 2; 3; 4; 5; 6; 7- Strongly significant; X - Not applicable)
IP1 - Inventory costs reduction
IP2 - Improving the coordination with suppliers IP3 - Decreasing the procurement costs
IP4 - Facilitate inventory management
*IP5 - Facilitating communication with suppliers
* - deleted due to multicollinearity problems
(Picoto et al., 2014)
Impact on firm
performance/R
Please rate the degree to which you agree with the following statements (1- Strongly disagree; 2; 3; 4; 5; 6; 7- Strongly agree; X - Not applicable):
IFP1 - In terms of its business impacts on the organization, the BIS has been a success.
IFP2 - BIS has seriously improved my organization's overall business performance.
IFP3* - From the perspective of my organization, the benefits of BIS outweigh the costs.
IFP4 - BIS has had a significant positive effect on my organization.
* - inversed (original: …the costs of BIS outweigh the benefits.)
(Picoto et al., 2014)
Note: F - formative; R - reflective
4.2 Data
We used an online survey service which allows online surveys to be created, executed, and briefly analyzed. To obtain a comprehensive list of survey respondents, namely firms that qualify for small or medium-sized firms according to the official country classification, we merged records from the commercial
business register with records of business entities from the database of the National Agency for Public Legal Records and Related Services. The final list provided 2,024 SMEs from various industry sectors eligible for inclusion in the study. The invitation to complete the survey was distributed by email. In order to increase the content validity, participation of the most qualified BIS person (i.e. CIO, other management, or senior IS personnel) was requested, along with a brief yet complete description of the research’s scope and importance. Once the participant firm agreed to participate in the study, a second email was sent to the participating individuals explaining the nature of the research and asking additional information about the participant. Each individual provided additional data about his position, year of employment, and experience in the field.
Data were collected in mid-2016. Over 12 weeks, a total of 181 usable responses was attained, corresponding to a response rate of 8.9%. The quite low response rate was expected since we targeted the overall SME milieu, i.e. adopters and non-adopters, regardless of how familiar an individual firm was with BIS.
In order to test for non-response bias, we compared the distributions of early and late respondents in the sample using the Kolmogorov-Smirnov test (Ryans, 1974). The sample distributions of the early and late respondents did not differ statistically (p-value > 0.10 for all variables). Accordingly, the absence of non-response bias was confirmed (Ryans, 1974).
The industry profile of the sample was as follows: 50.3% of the respondents came from the services sector, 24.3% the manufacturing industry, and 25.4% the distribution sector. The good quality of the data is indicated by the fact that the respondents were qualified individuals, predominantly CEOs.
5. Results
Smart PLS 3.0 (Ringle, Wende, & Becker, 2015) was used to test the research model. Partial least squares (PLS) represents a variance-based structural equation model (SEM) technique which is suitable for this research since (i) some items in the data are not distributed normally (p < 0.01 based on the Kolmogorov-Smirnov test); (ii) the conceptual model is considered to be complex; (iii) the model has both reflective and formative constructs; (iv) adequate sample size, i.e., for PLS estimation, the minimum sample size should be (1) ten times the large numbers of formative indicators (in our model is eight) and (2) the dependent variable with the largest numbers of independent latent variables influencing it (Peng & Lai, 2012). Before we test the structural model, we first examine the reflective part of the measurement model in order to assess the construct and indicator reliability,
internal consistency, convergent validity, and discriminant validity. In the continuance, the quality of the formative construct in the measurement model was determined through content validity (Straub, Boudreau, & Gefen, 2004), multicollinearity (Diamantopoulos & Siguaw, 2006), and weights (Chin, 1998), all described in the following sections.
5.1 Measurement model
Examination of the model is reported in Tables 2 and 3. First, we assessed the construct reliability using the composite reliability coefficient and Cronbach’s alpha. As shown in Table 2, all constructs have composite reliability (CR) and Cronbach’s alphas (CA) above 0.7, suggesting the constructs are reliable (Chau, 1999; Straub, 1989).
Indicator reliability was assessed using the criterion that the factor loadings should exceed the value of 0.7 (Henseler, Ringle, & Sinkovics, 2009). As seen in Table 2 (in bold), all loadings are above 0.7. In addition, all items are statistically significant (p < 0.01). Thus, the model shows adequate indicator reliability.
Table 2: Loadings and cross-loadings
Constructs Item URU UIU IFP
Routine use (URU)
CR=0.981; CA= 0.971; AVE=0.946
URU1 0.973 0.809 0.799 URU2 0.974 0.776 0.792 URU3 0.971 0.785 0.815
Innovative use (UIU)
CR=0.976; CA= 0.967; AVE=0.909
UIU1 0.821 0.964 0.799 UIU2 0.760 0.944 0.785 UIU3 0.777 0.964 0.804 UIU4 0.740 0.941 0.779
Impact on firm performance (IFP) CR=0.982; CA= 0.975; AVE=0.930
IFP1 0.821 0.820 0.955
IFP2 0.797 0.816 0.974
IFP3 0.768 0.783 0.956
IFP4 0.796 0.785 0.973 Note: CR – composite reliability; CA – Cronbach’s alpha; AVE – Average variance extracted In order to test the convergent validity, we used average variance extracted (AVE). As seen in Table 11, all constructs show AVE higher than 0.5, which meets the criterion that AVE should be above 0.5 so that the construct explains more than half of the variance of its indicators (Bagozzi & Yi, 1988; Henseler et al., 2009). Discriminant validity was evaluated based on the Fornell-Larcker criteria and also on cross-loadings. A Fornell-Larcker criterion suggests that the square root of AVE should be greater than the correlations between the latent variables (Fornell & Larcker, 1981). Table 3 shows that the square roots of AVEs (in bold) are greater
than the correlation between each pair of variables. The criteria of cross-loadings suggests that the loading of each factor should be greater than all cross-loadings (Götz, Liehr-Gobbers, & Krafft, 2010). As shown in Table 2, patterns of the loadings are greater than the cross-loadings. Accordingly, both criteria are fulfilled.
A condition for evaluating content validity, describing the degree to which the measured results stand for the content-semantic part of the construct, is an exact content definition of the constructs (Eckhardt, Laumer, & Weitzel, 2009). In order to ensure the content validity, our constructs were discussed with several BI professionals from the field, all appropriately familiar with BIS adoption and the operation of SMEs, and also decision-makers with adequate knowledge of BIS adoption within the firm to reliably discuss the subject (Churchill, 1979).
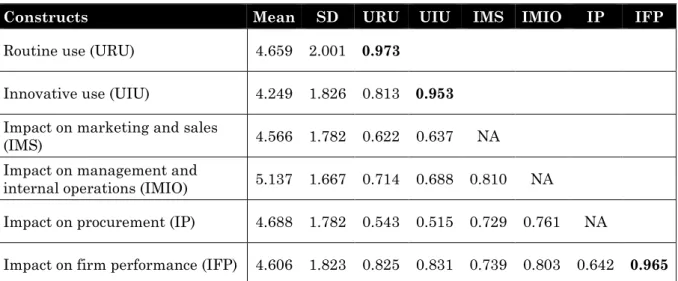
Table 3: Descriptive statistics, correlation matrix, and square root of AVEs
Constructs Mean SD URU UIU IMS IMIO IP IFP
Routine use (URU) 4.659 2.001 0.973
Innovative use (UIU) 4.249 1.826 0.813 0.953 Impact on marketing and sales
(IMS) 4.566 1.782 0.622 0.637 NA Impact on management and
internal operations (IMIO) 5.137 1.667 0.714 0.688 0.810 NA
Impact on procurement (IP) 4.688 1.782 0.543 0.515 0.729 0.761 NA
Impact on firm performance (IFP) 4.606 1.823 0.825 0.831 0.739 0.803 0.642 0.965
Note: NA: not applicable to the formative constructs; diagonal elements – square root of AVE;
off-diagonal elements – correlations
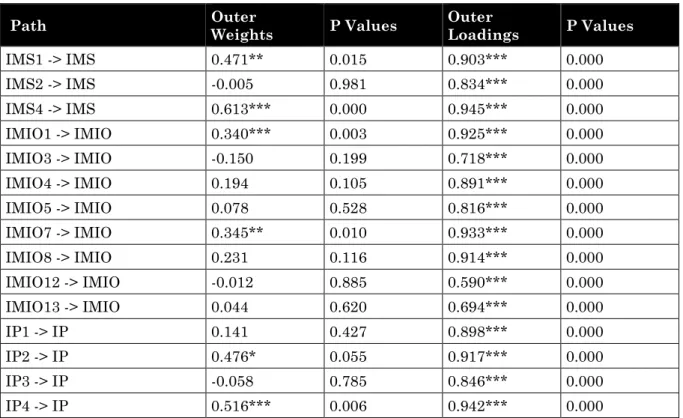
For the formative measures, the test of multicollinearity denotes that the analysis of the significance of the outer weights could be conducted as the next step since variance inflation factor (VIF) values for all indicators were below 5, meaning that collinearity does not arise as an issue (Hair Jr, Hult, Ringle, & Sarstedt, 2016). To achieve these criteria, we deleted items IMS3 and IMS5 of the construct Impact on marketing and sales; IMIO2, IMIO6, IMIO9, IMIO10, IMIO11, IMIO14, and IMIO15 of the Impact on management and internal operations; and IP5 of the Impact on procurement.
Outer weights of the construct Impact on marketing and sales were significant for two indicators; for the other indicator the outer loadings were greater than 0.5. Further, the outer weights of Impact on management and internal operations were
also significant for two indicators; for the further six indicators the outer loadings exceeded 0.5. Similarly, the outer weights of the construct Impact on procurement were significant for two indicators and for the other two indicators the outer loadings were greater than 0.5 (see Table 4). Hence, no indicator was eliminated (Hair Jr et al., 2016).
Table 4: Outer weights and loadings
Path Outer Weights P Values Outer Loadings P Values
IMS1 -> IMS 0.471** 0.015 0.903*** 0.000 IMS2 -> IMS -0.005 0.981 0.834*** 0.000 IMS4 -> IMS 0.613*** 0.000 0.945*** 0.000 IMIO1 -> IMIO 0.340*** 0.003 0.925*** 0.000 IMIO3 -> IMIO -0.150 0.199 0.718*** 0.000 IMIO4 -> IMIO 0.194 0.105 0.891*** 0.000 IMIO5 -> IMIO 0.078 0.528 0.816*** 0.000 IMIO7 -> IMIO 0.345** 0.010 0.933*** 0.000 IMIO8 -> IMIO 0.231 0.116 0.914*** 0.000 IMIO12 -> IMIO -0.012 0.885 0.590*** 0.000 IMIO13 -> IMIO 0.044 0.620 0.694*** 0.000 IP1 -> IP 0.141 0.427 0.898*** 0.000 IP2 -> IP 0.476* 0.055 0.917*** 0.000 IP3 -> IP -0.058 0.785 0.846*** 0.000 IP4 -> IP 0.516*** 0.006 0.942*** 0.000
Note: * - significance at p < 0.10; ** - significance at p < 0.05; *** - significance at p < 0.01.
Since the evaluations of construct reliability, indicator reliability, convergent validity, discriminant validity (reflective measures), and content validity, multicollinearity, and the weights (formative measures) were adequate, we may confirm the constructs are suitable for testing the conceptual model.
5.2 Structural model
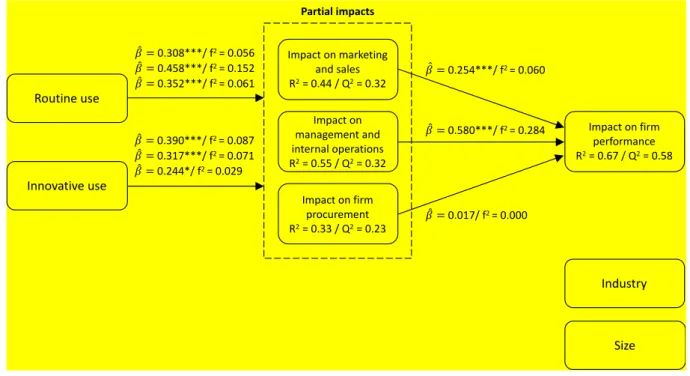
The structural model’s predictive capacity was evaluated using R2 measures
besides the level of significance of the path coefficients. The path significance levels were estimated using the bootstrapping method with 5,000 resamples (Chin, 1998; Henseler et al., 2009). Regarding the multicollinearity statistics, variance inflation factors among the constructs were all below 5, hence multicollinearity does not arise as an issue (Hair Jr et al., 2016). The results of the analysis are summarized in Figure 2, showing the path coefficients, statistical significance of the path coefficients, and the R2 of dependent variables, which are respectively 0.67, 0.44,
sales, the impact on management and internal operations, and the impact on procurement.
Figure 2: The structural model
Note: * – significance at p < 0.10; ** – significance at p < 0.05; *** – significance at p < 0.01; f2 of
0.02, 0.15, and 0.35 are interpreted as small, medium, and large effect sizes, respectively (Henseler et al., 2009); Q2 values larger than 0 suggest that the model has predictive relevance for a certain
endogenous construct (Hair Jr et al., 2016).
Regarding the use variables, the present research found that the hypothesis of routine use as a predictor of the partial BIS impacts on firm performance (H1) is supported for all three impact variables (p < 0.01). The hypothesis of innovative use as a predictor of the partial BIS impacts on firm performance (H2) is also supported for all three impact variables; specifically for the impact on marketing and sales, the impact on management and internal operations at p < 0.01, and for the impact on procurement at p < 0.10.
Within the partial impact variables, the impact on marketing and sales has significant and positive paths to the impact on firm performance (p < 0.01), so H3 is strongly supported. Equivalent strong support was identified for H4 as a path to the impact on firm performance associated with the impact on management and internal operations is significant and of a high magnitude (p < 0.01). Dissimilar results were found for the path for the impact on procurement to the impact on firm performance variable since it is insignificant (p > 0.10). Thus, H5 is not supported.
We also tested the influence of the control variables on the dependent variables. For industry, we used two dummy variables (i.e. service and distribution) and also tested for the effect of firm size. The results suggest that all control variables are statistically nonsignificant.
6. Discussion
This study offers important contributions to both research and practice. It suggests implications for the IT/IS literature, in particular for the field of BI and BIS, and proposes a validated model of BIS use impact on firm performance in SMEs.
6.1 Theoretical implications
Our study suggests that employees engage in diverse BIS usage behaviors and that routine use and innovative use require understanding with regard to their distinctions. IS use is one of the most critical elements in the causal link from IS implementation to performance and organizational success (Seddon, 1997). Prior BIS literature has commonly treated BIS use as a broad behavioral category and has examined it in the forms of duration or frequency (Popovič et al., 2012; Vukšić, Bach, & Popovič, 2013). Though these assessment approaches capture the quantity of a user’s engagement with BIS, they overlook the pluralistic nature of BIS use and do not make important qualitative distinctions between BIS behaviors. We are among the first to contrast routine and innovation behaviors in the BIS use context, which enables us to make important conceptual distinctions between routine use and innovative use in terms of their standardization or innovation orientation. The twin learning concepts of exploration and exploitation, typically studied at the organizational level, are also useful to enrich our understanding of individual level usage behaviors in that routine use and innovative use, respectively, utilize existing and create new knowledge concerning how an implemented BIS can be used by employees to support their work (A. K. Gupta et al., 2006; M. Gupta & George, 2016).
The results of our research suggest that the relationships between BIS routine use and the impact on marketing and sales, impact on management and internal operations, and impact on procurement are all positive and highly significant. This means that higher levels of routine BIS use are related with higher levels of all partial BIS impacts on firm performance, which is consistent with the RBV theory.
Similarly to routine use, innovative use also shows a positive and highly significant correlation with the impact on marketing and sales, and the impact on management and internal operations. A somewhat different relationship was found between BIS routine use and the impact on procurement, which is still significant but with a smaller impact. However, these findings are also consistent with the RBV since higher levels of innovative BIS use are related with higher levels of all partial BIS impacts on firm performance. Following the above reasoning, it can be concluded that innovative use should follow routine use in order to create an additional impact on firm performance; and that, regarding partial impacts, the focus should be on the impact on marketing and sales, and on the impact on management and internal operations.
The finding that BIS use has a greater impact on sales with marketing, and management with internal operations than on procurement is consistent with Picoto et al.’s (2014) findings that explain this outcome with the tendency of procurement personnel to work in a traditional environment as opposed to sales or support personnel. Extending this reasoning, we propose that a partial cause for this can also be found in the need for sales personnel to act more innovatively as they are often more exposed to a highly competitive business environment.
Further, our results indicate that the relationship between the impact on marketing and sales, and the impact on firm performance is positive and of a high magnitude. The same results were found for the linkage between the impact on management and internal operations and the impact on firm performance, while the linkage between the impact on procurement and the impact on firm performance is nonsignificant. The overarching purpose of the procurement function lies in value creation aimed at supporting firm performance (Pearcy & Dobrzykowski, 2012). Recently, value creation hinges on a firm’s capability to collaborate and share information with suppliers and customers (Callaway & Dobrzykowski, 2009; Vargo, Maglio, & Akaka, 2008). While such collaborative exchanges would seem to be conventional wisdom as a means to create value in procurement, many firms struggle to achieve success in this regard (Muylle & Vereecke, 2006), even through the use of BIS.
Last but not least, our model shows that BIS partial impacts on firm performance explain a considerably large share of the impacts of BIS on the overall variance in firm performance, where R2 is 0.67. With this result, we can confirm that by using
a BIS routine and/or innovative way the impact on firm performance among SMEs can be influenced in the general sense.
Our research also carries important insights for SME organizational decision-makers, IT solution providers, and IT specialists. We generally confirm Picoto et al.’s (2014) view that when making innovation investment decisions firms need to consider the value creation of an innovation. Our research offers them a list of metrics which can be used to assess their own BIS innovations.
Managers should recognize that employees can use implemented BIS in diverse ways: (1) employees may use BIS in a repetitive and standardized manner, or (2) employees may take initiatives to apply BIS in a novel fashion and engage in innovative use. As these BIS usage behaviors differ in the employees’ orientation in how the implemented system is to be used to achieve work objectives, managers should pay attention to the quality of BIS use above and beyond the quantity of BIS use (e.g., time and frequency) (Boudreau & Sligman, 2007; Po-An Hsieh & Wang, 2007). SME decision-makers who want to improve their firm’s performance should consider the adoption and (innovative) use of the BIS since there is a considerable possibility that, after using BIS, their firm performance will actually improve. SME decision-makers should also focus on fostering BIS use primarily in the business areas of marketing, sales, management, and internal operations and not in the area of procurement because it is fairly possible that by using BIS in the procurement area the firm performance will not increase. We further advise firms that, in order to maximize their business value by using BIS, they should not stop using BIS in the standard way. By expanding BIS use to include innovative ways, they can create additional value.
In relation to BIS solution providers, they should focus their promotional activities on sales personnel and management rather than on procurement personnel since they can ensure the value of the BIS better by supporting sales/marketing, internal operations, and management activities than by supporting procurement. Solution providers that are often also supporters of the adopted BIS should also foster use of the BIS. Although the firm performance of their SME customers can already be improved by using BIS in the standard way, they should stimulate and support the use of BIS at the level of innovative use as it is only then that the potential of the BIS will be considerably exploited, while the solution provider’s business references will grow.
Despite its theoretical and practical contributions, our study carries some limitations and opens avenues for future research. First, our work was geographically limited and included grouped categories of BIS partial impacts on firm performance. Future work could use the proposed research model to replicate BIS use and impact on firm performance within other environments (e.g. different firm-size segments, across other countries) to advance our understanding of the
impact of BIS on firm performance while broadening the value aspects presented above. Future research could also include adoption/use determinants in the model to identify the antecedents of usage and broaden the overall picture of this phenomenon. Finally, we encourage scholars to develop similar models for other IS/IT innovations and test them in various environments.
7. Conclusions
This study explored how post-adoption use of BIS affects the partial BIS impacts on firm performance in the SME milieu. Drawing on the Resource-Based Theory and other IT literature led to the development of the research hypotheses and a conceptual framework that explicates these relationships in the BIS context. We conducted an empirical study among small and medium firms to test the research model and hypotheses.
The results of this study indicate that BIS usage has a positive and significant correlation with the partial impacts on firm performance, and that the partial BIS impacts on firm performance explain a considerably large share of the impacts of BIS use on the variance in overall firm performance.
Our study contributes to our understanding of how BIS impact firm performance at the firm level in the SME milieu as to the best of our knowledge no present study has examined this phenomenon in this manner. Moreover, this research provides a reliable and valid instrument for predicting the impact of BIS on firm performance as a result of BIS usage. While most of the prior studies merely focus on use of the innovation, our research analyzes BIS use effects on firm performance. Finally, by examining routine use and innovative use individually, we provide a broader understanding of the post-adoption phenomenon of innovation usage.
This study represents important progress in our theoretical understanding of the role of BIS routine and innovative usage across different BIS partial impacts on firm performance dimensions, i.e. the impact on marketing and sales, the impact on management and internal operations, and the impact on procurement. The results also provide instrumental insights for managers and solution providers to help them understand the influence of various determinants to more effectively conclude the post-adoption process in SMEs. We hope this work inspires future attempts to elaborate on our findings.
Ahuja, M. K., & Thatcher, J. B. (2005). Moving beyond intentions and toward the theory of trying: effects of work environment and gender on post-adoption information technology use. MIS Quarterly, 29(3), 427-459.
Amit, R., & Zott, C. (2001). Value creation in E-business. Strategic Management
Journal, 22(6-7), 493-520. doi:10.1002/smj.187
Aral, S., & Weill, P. (2007). IT Assets, Organizational Capabilities, and Firm Performance: How Resource Allocations and Organizational Differences Explain Performance Variation. Organization Science, 18(5), 763-780. doi:10.1287/orsc.1070.0306
Audzeyeva, A., & Hudson, R. (2015). How to get the most from a business intelligence application during the post implementation phase? Deep structure transformation at a U.K. retail bank. European Journal of
Information Systems, In Press. doi:10.1057/ejis.2014.44
Bagozzi, R. P., & Yi, Y. (1988). On the evaluation of structural equation models.
Journal of the Academy of Marketing Science, 16(1), 74-94.
doi:10.1007/bf02723327
Barney, J. (1991). Firm Resources and Sustained Competitive Advantage. Journal
of Management, 17(1), 99-120. doi:10.1177/014920639101700108
Barney, J., Ketchen, D. J., & Wright, M. (2011). The Future of Resource-Based Theory: Revitalization or Decline? Journal of Management.
doi:10.1177/0149206310391805
Bharadwaj, A. S. (2000). A Resource-Based Perspective on Information Technology Capability and Firm Performance: An Empirical Investigation. MIS
Quarterly, 24(1), 169-196. doi:10.2307/3250983
Bhattacherjee, A. (2001). Understanding Information Systems Continuance: An Expectation-Confirmation Model. MIS Quarterly, 25(3), 351-370. doi:10.2307/3250921
Boudreau, M.-C., & Sligman, L. (2007). Quality of Use of a Complex Technology: A Learning-Based Model. In M. A. Mahmood (Ed.), Contemporary Issues in
End User Computing.
Callaway, S. K., & Dobrzykowski, D. D. (2009). Service-Oriented Entrepreneurship: Service-Dominant Logic in Green Design and Healthcare. Service Science, 1(4), 225-240. doi:10.1287/serv.1.4.225
Chau, P. Y. K. (1999). On the use of construct reliability in MIS research: a meta-analysis. Information & Management, 35(4), 217-227. doi:10.1016/s0378-7206(98)00089-5
Chen, X., & Siau, K. (2011). Impact of Business Intelligence and IT Infrastructure
flexibility on Competitive Performance: An Organizational Agility Perspective. Paper presented at the 32nd Infernational Conference on
Information Systems, Shanghai, China.
Chin, W. W. (1998). The partial least squares approach to structural equation modeling. Modern methods for business research, 295(2), 295-336.
Churchill, G. A. (1979). A Paradigm for Developing Better Measures of Marketing Constructs. Journal of Marketing Research, 16(1). doi:10.2307/3150876 Cooper, R. B., & Zmud, R. W. (1990). Information Technology Implementation
Research: A Technological Diffusion Approach. Management Science, 36(2), 123-139. doi:10.1287/mnsc.36.2.123
Côrte-Real, N., Oliveira, T., & Ruivo, P. (2017). Assessing business value of Big Data Analytics in European firms. Journal of Business Research, 70, 379-390. doi:10.1016/j.jbusres.2016.08.011
Davenport, T. H., Harris, J. G., & Morison, R. (2010). Analytics at Work: Smarter
Decisions, Better Results. Boston, Massachusetts: Harvard Business School
Publishing.
Davern, M. J., & Kauffman, R. J. (2000). Discovering Potential and Realizing Value from Information Technology Investments. Journal of Management
Information Systems, 16(4), 121-143.
DeLone, W. H., & McLean, E. R. (1992). Information Systems Success: The Quest for the Dependent Variable. Information Systems Research, 3(1), 60-95. doi:10.1287/isre.3.1.60
den Butter, F. A., & Linse, K. A. (2008). Rethinking procurement in the era of globalization. MIT Sloan Management Review, 50(1), 76.
Devaraj, S., & Kohli, R. (2003). Performance Impacts of Information Technology: Is Actual Usage the Missing Link? Management Science, 49(3), 273-289. doi:10.1287/mnsc.49.3.273.12736
Diamantopoulos, A., & Siguaw, J. A. (2006). Formative Versus Reflective Indicators in Organizational Measure Development: A Comparison and Empirical Illustration. British Journal of Management, 17(4), 263-282. doi:10.1111/j.1467-8551.2006.00500.x
Doll, W. J., & Torkzadeh, G. (1998). Developing a multidimensional measure of system-use in an organizational context. Information & Management, 33(4), 171-185. doi:10.1016/S0378-7206(98)00028-7
Eckhardt, A., Laumer, S., & Weitzel, T. (2009). Who influences whom? Analyzing workplace referents' social influence on IT adoption and non-adoption.
Journal of Information Technology, 24(1), 11-24. doi:10.1057/jit.2008.31
Elbashir, M. Z., Collier, P. A., & Davern, M. J. (2008). Measuring the effects of business intelligence systems: The relationship between business process and organizational performance. International Journal of Accounting
Information Systems, 9(3), 135-153. doi:10.1016/j.accinf.2008.03.001
Fornell, C., & Larcker, D. F. (1981). Evaluating Structural Equation Models with Unobservable Variables and Measurement Error. Journal of Marketing
Research, 18(1). doi:10.2307/3151312
Goodhue, D. L., & Thompson, R. L. (1995). Task-Technology Fit and Individual Performance. MIS Quarterly, 19(2), 213-236. doi:10.2307/249689
Götz, O., Liehr-Gobbers, K., & Krafft, M. (2010). Evaluation of structural equation models using the partial least squares (PLS) approach Handbook of partial
least squares (pp. 691-711): Springer.
Gu, V. C., Cao, Q., & Duan, W. (2012). Unified Modeling Language (UML) IT adoption — A holistic model of organizational capabilities perspective.
Decision Support Systems, 54(1), 257-269. doi:10.1016/j.dss.2012.05.034
Gupta, A. K., Smith, K. G., & Shalley, C. E. (2006). The Interplay between Exploration and Exploitation. The Academy of Management Journal, 49(4), 693-706. doi:10.2307/20159793
Gupta, M., & George, J. F. (2016). Toward the development of a big data analytics capability. Information & Management, 53(8), 1049-1064. doi:10.1016/j.im.2016.07.004
Hair Jr, J. F., Hult, G. T. M., Ringle, C., & Sarstedt, M. (2016). A primer on partial
least squares structural equation modeling (PLS-SEM): Sage Publications.
Henseler, J., Ringle, C. M., & Sinkovics, R. R. (2009). The use of partial least squares path modeling in international marketing New Challenges to
International Marketing (Vol. 20, pp. 277-319): Emerald Group Publishing
Limited.
Hsieh, J. J. P.-A., Rai, A., & Xu, S. X. (2011). Extracting Business Value from IT: A Sensemaking Perspective of Post-Adoptive Use. Management Science,
57(11), 2018-2039. doi:10.1287/mnsc.1110.1398
Işık, Ö., Jones, M. C., & Sidorova, A. (2013). Business intelligence success: The roles of BI capabilities and decision environments. Information &
Management, 50(1), 13-23. doi:10.1016/j.im.2012.12.001
Jasperson, J., Carter, P. E., & Zmud, R. W. (2005). A Comprehensive Conceptualization of Post-Adoptive Behaviors Associated with Information Technology Enabled Work Systems. MIS Quarterly, 29(3), 525-557.
Kohli, R., & Grover, V. (2008). Business Value of IT: An Essay on Expanding Research Directions to Keep up with the Times. Journal of the Association
for Information Systems, 9(1), 23-39.
LaValle, S., Lesser, E., Shockley, R., Hopkins, M. S., & Kruschwitz, N. (2011). Big Data, Analytics and the Path From Insights to Value. MIT Sloan
Management Review, 52(2), 21-32.
Lee, J., Lapira, E., Bagheri, B., & Kao, H.-a. (2013). Recent advances and trends in predictive manufacturing systems in big data environment.
Manufacturing Letters, 1(1), 38-41. doi:10.1016/j.mfglet.2013.09.005
Li, X., Hsieh, J. J. P.-A., & Rai, A. (2013). Motivational Differences Across Post-Acceptance Information System Usage Behaviors: An Investigation in the Business Intelligence Systems Context. Information Systems Research,
24(3), 659-682. doi:10.1287/isre.1120.0456
Liu, H., Ke, W., Wei, K. K., & Hua, Z. (2013). The impact of IT capabilities on firm performance: The mediating roles of absorptive capacity and supply chain agility. Decision Support Systems, 54(3), 1452-1462. doi:10.1016/j.dss.2012.12.016
Majeed, S. (2011). The impact of competitive advantage on organizational performance. European Journal of Business and Management, 3(4), 191-196.
March, J. G. (1991). Exploration and Exploitation in Organizational Learning.
Organization Science, 2(1), 71-87.
Marjanovic, O. (2007). The next stage of operational business intelligence: Creating
new challenges for business process management. Paper presented at the
System Sciences, 2007. HICSS 2007. 40th Annual Hawaii International Conference on.
Melville, N., Kraemer, K., & Gurbaxani, V. (2004). Review: Information Technology and Organizational Performance: An Integrative Model of IT Business Value. MIS Quarterly, 28(2), 283-322.
Mithas, S., Ramasubbu, N., & Sambamurthy, V. (2011). How Information Management Capability Influences Firm Performance. MIS Quarterly,
Munirathinam, S., & Ramadoss, B. (2014). Big data predictive analtyics for
proactive semiconductor equipment maintenance. Paper presented at the
IEEE International Conference on Big Data.
Muylle, S., & Vereecke, A. (2006). Performance improvement through supply chain collaboration in Europe. International Journal of Operations & Production
Management, 26(11), 1176-1198. doi:10.1108/01443570610705818
Negash, S., & Gray, P. (2008). Business Intelligence. In F. Burstein & C. W. Holsapple (Eds.), Handbook on Decision Support Systems 2 (pp. 175-193). Berlin Heidelberg: Springer
Nevo, S., & Wade, M. R. (2010). The Formation and Value of IT-Enabled Resources: Antecedents and Consequences of Synergistic Relationships. MIS Quarterly,
34(1), 163-183.
Oh, W., & Pinsonneault, A. (2007). On the Assessment of the Strategic Value of Information Technologies: Conceptual and Analytical Approaches. MIS
Quarterly, 31(2), 239-265.
Pearcy, D. H., & Dobrzykowski, D. D. (2012). A service-dominant logic analysis of fair trade procurement management. International Journal of Procurement
Management, 5(4). doi:10.1504/ijpm.2012.047203
Peng, D. X., & Lai, F. (2012). Using partial least squares in operations management research: A practical guideline and summary of past research.
Journal of Operations Management, 30(6), 467-480.
doi:10.1016/j.jom.2012.06.002
Picoto, W. N., Bélanger, F., & Palma-dos-Reis, A. (2014). An organizational perspective on m-business: usage factors and value determination.
European Journal of Information Systems, 23(5), 571-592. doi:10.1057/ejis.2014.15
Po-An Hsieh, J. J., & Wang, W. (2007). Explaining employees' Extended Use of complex information systems. European Journal of Information Systems,
16(3), 216-227. doi:10.1057/palgrave.ejis.3000663
Popovič, A., Hackney, R., Coelho, P. S., & Jaklič, J. (2012). Towards business intelligence systems success: Effects of maturity and culture on analytical decision making. Decision Support Systems, 54(1), 729-739. doi:10.1016/j.dss.2012.08.017
Popovič, A., Hackney, R., Coelho, P. S., & Jaklič, J. (2014). How information-sharing values influence the use of information systems: An investigation in the business intelligence systems context. The Journal of Strategic
Information Systems, 23(4), 270-283. doi:10.1016/j.jsis.2014.08.003
Popovič, A., Turk, T., & Jaklič, J. (2010). Conceptual Model of Business Value of Business Intelligence Systems. Management, 15(1), 5-30.
Porter, M. E., & Millar, V. E. (1985). How information gives you competitive advantage: Harvard Business Review, Reprint Service Watertown, Massachusetts, USA.
Puklavec, B., Oliveira, T., & Popovič, A. (2014). Unpacking Business Intelligence Systems Adoption Determinants: An Exploratory Study of Small and Medium Enterprises. Economic and Business Review, 16(2), 185-213. Ringle, C. M., Wende, S., & Becker, J.-M. (2015). SmartPLS 3. Boenningstedt:
Robey, D., Ross, J. W., & Boudreau, M.-C. (2002). Learning to Implement Enterprise Systems: An Exploratory Study of the Dialectics of Change.
Journal of Management Information Systems, 19(1), 17-46. doi:10.1080/07421222.2002.11045713
Ryans, A. B. (1974). Estimating Consumer Preferences for a New Durable Brand in an Established Product Class. Journal of Marketing Research, 11(4). doi:10.2307/3151290
Sabherwal, R., & Jeyaraj, A. (2015). Information Technology Impacts on Firm Performance: An Extension of Kohli and Devaraj (2003). MIS Quarterly,
39(4), 809-836.
Saga, V. L., & Zmud, R. W. (1994). The nature and determinants of IT acceptance, routinization, and infusion. In L. Levine (Ed.), Diffusion, Transfer and
Implementation of Information Technology (pp. 67-86). Amsterdam:
North-Holland.
Santhanam, R., & Hartono, E. (2003). Issues in Linking Information Technology Capability to Firm Performance. MIS Quarterly, 27(1), 125-153.
Schryen, G. (2013). Revisiting IS business value research: what we already know, what we still need to know, and how we can get there. European Journal of
Information Systems, 22(2), 139-169. doi:10.1057/ejis.2012.45
Seddon, P. B. (1997). A Respecification and Extension of the DeLone and McLean Model of IS Success. Information Systems Research, 8(3), 240-253.
Sharma, R., Mithas, S., & Kankanhalli, A. (2014). Transforming decision-making processes: a research agenda for understanding the impact of business analytics on organisations. European Journal of Information Systems, 23(4), 433-441.
Stieglitz, S., & Brockmann, T. (2012). Increasing organizational performance by transforming into a mobile enterprise. MIS Quarterly Executive, 11(4). Straub, D. (1989). Validating Instruments in MIS Research. MIS Quarterly, 13(2).
doi:10.2307/248922
Straub, D., Boudreau, M.-C., & Gefen, D. (2004). Validation guidelines for IS positivist research. The Communications of the Association for Information
Systems, 13(1), 63.
Swanson, E. B., & Ramiller, N. C. (2004). Innovating Mindfully with Information Technology. MIS Quarterly, 28(4), 553-583. doi:10.2307/25148655
Teece, D. J., Pisano, G., & Shuen, A. (1997). Dynamic capabilities and strategic management. Strategic Management Journal, 18(7), 509-533.
Thong, J. Y. L. (1999). An Integrated Model of Information Systems Adoption in Small Businesses. Journal of Management Information Systems, 15(4), 187-214. doi:10.1080/07421222.1999.11518227
Trkman, P., McCormack, K., de Oliveira, M. P. V., & Ladeira, M. B. (2010). The impact of business analytics on supply chain performance. Decision Support
Systems, 49(3), 318-327. doi:https://doi.org/10.1016/j.dss.2010.03.007
Vargo, S. L., Maglio, P. P., & Akaka, M. A. (2008). On value and value co-creation: A service systems and service logic perspective. European Management
Journal, 26(3), 145-152. doi:https://doi.org/10.1016/j.emj.2008.04.003
Vukšić, V. B., Bach, M. P., & Popovič, A. (2013). Supporting performance management with business process management and business intelligence: A case analysis of integration and orchestration. International Journal of