Tools for Planning, Deployment and Assessment
Marco Manso1, Mourad Bezzeghoud2 and Bento Caldeira21Instituto de Ciências da Terra, Universidade de Évora, Évora, Portugal
2Departamento de Física, Escola de Ciências e Tecnologia da Universidade de Évora, Évora, Portugal
Keywords: Seismic Network, Sensor Network, Seismology.
Abstract: The rapid technological evolution in sensors, sensor platforms and networking is enabling the deployment of large sensor networks for "live" monitoring of seismic activity with high spatial resolution. In this regard, this paper describes our work in developing an online "High Throughput Seismic Sensor Network". We present the architecture and implementation comprising seismic sensors and servers (running data collection services) connected through internet-enabled technologies. We validate and assess the system, as well as identify bottlenecks, by means of experimentation. Based on the collected empirical data, we were able to identify methods and tools to support effective planning and implementation of sensor networks based on two main indicators: Sensor Network Transmission Rate (SNTR), which provides the overall network sensor data transmission throughput and thus an indication of the required network capacity; and CPU Sensor Network Performance Index (CSNPI), which provides an indication of a server capability to handle network sensor data. As we progress in our work to field deploy seismic sensor networks, we will continue to use these tools to plan and deploy future sensor networks, as well as assess improvements and modifications along the way.
1 INTRODUCTION
The technology applied to sensors and sensor platforms has evolved in a strong and fast pace over the last years, resulting in increased performance, reduced energy consumption, improved connectivity, miniaturization and reduced cost. These innovations bring to scientific communities and experimenters promising prospects such as the deployment of large sensor networks for "live" (online and real-time) monitoring of seismic activity with high spatial resolution. Simultaneously, when considering the implementation of such networks that often require high data throughput, it becomes critical to address questions such as: What is the sensor network throughput and expected network load? What is the system required capacity to process all sensor data?
In this paper we present our work towards deploying an online "High Throughput Seismic Sensor Network" comprising several seismic sensors (real and simulated) and data collection services, all
of them connected using internet-enabled technologies. This paper is structured as follows: in section 2 we present related past and on-going work in this field; in section 3 we present our design and implementation (including equipment selection) of the system; in section 4 we describe experiments conducted with the aim to assess and validate the design and gather empirical data allowing to address the presented key questions and create methods and tools to support future planning decisions and assess improvements and modifications along the way; section 5 concludes the paper.
2 BACKGROUND
The deployment of large scale high density sensor networks aims to bring to the field of seismology high resolution geo-referenced measurements: in 2001 and 2002, the California Institute of Technology (CalTech) deployed more than 5200 low-cost stations with an average spacing close to
Manso M., Bezzeghoud M. and Caldeira B.
Design and Evaluation of a High Throughput Seismic Sensor Network - Tools for Planning, Deployment and Assessment.
100m with the purpose to better define the Long Beach Oil Field (Lin et al, 2013; Inbal et al, 2015); in addition, CalTech's established the Community Seismic Network (CSN), an earthquake monitoring system based on a dense array of low-cost acceleration sensors (more than 1000) aiming to produce block-by-block measurements of strong shaking during an earthquake (http://csn.caltech.edu/about/); the University of Southern California's (USC) Quake-Catcher Network (QCN) (Clayton et al, 2011) began rolling out in the San Francisco Bay Area comprising 6000 tiny sensors, being part of the densest networks of seismic sensors ever devoted to studying earthquakes (Science 2.0). These networks allowed measuring seismic activity with high resolution that, by correlating the signal with time and space, allowed, for example, producing "shake maps" directly from observations. High-density sensor networks can be relevant to other fields as well. Indeed, studies have taken place to demonstrate the detection of important geospatial events such as earthquakes and hazardous radiation, where sensor data correlation improved data quality and brought additional insights (Liu, 2013).
Inspired by these efforts, we leverage on recent technological developments to realise a "High Throughput Seismic Sensor Network" comprising a large number of sensors capable of autonomous operation (i.e., do not require a computer or an external device to collect and transmit data), network using Internet-based technologies and be affordable (sensor cost inferior to €40). Affordability was proven by our first fully functional sensor prototype, presented in (Manso et al, 2016), that had a cost below €25.
3 DESIGN
AND
IMPLEMENTATION
In this section we present the system design of the seismic sensor network, that mainly comprises a
Sensor Platform component (to measure the
variable(s) of interest and transmit data), a Server component (to collect, store, process and visualise sensor data) and the Network component (to enable data exchange between sensors and server(s)). A large number of sensors is expected to be deployed. As such, a server cluster implementation is envisaged to ensure scalability and distribute load over multiple processors and computers.
Ultimately, system resources (sensors and servers) will be accessible globally over the World Wide Web (i.e., Internet) relying on many of the latter's components (e.g., routers and gateways). It is not the scope of this work to describe these thus, for simplicity purposes, the Internet and its components are treated as means to exchange information and are depicted as a cloud. It is also assumed that sensors are able to connect to servers. A general view of the system is presented in Figure 1. The sensor and server components are described next.
Figure 1: Seismic Monitoring System: General View.
3.1 Sensor
Component
The sensor component purpose is to measure a physical quantity of interest, that, in our case is ground motion and transmit the output variable associated to the measure. Following the general design in (Manso et al, 2016), the selected elements constituting the sensor component are presented in Table 1.
Table 1: Sensor Implementation.
Element Architecture Component as in (Manso et al, 2016)
ESP8266 (ESP-01 model)
Acquisition and Processing Board (32-bit processor at 80MHz); Storage (on-chip SRAM); Networking (Wi-Fi)
MPU-6050 Sensor: 3-axis 16-bit accelerometer (0.06mg resolution at 2g) Up to 200Hz measurement frequency Internal clock synchronised with NTP Real-Time Clock 3.3v Power Supply Board Power Supply
I2C Bus Data Interface (connecting the
ESP8266 to the MPU-6050)
The ESP8266 is selected because it provides a fast and programmable microcontroller, embedded
Server (Cluster)
Subnet (Internet)Network
Sensor Platform SUBNET Sensor PlatformSensor PlatformSensor Platform Sensor PlatformSensor PlatformSensor PlatformSensor Platform Router Router Server Server Server Server SUBNET
Wi-Fi capabilities and support of a wide range of libraries (via the Arduino community).
Time synchronisation is achieved by means of Network Time Protocol (provided by the server component running its own NTP server). NTP can keep time accuracy of all machines within the same subnet within one millisecond (NTP, 2003), which suffices for our application scenario.
For sensor measurement purposes, we use a 3-axis accelerometer. We select the low cost MPU-6050 because it provides a good resolution (16-bit), high frequency measurements (up to 200Hz) and incorporates an internal FIFO allowing to store up to 170 measurements. The FIFO also allows decoupling the sensing cycle (running in the MPU-6050) from the main processing and networking cycles (running in the ESP8266) reducing the risk of missing sensor samples. The MPU-6050 is categorized as Class-C (resolution from about 12 to 16 bits, typically over 2g ranges) that have found applications in generating reliable pictures of regional seismicity and strong shaking (Evans et al, 2014).
3.2 Server
Component
The implemented server component collects and stores data received from sensors. It also runs a NTP server allowing to synchronize sensors.
The server runs an HTTP server that can be accessed by sensors over a local network or the Internet and used to send measured data. The server code is implemented in node.js since its event-driven and non-blocking I/O model delivers high performance and scalability. It is also highly integrated with Internet-based technologies and supports multi-core technology.
Two server platforms will be implemented. Their main characteristics are presented in Table 2.
Table 2: Server Implementations.
Server Main Characteristics
Server PC (ServerPC)
Intel Core 2 Duo 64-bit (dual core) 2.33GHz
Built-in Ethernet
OS: Ubuntu Server 16.04.1 LTS (Xenial Xerus, Linux Kernel 4.4) 64-bit
Raspberry Pi 3 (Raspi3)
CPU: ARMv8 64-bit quad-core 1.2GHz
Built-in Ethernet
OS: Raspian (Debian Jessie, Linux Kernel 4.4) 32-bit
3.3 Server-Sensor
Communications
The communications between sensors and server(s) fully rely on Internet-base technologies. The base protocol will be the ubiquitous Internet Protocol (IP). Considering the need to support a high sensor throughput, which produces measurements with a frequency up to 200Hz, the websocket protocol (Fette and Melnikov, 2011) is selected due to its capability to handle high data throughput and its easy integration with Internet-based technologies.4 EXPERIMENT
In this section we describe a set of experiments conducted to assess the network system based on collected empirical data. The derived analysis and observations allow developing methods and tools to support planning and design of future deployments.
4.1 Setup
We are interested in evaluating the system comprising sensors exhibiting high data throughput (up to 200Hz sensor data frequency, i.e., the highest frequency of the selected accelerometer).
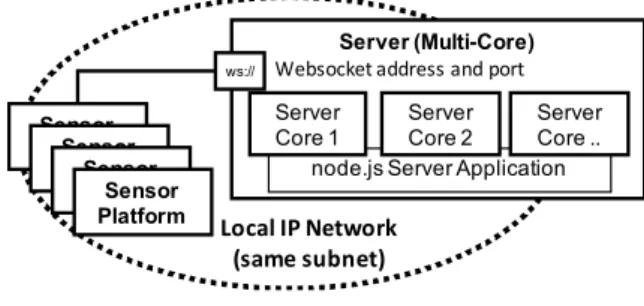
The experiment setup is depicted in Figure 2. In this setting, all components are part of the same local network. Multiple sensors are deployed. The server component is accessible via the websocket protocol. To collect sensor data, the server runs a node.js application that is capable to distribute, as needed, sensor requests across all available CPU cores (i.e., load balancing), thus fully exploiting its processing capabilities.
Figure 2: Experiment Setup.
The sensors used in this experiment are simulated and mimic the actual throughput of the sensor component described in Table 1.
Subnet Server (Multi-Core) LocalIPNetwork (samesubnet) Sensor PlatformSensor PlatformSensor PlatformSensor Platform
Websocketaddressandport
ws://
node.js Server Application Server Core 1 Server Core 2 Server Core ..
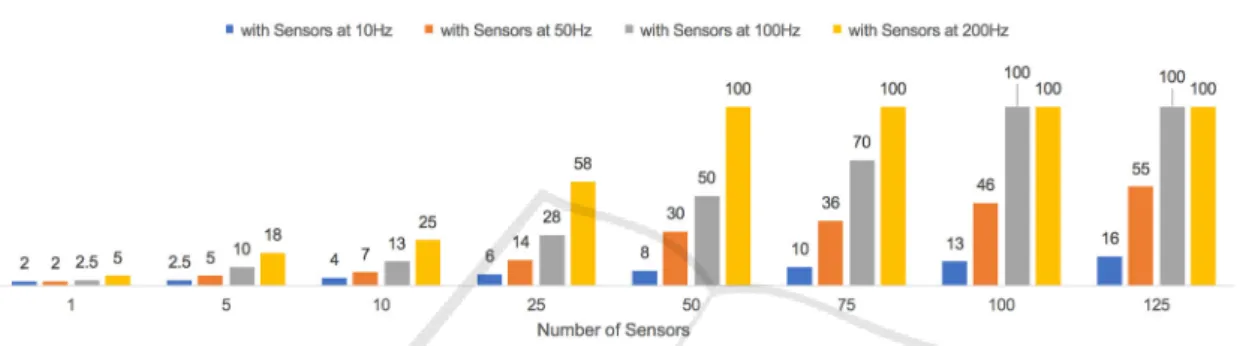
Figure 3: Network Transmission Rate measured per number of sensors per frequency. It is important to note that measurements pertaining to 100 and 150 sensors at 200Hz and 150 sensors at 100Hz were obtained using formula (1).
Figure 4: ServerPC Performance measured based on the percentage of CPU allocated to process sensors' requests.
4.2 Measurements
4.2.1 Network Transmission Rate
We start by measuring the actual network transmission rate as a function of the number of sensors and their measurement frequency. For this purpose, we used the "System Monitor" tool provided by Ubuntu, thus these measurements are only approximate and are presented in Figure 3. As expected, the transmission rate increases proportionally with the number of sensors and their frequency. This relation can be approximately described and generalised according to formula (1).
SNTR = SMsgSize x SFreq(sensor)
All sensors (1)
Where:
• SNTR (Sensor Network Transmission Rate) is the amount of data (in KiB) transmitted per second.
• SMsgSize is the size (in KiB) required to transmit a single sensor measurement. It also includes protocol overheads (in our case, 0.14KiB per message).
• SFreq(sensor) is the measuring frequency (in Hz) of the respective sensor.
It can be verified that the formula provides predictions that are close to the measured values, as exemplified below:
• 10 sensors at 10Hz produce 13KiB/s against 14KiB/s given by the formula;
• 75 sensors at 200Hz produce 2050KiB/s against 2100KiB/s given by the formula;
• 100 sensors at 200Hz produce 2080KiB/s against 2800 KiB/s given by the formula;
• 10 sensors at 100Hz produce 124KiB/s against 140 KiB/s given by the formula
• 25 sensors at 200Hz produce 760KBi/s against 700KiB/s given by the formula.
The SNTR is useful to determine the server workload (as presented next) and the network capacity requirements.
4.2.2 Server Performance
The server performance is assessed based on the percentage of CPU (%CPU) allocated to process all sensors' request, which varies according to the number of sensors and their sample frequency (both used to determine the SNTR). The lower the %CPU the better is the server performance. Average
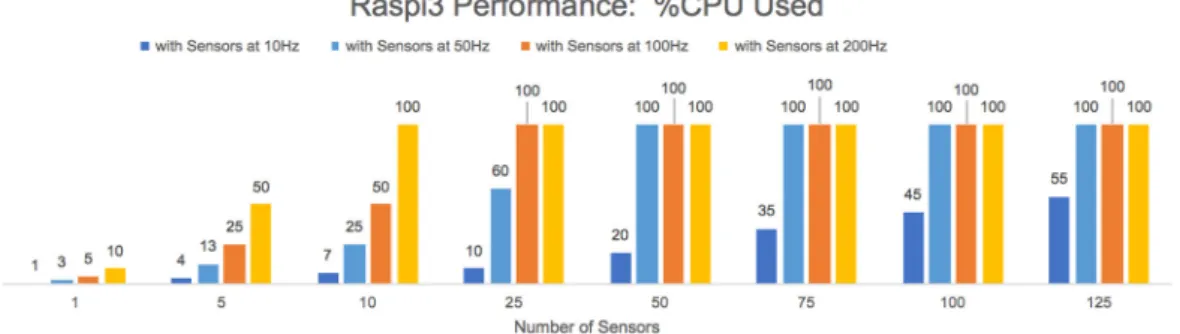
Figure 5: Raspi3 Performance measured based on the percentage of CPU allocated to process sensors' requests.
Figure 6: Example of CPU Usage Provided by Top in Raspberry Pi 3.
allocations above 60% should be avoided to ensure a
healthy server.
We present in Figure 6 an example visualisation of the %CPU allocation provided by the top application running on the Raspi3. It is visible the 4 instances of
nodejs handling sensor requests. At the moment the
snapshot was taken, the overall CPU usage was 22.3% CPU. Note that applications not related with the monitoring system also consume resources (top included).
Next, we present measurements for the two server platforms we selected.
(a) ServerPC Performance
The ServerPC performance measurements are presented in Figure 4. As expected, increasing the number of sensors and/or sensors' frequency increases the %CPU. Based on the performance measurements, we see that the relation is proportional and can be approximately described according to the following formula:
CPU_Load = SNTR
1310 x 100% (2) Where:
• CPU_Load is the percentage of CPU (%CPU) allocated to process all sensors' request.
• SNTR is described in (1).
• 1310 is the value that characterises this server capability to handle network sensor data (units are KiB/s). We name this value the "CPU Sensor Network Performance Index" (CSNPI). From Figure 4, the recommended maximum number of connected sensors to a single ServerPC (i.e., %CPU less than 60%) are 25, 50 and 125 if, respectively, a frequency of 200Hz, 100Hz and 50Hz are used. Adapting formula (2) to (2.1), we can infer that a single ServerPC may support in good
health about 560 homogeneous sensors at 10Hz. nrecommended = CPU_Loadrecommended x 1310
SMsgSize x SFreq x 100 (2.1)
Where nrecommended is the maximum number of
sensors recommended.
(b) Raspi3 Performance
The Raspi3 performance measurements are presented in Figure 5.
Similar to the ServerPC, a relation can be established and described according to formula (2), however with the CSNPI that characterises the specific platform, obtained from the performance measurements. The formula for the Raspi3 is presented in (3).
CPU_Load = SNTR
280 x 100% (3) The variables in (3) are the same as in (2). Note that the Raspi3 CSNPI value is almost 5 times smaller than the ServerPC CSNPI, thus one can conclude that it copes with 5 times less sensors.
From Figure 5 the recommended maximum number of connected sensors to a single Raspi3 are 5, 10 and 25 and 125 if, respectively, a frequency of 200Hz, 100Hz, 50Hz and 10Hz are used.
(c) Generalisation
The formula to determine the expected server CPU load when handling an arbitrary number of sensors (exhibiting a known SNTR) is presented in (4), which is a generalisation from (2) and (3).
CPU_Load = SNTR
CSNPI x 100% (4)
The CSNPI value can be determined for any server platform and, as demonstrated herein, is a useful tool to assist the design of a network involving a high number of high-throughput sensors and servers, providing a method to determine the recommended (and highest) number of connected sensors a server (or a cluster of servers) can support, based on a sensors message size and frequency.
5 CONCLUSIONS
In this paper we presented our work towards deploying an online "High Throughput Seismic Sensor Network". An architecture has been described comprising seismic sensors and servers (running data collection services) connected through internet-enabled technologies. Experiments were conducted that successfully validated the design across different system configurations, as well as identify its limitations. The experiments also gathered important empirical data that allowed us to create methods and tools to support future planning decisions towards deploying real sensor networks. For this purpose, two network-related indicators are proposed:
• Sensor Network Transmission Rate (SNTR), which provides the overall network sensor data transmission throughput and thus an indication of the required network capacity. • CPU Sensor Network Performance Index (CSNPI), which provides an indication of a server capability to handle network sensor data.
Based on these indicators, we are now able to determine the recommended number of sensors to deploy based on network and server capabilities. Conversely, we can also determine the network and server requirements based on the number of sensors we aim to deploy.
Our next steps include the evaluation of the sensor network capability to respond to seismic events and their field deployment involving a large number of components (thus a high network throughput is expected). Thus we will rely on the above tools for proper planning and implementation.
Furthermore, we will use these tools and methods to measure and empirically validate the effects of system- and component-level improvements (such as message compression to reduce size, use more efficient communications protocols, modify network protocol parameters, incorporation of message brokers). System- and component-level improvements will be addressed in future work.
REFERENCES
Clayton, R., Heaton, T., Chandy, M., Krause A., Kohler, M., Bunn J., Guy, R., Olson, M., Faulkner, M., Cheng, M., Strand, L., Chandy, R., Obenshain, D., Liu, A., Aivazis, M., 2011. Community Seismic Network. Annals of Geophysics, 54, 6.
Evans, J., Allen, R., Chung, A., Cochran, E., Guy, R., Hellweg, M., and Lawrence, J., 2014. Performance of
Several Low-Cost Accelerometers. Seismological
Research Letters, 85(1). pp. 147-158.
Fette, I., Melnikov, A., 2011. RFC 6455 - The WebSocket
Protocol. Internet Engineering Task Force.
Inbal, A., Clayton, R., and Ampuero, J., 2015. Mapping
Active Faults in Long Beach, California Using a Dense Seismic Array. Geophysical Research Letters,
42, 6314-6323.
Lin, Fan-Chi, Li, D., Clayton, R., Hollis D., 2013.
High-resolution shallow crustal structure in Long Beach, California: application of ambient noise tomography on a dense seismic array. Geophysics, 78(4),
Q45-Q56.
Liu, A., 2013. Sensor Networks for Geospatial Event
Detection — Theory and Applications. PhD Thesis.
California Institute of Technology.
Manso M., Bezzeghoud, M., Borges, J. and Caldeira, B., 2016. Low-Power Low-Cost Sensor Platform for
Seismic and Environmental Monitoring. 9th
Spanish-Portuguese Assembly of Geodesy and Geophysics, Madrid, Spain, 28th to 30th June.
NTP (2003). The NTP Public Services Project. Available at: http://www.ntp.org/ntpfaq/NTP-s-algo.htm. (Accessed: 5 September 2016).
Science 2.0 (2011) Quake Catcher Network - Citizen
Science Tackles Seismology. Available at:
http://www.science20.com/news_articles/quake_catch er_network_citizen_science_tackles_seismology-80887. (Accessed: 29 January 2016).