Previous studies9 have indicated the viability of using kaolin processing waste for the production of ceramic bricks. However, these studies have proved to be economically unviable. Thus, there is a need to find solutions enabling kaolin processing waste to be incorporated into products of higher added value. In this respect, incorporation of wastes in mullite-based ceramics is being sought and is of high commercial interest10-13.
Mullite (3Al2O3.2SiO2), is the only stable compound of the SiO2-Al2O3 binary system under atmospheric pressure, is widely used in conventional and advanced ceramics because of its high melting point, low coefficient of thermal expansion, excellent creep resistance, good chemical stability and high strength at high temperature11,13,14.
In the development and manufacture of ceramics using waste materials, the properties of fired bodies are basically determined by the combination of raw materials and process parameters. When the processing conditions are kept constant, a number of properties of dried and fired bodies are basically determined by the combination (or mixture) of raw materials15. This is the basic assumption in the statistical design of mixture experiments to obtain a response sur-face using mathematical and statistical techniques16,17. To this end, it is necessary first to select the appropriate mixtures from which the response surface might be calculated. Then, form the calculated response surface, the property value of any mixture can be predicted based on the changes in the proportions of its components18,19. *e-mail: [email protected]
Statistical Design for Recycling Kaolin Processing Waste
in the Manufacturing of Mullite-Based Ceramics
Romualdo Rodrigues Menezes*, Maria Isabel Brasileiro, Wherllyson Patricio Gonçalves,
Lisiane Navarro de Lima Santana, Gelmires Araújo Neves,
Heber Sivini Ferreira, Heber Carlos Ferreira
Unidade Acadêmica de Engenharia de Materiais, Universidade Federal de Campina Grande,
Av. Aprígio Veloso, 882, 58109-970 Campina Grande - PB, Brazil
Received: January 15, 2009; Revised: March 17, 2009
Mineral extraction and processing industries have been cited as sources of environmental contamination and pollution. However, waste recycling represents an alternative recovery option, which is interesting from an environmental and economic standpoint. In this work, recycling of kaolin processing waste in the manufacture of mullite-based ceramics was investigated based on the statistical design of mixture experiments methodology. Ten formulations using kaolin processing waste, alumina and ball clay were used in the experiment design. Test specimens were fired and characterized to determine their water absorption and modulus of rupture. Regression models were calculated, relating the properties with the composition. The significance and validity of the models were confirmed through statistical analysis and verification experiments. The regression models were used to analyze the influence of waste content on the properties of the fired bodies. The results indicated that the statistical design of mixture experiments methodology can be successfully used to optimize formulations containing large amount of wastes.
Keywords: recycling, waste materials, design of mixture experiments, mullite
1. Introduction
Natural raw materials are becoming scarce, while around the world, millions of tons of inorganic wastes are produced everyday in mining, mineral processing and industrial activities, whose disposal is subject to ever stricter environmental legislation. However, some wastes are similar in composition to the natural raw materials used in the fabrication of ceramics and often contain materials that are also beneficial in the fabrication process. Thus, upgrading wastes to alternative raw materials is of technological, economic and environ-mental interest1-3.
Mining and mineral processing wastes have traditionally been discarded in landfills and often dumped directly into ecosystems without adequate treatment. However, possible reuse or recycling alternatives should be investigated and implemented3-5. Today, the reuse and recycling of wastes after their potentialities have been detected is considered an activity that can contribute to reduce production costs, provide alternative raw materials for a variety of industrial sectors, conserve nonrenewable resources, save energy, and improve public health6-8.
to be investigated. Mixtures with the selected compositions were processed as follows: wet mixing/milling (using ball mill), drying (24 hours), de-agglomerated (by gently grinding in a mortar), mois-turizing (6.5 wt. (%), dry basis) and granulation. Test specimens (50 x 20 x 5 mm) were obtained by uniaxial pressing under 35 MPa, and were sintered in a laboratory furnace at 1300 and 1400 °C for 2 hours in air, at a heating rate of 5 °C/min, followed by natural cool-ing. Three independent batches (replications) of each composition were prepared and processed.
The water absorption (WA) was determined using the Archimedes liquid displacement method by immersion in water for 24 hours. The fire modulus of rupture (MR) was determined in a three-point-bending test, with a 0.5 mm/min cross-head using the test specimens (50 x 20 x 5 mm).
The results of the three replications were used to calculate the coefficients of the regression equations iteratively until statistically relevant models and response surfaces were obtained, relating the WA and MR with the proportions of waste and commercial raw materi-als used in the formulations. The calculations were carried out with Statistica 6.0 (StatSoft Inc., 2001) software.
The resulting statistical analysis involves fitting of mathemati-cal equations to the experimental results (i.e., water absorption and modulus of rupture) to get the entire response surface, and validation of the model through an analysis of variance.
X ray diffraction patterns of the fired bodies were obtained in an X ray diffractomer (Shimadzu, XRD 7000) using Cu Ka radiation. Diffraction patterns were recorded for the 2θ range 10-70°.
3. Results and Discussion
Table 2 list the compositions of the 10 mixtures (Mi, i = 1, 2,..., 10), while Table 3 presents the measured values of water absorption (WA) and modulus of rupture (MR) of the fired test specimens.
Based on the data obtained (Table 3), regression equations were designed for the properties analyzed at 1300 and 1400 °C, with a 5% level of significance. Equation (1) to (4) describe the behavior of the properties in response to the proportions of raw materials. Statistically these equations were found to be the most adequate (5% significance level).
WA1300°C = 9.57A + 5.79B + 2.03K + 9.37AB + 4.42BK +
85.30ABK – 23.03 AK(A – K) (1)
This methodology has found important applications in various areas, and is becoming popular in the field of glasses and ceramics15,20-24.
Current optimization procedures for developing ceramic composi-tions using waste materials are based mainly on experiments rather than on a comprehensive approach. In general, the approach consists of selecting and testing a first trial batch, evaluating the results, and then adjusting the mixture proportions and testing further mixtures until the required properties are achieved. The conventional method of optimization is time consuming and does not allow for detection of the global optimum, especially due to the interactions among the factors. In contrast, statistical design methods are rigorous techniques not only for achieving desired properties but also for establishing an optimized mixture for a given constraint while minimizing the number of trials25,26.
Statistical experimental design methodology is an established and proven methodology16,17, but no researchers have reported using this technique in the research of recycling of mining and mineral wastes for the production of ceramic materials. Thus, this work aims to study the recycling of kaolin processing waste in the manufacture of mullite-based ceramics using the statistical design of mixture experiments methodology.
2. Materials and Methods
The waste investigated here was obtained from the second step of primary kaolin processing. The waste was dried at 110 °C, dry milled in a ball mill and sieved through a 150 µm mesh. The other raw materials used in this research were ball clay (Armil Minerios, Brazil – D10 of about 0.8 µm, D50 of about 2.0 µm and D90 of about 5.0 µm) and alumina (A1000SG, Alcoa Industrial, Chemicals Divi-sion – D10 of about 0.3 µm, D50 of about 0.6 µm and D90 of about 1.9 µm). These commercial materials were used in the as-received condition. Table 1 presents the chemical composition of the raw materials, determined by wet process.
Physical and chemical characterizations of kaolin process-ing waste are described elsewhere27,28. According to those reports, kaolin waste is composed of kaolinite (Al2Si2O5(OH)4), mica (KAl2(Si3Al) O10(OH,F)2) and quartz (SiO2) and has a particle size distribution with a mean value of 54 µm and a D50 of 58 µm, a D10 of about 5 µm and a D90 of about 135 µm.
A {3,2} centroid simplex-lattice design, augmented with interior points, was used to define the mixtures of raw materials
Table 1. Chemical compositiona (wt. (%)) of the wastes and commercial raw materials used.
Material SiO2 Al2O3 Fe2O3 K2O TiO2 CaO Na2O LOIb
Kaolin waste 52.68 33.57 0.93 5.72 0.12 - 0.08 6.75
Ball clay 56.29 27.10 1.60 0.18 0.70 - 0.09 14.02
Alumina 00.03 99.80 0.02 - - 0.02 0.03
-a) Determined by wet chemical analysis; and b) Loss on Ignition.
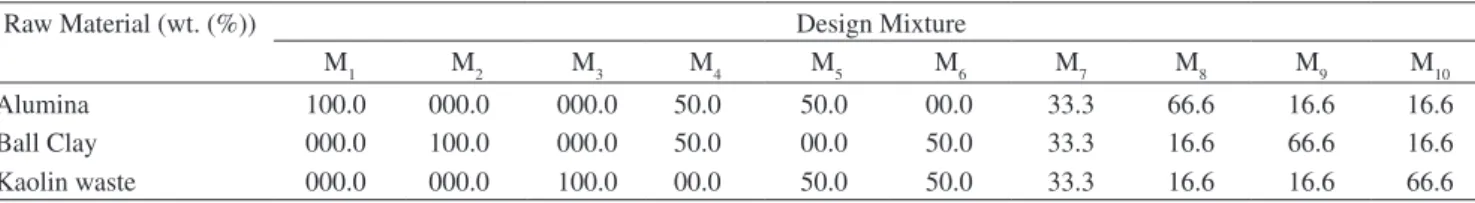
Table 2. Compositions of the design mixtures created by the augmented {3,2} simplex.
Raw Material (wt. (%)) Design Mixture
M1 M2 M3 M4 M5 M6 M7 M8 M9 M10
Alumina 100.0 000.0 000.0 50.0 50.0 00.0 33.3 66.6 16.6 16.6
Ball Clay 000.0 100.0 000.0 50.0 00.0 50.0 33.3 16.6 66.6 16.6
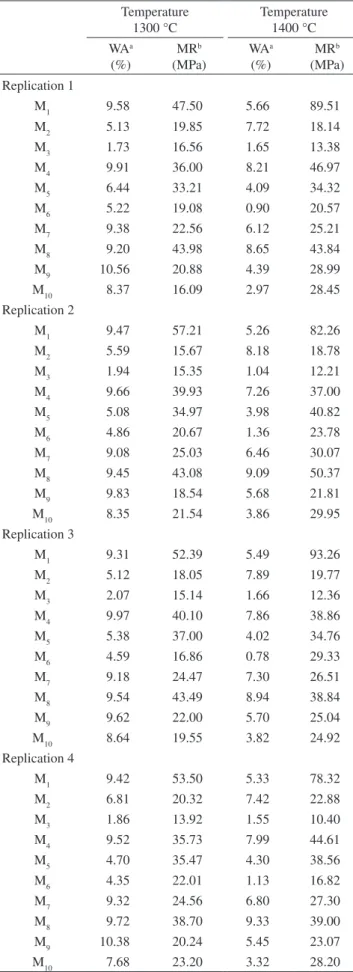
Table 3. Measured values of water absorption and modulus of rupture obtained for the 10 simplex mixtures.
Temperature 1300 °C
Temperature 1400 °C WAa
(%)
MRb (MPa)
WAa (%)
MRb (MPa) Replication 1
M1 9.58 47.50 5.66 89.51
M2 5.13 19.85 7.72 18.14
M3 1.73 16.56 1.65 13.38
M4 9.91 36.00 8.21 46.97
M5 6.44 33.21 4.09 34.32
M6 5.22 19.08 0.90 20.57
M7 9.38 22.56 6.12 25.21
M8 9.20 43.98 8.65 43.84
M9 10.56 20.88 4.39 28.99
M10 8.37 16.09 2.97 28.45
Replication 2
M1 9.47 57.21 5.26 82.26
M2 5.59 15.67 8.18 18.78
M3 1.94 15.35 1.04 12.21
M4 9.66 39.93 7.26 37.00
M5 5.08 34.97 3.98 40.82
M6 4.86 20.67 1.36 23.78
M7 9.08 25.03 6.46 30.07
M8 9.45 43.08 9.09 50.37
M9 9.83 18.54 5.68 21.81
M10 8.35 21.54 3.86 29.95
Replication 3
M1 9.31 52.39 5.49 93.26
M2 5.12 18.05 7.89 19.77
M3 2.07 15.14 1.66 12.36
M4 9.97 40.10 7.86 38.86
M5 5.38 37.00 4.02 34.76
M6 4.59 16.86 0.78 29.33
M7 9.18 24.47 7.30 26.51
M8 9.54 43.49 8.94 38.84
M9 9.62 22.00 5.70 25.04
M10 8.64 19.55 3.82 24.92
Replication 4
M1 9.42 53.50 5.33 78.32
M2 6.81 20.32 7.42 22.88
M3 1.86 13.92 1.55 10.40
M4 9.52 35.73 7.99 44.61
M5 4.70 35.47 4.30 38.56
M6 4.35 22.01 1.13 16.82
M7 9.32 24.56 6.80 27.30
M8 9.72 38.70 9.33 39.00
M9 10.38 20.24 5.45 23.07
M10 7.68 23.20 3.32 28.20
a) Water absorption, and b)Modulos of rupture.
WA1400°C = 5.46A + 7.83B + 1.50K + 4.97AB + 2.69AK –
14.26BK + 30.07AB(A – B) (2)
MR1300°C = 52.69A + 18.51B + 15.28K – 195.05ABK +
42.10AB(A – B) (3)
MR1400°C = 85.87A + 19.92B + 12.12K – 43.89AB – 47.25AK +
26.68BK – 139.24AK(A – K) (4)
Equations (1) to (4) are referred to the raw materials used; A, B and K are the fractions of alumina, ball clay and kaolin waste, respectively. Table 4 lists the main statistical properties of the regres-sions obtained with the analysis of variance, using the nomenclature commonly reported in the literature16,17. All the regression models employed (Equations (1) to (4)) were found to be statistically signifi-cant at the required level (p valor below the significance level) and to present little variability (high coefficients of multiple determination). The coefficients of multiple determination indicate the percentage of variation in the response, which is explained by the deliberate varia-tion in the factors (raw materials fracvaria-tions) during the course of the experiment29.
The significance of the derived models can also be evaluated by comparing the F test value to the F value tabulated in Fisher-Snedecor distribution16,17. The regression is considered statistically significant, i.e., the fluctuations due to the independent variables are mainly explained by the model, if the F value is greater than the tabulated value (for the required significance level). All the F values presented in Table 4 are more than fivefold higher than the tabulated values.
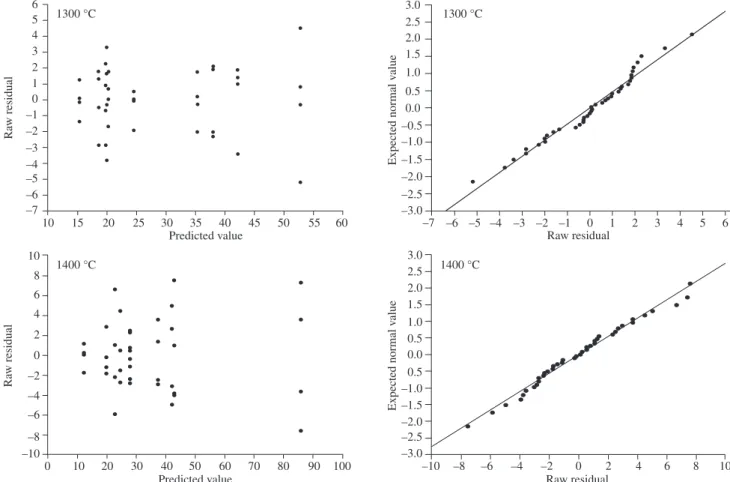
To evaluate the adequateness of the regression models also requires analyzing the residuals. Figures 1 and 2 present the plot of properties (WA and MR) raw residuals vs. predicted values and nor-mal probability curves for property residuals after firing at 1300 and 1400 °C. The raw residual is the difference between the experimen-tally determined value and the calculated estimate21. The plots of raw residuals vs. predicted values (Figures 1 and 2) show that the error values can be considered randomly distributed around a mean zero value (i.e. they are uncorrelated), which suggests a common constant variance for all the property values at the two temperatures. Straight lines can be considered to correlate the expected normal values with the raw residuals, indicating that the distribution of residuals is nor-mal. Thus, Table 4 and Figures 1 and 2 suggest that the regression model equations are adequate to predict the behavior of the properties of the fired ceramic bodies to a very high degree of confidence.
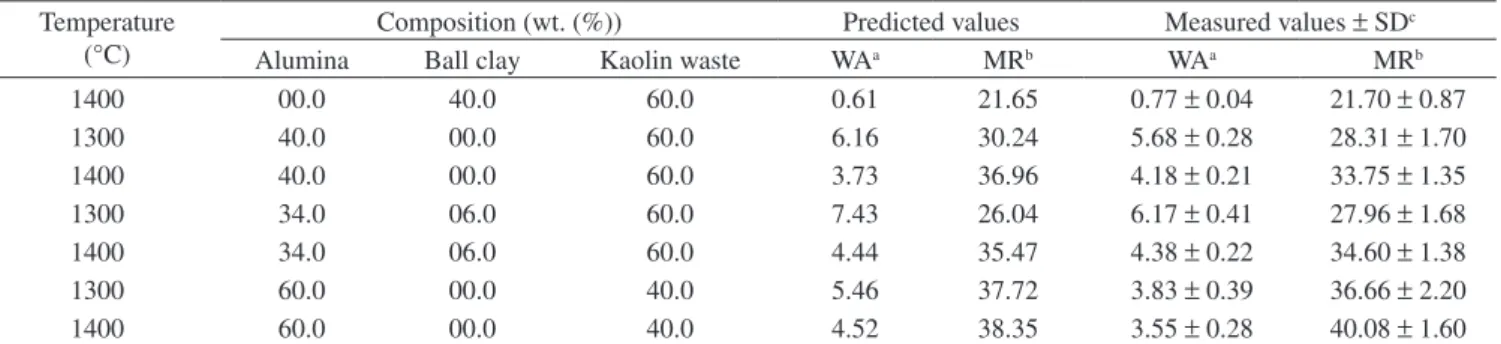
To counter-check the statistical models, test specimens of the compositions M11 (40.0 wt. (%) ball clay, 60.0 wt. (%) kaolin waste), M12 (40 wt. (%) alumina, 60 wt. (%) kaolin waste), M13 (34.0 wt. (%) alu-mina, 6 wt. (%) ball clay, 60 wt. (%) kaolin waste) and M14 (60 wt. (%)) alumina, 40 wt. (%) kaolin waste) were prepared (as described in the Experimental Procedure) and their WA and MR were predicted based on the models and were measured experimentally. Table 5 shows the results obtained, indicating that the errors of the predicted values are low, thus confirming the validation of the calculated models.
Figure 3 depicts the X ray diffraction patterns of the test specimens of the compositions M11, M12, M13 and M14 after firing at 1300 and 1400 °C. The bodies presented mullite (3Al2O3.2SiO2), quartz (SiO2) and/or alumina (Al2O3) as crystalline phases after firing at 1300 °C and 1400 °C. The XRD patterns show that mullite and alumina are the main crystalline phases presented in compositions M12, M13 and M14 after firing at 1400 °C.
Table 4. Analysis of variance for significance of regression modelsa.
Property Temperature (°C)
Regression model SSR DF MSR SSE DF MSE F test p value R2
(%)
WAb 1300 Full Cubic 15.2287 2 7.6144 19.8067 31 0.6390 11.9175 0.0001 93.04
WAb 1400 Full Cubic 19.7784 2 9.8892 4.8567 31 0.1567 63.1221 <0.0001 98.18
MRc 1300 Full Cubic 48.720 2 24.360 161.0971 31 5.1967 4.6876 0.0166 97.23
MRc 1400 Full Cubic 412.70 2 206.350 480.422 31 15.4975 13.3151 0.0001 96.95
a) SSR: regression sum of squares; DF: degrees of freedom; MSR: regression mean squares; SSE: error sum of squares; MSE: error mean squares; R2:
coef-ficient of multiple determination; b) Water Absorption; and c) Modulus of rupture.
Ra
w residual
6 7 8 9 10 11 12
5 4 3 2 1 –2.0 –1.5 –1.0 –0.5 0.0 0.5 1.0 1.5
2.0 3.0
1300 °C 1300 °C
2.5
2.0
2.0 1.5
1.5 1.0
1.0 0.5
0.5 0.0
0.0 –0.5
–0.5 –1.0
–1.0 –1.5
–1.5 –2.0
–2.0 –2.5
–3.0
Raw residual
Expected normal v
alue
Predicted value
0.8
0.6
0.4
0.2
0.0
–0.2
–0.4
–0.6
–0.8
–1.0
0 1 2 3 4 5 6 7 8 9 10
Predicted value
Ra
w residual
1400 °C
3.0
2.5
2.0
1.5
1.0
0.5 0.0
–0.5
–1.0
–1.0 –0.8 –0.6 –0.4 –0.2 0.0 0.2 0.4 0.6 0.8 –1.5
–2.0
–2.5 –3.0
1400 °C
Raw residual
Expected normal v
alue
Table 5. Composition of checkpoint mixtures and corresponding measured and predicted values of water absorption and modulus of rupture.
Temperature (°C)
Composition (wt. (%)) Predicted values Measured values ± SDc
Alumina Ball clay Kaolin waste WAa MRb WAa MRb
1400 00.0 40.0 60.0 0.61 21.65 0.77 ± 0.04 21.70 ± 0.87
1300 40.0 00.0 60.0 6.16 30.24 5.68 ± 0.28 28.31 ± 1.70
1400 40.0 00.0 60.0 3.73 36.96 4.18 ± 0.21 33.75 ± 1.35
1300 34.0 06.0 60.0 7.43 26.04 6.17 ± 0.41 27.96 ± 1.68
1400 34.0 06.0 60.0 4.44 35.47 4.38 ± 0.22 34.60 ± 1.38
1300 60.0 00.0 40.0 5.46 37.72 3.83 ± 0.39 36.66 ± 2.20
1400 60.0 00.0 40.0 4.52 38.35 3.55 ± 0.28 40.08 ± 1.60
a) Water Absorption; b) Modulus of rupture; and c) Standard Deviation.
Figure 2. Modulus of rupture raw residuals vs. predicted values and normal probability curve for modulus of rupture residuals at 1300°C and 1400 °C. Raw residual
Raw residual
Expected normal v
alue 1400 °C 3.0 2.5 2.0 1.5 1.0 0.5 0.0 0.5 –1.0 –1.5 –2.0 –2.5 –3.0
–10 –8 –6 –4 –2 0 2 4 6 8 10
1300 °C Ra w residual 3.0 2.5 2.0 1.5 1.0 0.5 0.0 –0.5 –1.0 –1.5 –2.0 –2.5 –3.0
–7 –6 –5 –4 –3 –2 –1 0 1 2 3 4 5 6
1300 °C
Expected normal v
alue 6 5 4 3 2 1 0 –1 –2 –3 –4 –5 –6 –7
10 15 20 25 30 35 40 45 50 55 60
Predicted value 10 8 6 4 2 0 –2 –4 –6 –8 –10
0 10 20 30 40 50 60 70 80 90 100
Predicted value
Ra
w residual
1400 °C
most adequate model can vary according to the analyzed property and the firing temperature, as reported in a previous work30, which expressed the properties of ceramic bricks and tiles using special cubic and quadratic models, according to firing temperature.
Comparing the values and signs of the coefficients of the models in Equations (1) and (2), it may be deduced that the most synergistic interaction after firing at 1300 °C is that manifested between alumina and kaolin waste, while the most synergistic interaction after firing at 1400 °C is associated with ball clay-kaolin waste mixtures. On the other hand, the mixtures of the three components and the interactions between alumina and ball clay are the most antagonistic interactions after firing at 1300 and 1400 °C, respectively.
The most synergistic effect on the MR after firing at 1300 and 1400 °C (Equations (3) and (4)) is associated with the alumina con-tent. The mixtures of the three components act in an antagonistic manner after firing at 1300 °C. After 1400 °C, the alumina-ball clay and alumina-kaolin waste mixtures have an antagonistic effect on the MR.
This analysis indicates that the inadequate use of kaolin waste can decrease the properties of mullite-based ceramics and emphasizes that the statistical design methods are the most appropriate for optimizing the mixtures, because they can minimize the deleterious effects of the waste on the properties of the fired bodies rapidly, while optimize the mixtures by conventional methods would be very difficult and time consuming.
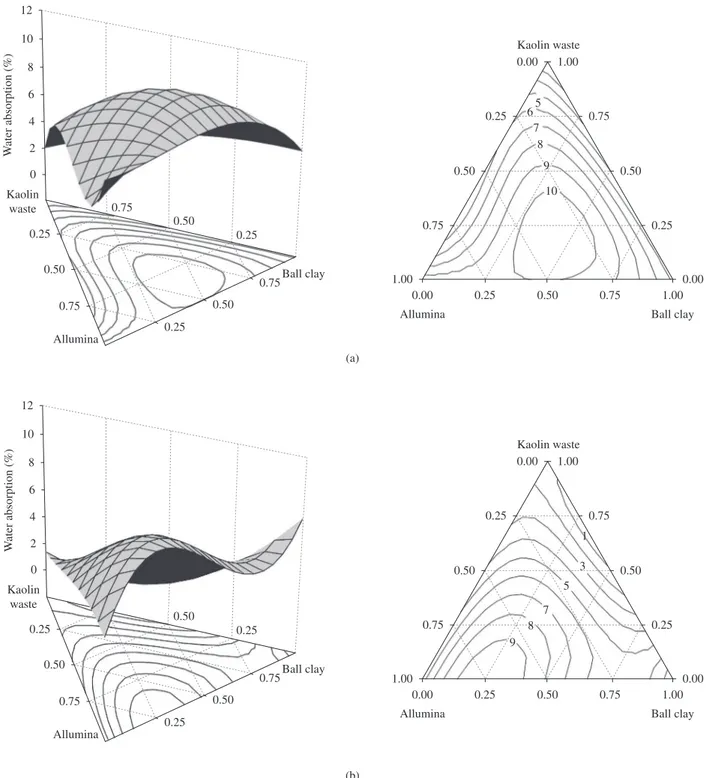
Figures 4 and 5 show the calculated response surface plots and their projections onto the composition triangle (as constant proper-ties contours - contour plot) for the WA and MR, respectively. The 3-D surface plot is the graphical representation of Equations (1) to Figure 3. X ray diffraction patterns of the test specimens of the compositions
M11, M12, M13 and M14 after firing at 1300 °C and 1400 °C. M M M M M M M M
M M MMMMMMM M
M
M MMMMMM M M M M
M M M
M M
MMM M M M
M
MM M
M M
M M M M
M MM
M M
MM MMM M M
MM
M M
MM M M MM M
M M
M M MMM M
M M
M M
MMM M M
MA MMAM MM MMM A /A /A /A /A /A A
A A A AA
A A A A A A A AA AA A A A A/ A/ A/ A/ A/
A AA
A AA
Q
Q
Q Q Q
Q
Q
Q Q Q
Q Q Q Q Q Q Q Q Q
QQ QQ QM Q
Q Q
Q Q
Q Q Q Q
Q Q
Q Q Q
M14-1400 °C
M14-1300 °C
M12-1400 °C
M13-1400 °C
M13-1300 °C
M11-1400 °C
M11-1300 °C
M12-1300 °C
10 15 20 25 30 35 40 45 50 55 60 65 70 2θ
C
C
M - Mullite
A - Alumina Q - Quartz
Figure 4. Response surface plots and their projections onto the composition triangle for water absorption at a) 1300 °C; and b) 1400 °C. (a)
(b) 0.75
0.75
0.75 0.50
0.50
0.50
0.25
0.25 0.25
Kaolin waste
Ball clay
Allumina 12
10
8
6
4
2
0
W
ater absorption (%)
5 6
7 8
9
10
0.75
0.75 0.75
0.50
0.50 0.50
0.25
0.25 0.25
1.00
1.00 1.00
0.00 0.00
0.00 Kaolin waste
Ball clay Allumina
0.75
0.75 0.50
0.50
0.50
0.25
0.25 0.25
Kaolin waste
Ball clay
Allumina 12
10
8
6
4
2
0
W
ater absorption (%) 1
3
7 8 9
5 0.75
0.75 0.75
0.50
0.50 0.50
0.25
0.25 0.25
1.00
1.00 1.00
0.00 0.00
0.00 Kaolin waste
Ball clay Allumina
(4) and allows for easy and rapid predictive estimates over the entire composition range under investigation.
Figure 4 shows that WA increases with the decrease in kaolin waste content at 1300 °C and 1400 °C. However, the alumina-kaolin waste mixtures rich in alumina presented low WA values. As Figure 5 indicates, the highest MR values correspond to compositions with high alumina content (>90 wt. (%)) and that the MR of compositions with high amounts of kaolin waste or ball clay is similar after firing at 1300 °C and 1400 °C.
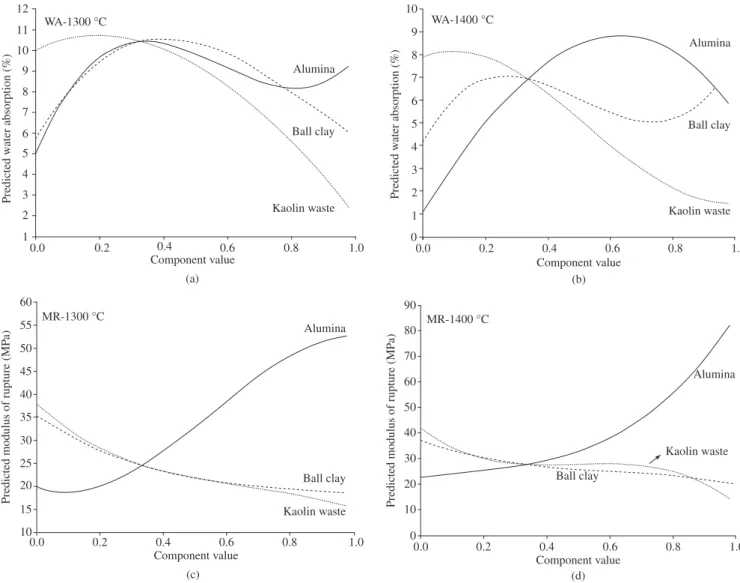
1300 and 1400 °C. But there is a composition range of intermediary-to-high kaolin waste content (35-65 wt. (%)) in which the MR is mildly influenced by the increase in kaolin waste content.
These observations suggest the following: it is interesting use the highest possible proportion of alumina in the formulations; the waste content in the mixtures can be increased in compositions containing more than 35% and up to 65% of waste without severe decreasing the MR; the ball clay content is a detrimental factor for the MR particularly for intermediary-to-high clay contents.
The results indicate that the statistical design of mixture experi-ments methodology can be used successfully to optimize formulations containing large amounts of wastes. They also suggest the suitability of tailoring waste content to obtain the desired property.
trace plots. The reference composition used in the trace plots was the simplex centroid (M7 in Table 2), which corresponds to 33.3 alumina, 33.3 ball clay, and 33.3 kaolin waste.
Figures 6a and 6b show that increasing the kaolin waste content decreases the WA at 1300 and 1400 °C. The increase in the ball clay and alumina contents increases the WA, but starting from a given amount, the rise in their content, generally causes the WA to decrease.
Figures 6c and 6d indicate that the MR is particularly sensitive to the changes in the alumina content. A sharp decline in the MR can be observed as the alumina content decreases. This behavior is most pronounced at 1400 °C, but is also unmistakable at 1300 °C. The increase in kaolin waste and ball clay contents decreases the MR at
Figure 5. Response surface plots and their projections onto the composition triangle for modulus of rupture at a) 1300 °C; and b) 1400 °C. 60
50
40
30
20
10
Modulus of rupture (MP
a)
0.75 0.75
0.75 0.50
0.50
0.50
0.25
0.25 0.25
Kaolin waste
Ball clay
Allumina
0.75
0.75 0.75
0.50
0.50 0.50
0.25
0.25 0.25
1.00
1.00 1.00
0.00 0.00
0.00 Kaolin waste
Ball clay Allumina
20
30
35 45
25
(a)
100
80
60
40
20
0
Modulus of rupture (MP
a)
0.75 0.75
0.75 0.50
0.50
0.50
0.25
0.25 0.25
Kaolin waste
Ball clay
Allumina
0.75
0.75 0.75
0.50
0.50 0.50
0.25
0.25 0.25
1.00
1.00 1.00
0.00 0.00
0.00 Kaolin waste
Ball clay Allumina
30 40
20 16
50 70
25
80
References
1. Acchar W, Vieira FA, Segadães AM. Using ornamental stone cutting rejects as raw materials for red clay ceramic products: properties and microstructure development. Materials Science and Engineering A. 2006; 435-436:606-610.
2. Segadães AM. Use of phase diagrams to guide ceramic production from wastes. Advances in Applied Ceramics. 2006; 105(1):46-54.
3. Moreira JMS, Manhães JPVT, Holanda JNF. Processing of red ceramic using ornamental rock powder waste. Journal of Materials Processing Technology. 2008; 196(1-3):88-93.
4. Tulyaganov DU, Olhero SMH, Ribeiro MJ, Ferreira JMF, Labrincha JA. Mullite-alumina refractory ceramics obtained from mixtures of natural common materials and recycled Al-rich anodizing sludge. Journal of Materials Synthesis and Processing. 2002; 10(6):311-318.
5. Souza LPF, Mansur HS. Production and characterization of ceramic pieces obtained by slip casting using powder wastes. Journal of Materials Processing Technology. 2004; 145(1):14-20.
6. Menezes RR, Ferreira HS, Neves GA, Ferreira HC. Uso de rejeitos de granitos como matérias-primas cerâmicas (Use of granite sawing wastes as ceramic raw-materials). Cerâmica. 2002; 48(306):1-9.
4. Conclusions
The statistical design of mixture experiments and response surface methodologies proved to be powerful tools for planning and analyz-ing experiments to ascertain the influence of kaolin processanalyz-ing waste content on the technological properties of mullite-based ceramic bod-ies and to optimize ceramic formulations containing large amount of waste. The calculated regression models were found to be statistically significant at the required level and presented little variability. These regression models, which can be used in the scientific of the optimal waste content to produce mullite-based ceramic bodies with specific properties, offer substantial time savings.
Acknowledgements
The authors would like to thank the Brazilian research funding agencies: FAPESQ/MCT/CNPq (State of Paraíba Research Founda-tion, processes nos. 003/03 and 004/06) and CNPq (National Council for Science and Technology, process no. 471415/04-9) for their financial support of this work.
Figure 6. Predicted properties trace plots: a) water absorption at 1300 °C, b) water absorption at 1400 °C, c) modulus of rupture at 1300 °C; and d) modulus of rupture at 1400 °C.
Alumina
Ball clay
Kaolin waste WA-1300 °C
12
11
10
9
8
7
6
5
4
3
2
1
0.0 0.2 0.4 0.6 0.8 1.0
Predicted w
ater absorption (%)
(a) Component value
10
9
8
7
6
5
4
3
2
1
0
0.2
0.0 0.4 0.6 0.8 1.0
(b)
Alumina
Ball clay
Kaolin waste WA-1400 °C
Predicted w
ater absorption (%)
Component value
Alumina
Ball clay
Kaolin waste MR-1300 °C
Predicted modulus of rupture (MP
a)
60
55
50
45
40
35
30
25
20
15
10
0.0 0.2 0.4 0.6 0.8 1.0
(c) Component value
Alumina
Ball clay
Kaolin waste MR-1400 °C
Predicted modulus of rupture (MP
a)
0.0 0.2 0.4 0.6 0.8 1.0
90
80
70
60
50
40
30
20
10
0
on the technological properties. Ceramic Forum International. 2005; 82(1-2):E39-E43.
20. Chick LA, Piepel G. Statistically designed optimization of a glass composition. Journal of the American Ceramic Society. 1984; 67(12):763-768.
21. Correia SL, Curto KAS, Hotza D, Segadães AM. Using statistical techniques to model the flexural strength of dried triaxial ceramic bodies. Journal of the European Ceramic Society. 2004; 24(9):2813-2818.
22. Khalfaoui A, Hajjaji M, Kacim S, Baçaoui A. Evaluation of the simultaneous effects of firing cycle parameters on technological properties and ceramic suitability of a raw clay using the response surface methodology. Journal of the American Ceramic Society. 2006; 89(5):1563-1567.
23. Nyutu EK, Suib SL. Experiment design in the deposition of BN interface coatings on SiC fibers by chemical vapor deposition. Surface & Coating Technology. 2006; 201(6):2741-2748.
24. Piepel G, Redgate T. Mixture experiment techniques for reducing the number of components applied for modeling waste glass sodium release. Journal of the American Ceramic Society. 1997; 80(12):3038-3044. 25. Ahm JH, Lee YP, Rhee JS. Investigation of refolding condition for
Pseudomonas fluorescens lipase by response surface methodology. Journal of Biotechnology. 1997; 54(3):151-160.
26. Yahia A, Khayat KH. Experiment design to evaluate interaction of high-range water-reducer and antiwashout admixture in high-performance cement grout. Cement and Concrete Research. 2001; 31(5):749-757.
27. Menezes RR, Almeida RR, Santana LNL, Neves GA, Lira HL, Ferreira HC. Análise da co-utilização do resíduo do beneficiamento do caulim e serragem de granito para produção de blocos e telhas cerâmicos. Cerâmica. 2007a; 53(326):192-199.
28. Menezes RR, Almeida RR, Santana LNL, Ferreira HS, Neves GA, Ferreira HC. Utilização do resíduo do beneficiamento do caulim na produção de blocos e telhas cerâmicos. Matéria. 2007b; 12(1):226-236.
29. Montgomery DC. Design and analysis of experiments. 5 ed. New York: Wiley Interscience; 2001. p. 378.
30. Campos LFA, Menezes RR, Lisboa D, Santana LNL, Neves GA, Ferreira HC. Planejamento experimental no estudo da maximização do teor de resíduos em blocos e revestimentos cerâmicos. Cerâmica. 2007; 53(328):373-380.
7. Menezes RR, Neves GA, Ferreira HC, Lira HL. Recycling of granite industry waste from the northeast region of Brazil. Environmental Management and Health. 2002; 13(2):134-141.
8. Menezes RR, Ferreira HS, Neves GA, Lira HL, Ferreira HC. Use of granite sawing wastes in the production of ceramic bricks and tiles. Journal of the European Ceramic Society. 2005; 25(7):1149-1158.
9. Almeida RR. Reciclagem de resíduo de caulim e granito para produção de blocos e telhas [Dissertation]. Campina Grande: Federal University of Campina Grande; 2006.
10. Brasileiro MI, Oliveira DHS, Lira HL, Santana LNL, Neves GA, Novaes AP. et al. Mullite preparetion from kaolin residue. Materials Science Forum 2006; 530-531:625-630.
11. Parka YM, Yanga TY, Yoon SY, Stevens R, Park HC. Mullite whiskers derived from coal fly ash. Materials Science and Engineering A. 2007; 454-455:518-522.
12. Costa Oliveira FA, Livramento V, Delmas F. Novel mullite-based ceramics manufactured from inorganic wastes II: Mechanical behaviour. Journal of Materials Processing Technology 2008; 195(1-3):255-259.
13. Costa Oliveira FA, Livramento V, Delmas F. Novel mullite-based ceramics manufactured from inorganic wastes I. Densification behavior. Journal of Materials Processing Technology. 2008; 196(1-3):101-108.
14. Kim YW, Kim HD, Park CB. Processing of microcellular mullite. Journal of the American Ceramic Society. 2005; 88(12):3311-3315.
15. Correia SL, Oliveira APN, Hotza D, Segadães AM. Properties of triaxial porcelain bodies: Interpretation of statistical modeling. Journal of the American Ceramic Society. 2006; 89(11):3356-3365.
16. Cornell JA. Experiments with mixtures: designs, models and the analysis of mixture data. 3 ed. New York: Wiley Interscience; 2002. p. 404.
17. Myers RH, Montgomery DC. Response surface methodology: process and product optimization using designed experiments. New York: Wiley Interscience; 2002. p. 230.
18. Correia SL, Hotza D, Segadães AM. Simultaneous optimization of linear firing shrinkage and water absorption of triaxial ceramic bodies using experiments design. Ceramics International. 2004; 30(6):917-922.