A Work Project presented as part of the requirements for the Award of a Master Degree in Economics from Nova School of Business and Economics
Tourism and Real Estate Markets
Rafael Sá Pinto Longo, nº 794
A Research Project carried out under the supervision of: Professor Carlos Santos
2 Abstract
The short-term renting market has expanded substantially in the recent years due the appearance of digital platforms which link the demand and the supply sides. As a result, many cities have allocated a high share of their lodgings to holiday homes, pressuring long-term housing markets. This work tackles this unexplored issue, presenting the case of Portugal with data from Airbnb and finds that a higher concentration of holiday homes in a location leads to higher housing prices. This effect is particularly localized to the historical centers of Lisbon and Porto.
Keywords: holiday homes, housing prices, Airbnb
1. Introduction
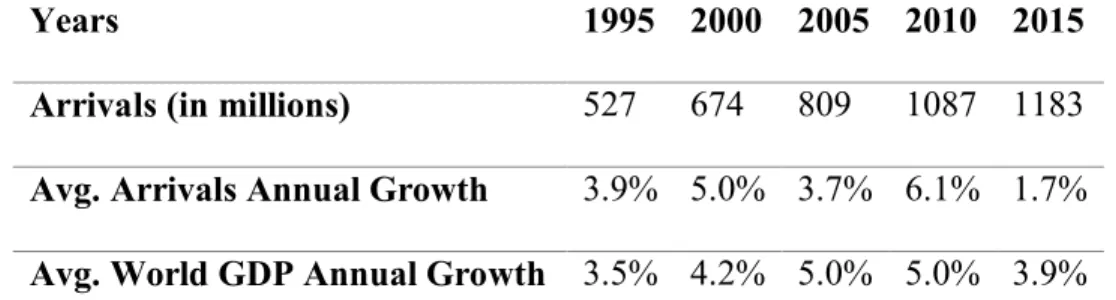
Tourism has been increasing worldwide for several decades, on par with world GDP. From 1995 to 2015, international tourist arrivals have increased on average 4.1% each year, while world GDP did 4.5% - Table 1.
Years 1995 2000 2005 2010 2015
Arrivals (in millions) 527 674 809 1087 1183 Avg. Arrivals Annual Growth 3.9% 5.0% 3.7% 6.1% 1.7% Avg. World GDP Annual Growth 3.5% 4.2% 5.0% 5.0% 3.9% Table 1 – World international tourist arrivals growth and World GDP growth. Source: UNTWO and WB.
Portugal has followed the same trend. From 2009 to 2015, the direct contribution of tourism to Portuguese GDP has gone from approximately 4.5% to 6.5%. Nonetheless, some regions were more preferred than others, namely Lisbon, Faro and Porto.
Part of this surge in tourism is explained by the more widespread use of technologies which have had a great influence in this sector. The appearance and popularization of platforms such as Airbnb
3 has increased options tourists face when travelling, taken advantage of sub-utilized assets and decreased the cost of hospitality services.
Most importantly, these digital platforms have a high output of statistical information. This richness of data presents itself as an opportunity to study the impact that the concentration of holiday homes has on housing prices in a given region, which is what this work purports to do.
This paper takes advantage of Decreto-Lei 124/2008 (DL124/2008), a regulatory change that has reduced the barriers to entry into the short-term renting market in Portugal on the supply side, particularly for small offerors. It then assesses how the variation in the concentration of holiday homes in different regions at the time the law was implemented led to an increase in housing prices. This increase was very localized in some parishes of Porto and Lisbon, particularly in their historical centers.
2. Literature review
The literature on the impact holiday homes have on different outcomes is still unexplored in urban economics. This should not be surprising given they are mostly a new reality set forth by digital platforms which only recently have substantially increased in popularity. Airbnb, the most popular, was founded in 2008. Moreover, with regards to the country under analysis, it only started slowly penetrating the Portuguese market in 2011. By the 3rd quarter of 2016, however, this market was settled in Portugal. Therefore, this work comes forward in filling a newly created gap in the literature.
Indeed, Zervas, Proserpio and Byers (2016) is the only work which has dealt with Airbnb data in the same fashion. The authors measure the impact of Airbnb on hotel revenues, by following a differences-in-differences empirical strategy and gathering data on individual Airbnb listings
4 through web scraping. They find Airbnb has been able to hamper hotels’ ability to differentiate prices across time, i.e. yield management. As can be seen, topic-wise, Zervas, Prosperio and Byers (2016) is unrelated to the present work.
On this front, perhaps the most similar work in the urban economics literature is the set of two papers Saiz (2003) and Saiz (2007). These find that immigration has a positive impact on housing prices due to the additional demand they create: respectively, in Miami, using the Mariel boatlift database; and for the whole US. The current work, rather, focuses on serial very temporary movements of people towards a region – tourism – which lead to a percentage of available housing to be fully allocated towards them.
Additional demand, though, is not a sufficient condition to have housing price increases. As argued in Green, Malpezzi and Mayo (2005), in the absence of land constraints, positive demand shocks should be absorbed by an adjustment in supply, in the short-to-medium run. Yet, the same does not hold for negative shocks due to the durability and spatial fixity of housing, described in greater detail in Smith, Rosen and Fallis (1988). These housing supply curves should, then, be kinked. Nevertheless, Saiz (2010) finds that geography plays a key role in setting up land constraints, namely due to the presence of bodies of water and steep slopes, which lead housing supply to be inelastic. This point is particularly important for the present work, since, as will be seen in section 4, holiday homes in Portugal are mainly concentrated in the municipalities Lisbon and Porto – being both sloped cities next to a major river and the Atlantic Ocean – and the coastline of Faro, a thin line of land also bathed by the Atlantic and a top destination during the summer for its beaches. This is further reinforced in Helms (2003), which finds that the housing most likely to be renovated is older and architecturally distinctive, located in moderate-density regions, with good accessibility
5 to the CBD and an assortment of amenities such as city parks, bodies of water or high elevations, conditions completely met by the downtowns/historical zones of both Lisbon and Porto.
It is expected, then, that demand for holiday homes is particularly localized to Lisbon and Porto, namely in some parishes which are severely land constrained.
Lastly, Quigley and Raphael (2005) and Ihlanfeldt (2007) also find regulation can further increase land constraints and housing prices. Municipalities in Portugal are regulated by Planos Diretores Municipais (PDMs) which set restrictions on height, type of land use, boundaries of growth, etc.
3. Data
Four different datasets were used in the empirical section of this paper: two on holiday homes for tourists; one on sale prices and rents for housing; and, lastly, one on the total amount of lodgings and on the population by country of origin. All variables are set up by location.
Throughout this paper, the term “holiday home” will be used as the translation of a juridically defined category of hospitality in Portugal – Alojamento Local. This is a special statute for any establishment that lodges national or foreign tourists temporarily for monetary compensation, with less than 10 rooms, without any special architectural value of note, outside of a strictly rural setting and which is not nor belongs to a resort.
It is important to note beforehand that there are several kinds of administrative divisions in Portugal, each with several levels. The most used one, which is followed in this work, has three levels. In the first, Portugal is divided into several districts in continental Europe, what is usually deemed continental Portugal, and 2 autonomous regions (Regiões Autónomas)– the two archipelagos in the Atlantic, Madeira and Azores, to the west of the country. These, in the second level, are divided into municipalities (concelhos), which, in turn, are further divided, in the third
6 level, into parishes (freguesias). There are 308 municipalities and 3092 parishes in Portugal, whilst 272 and 2882, respectively, in continental Portugal.
All the datasets refer solely to continental Portugal, since one of the key datasets used in this paper, the CI dataset described below, does not have any information on the autonomous regions.
3.1.RNAL
The first dataset was obtained from Registo Nacional de Alojamento Local (RNAL) on September 6th, 2016. The registration in RNAL is mandatory for all offerors of holiday homes, since the introduction of DL128/2014. All data is publicly and freely available on RNAL’s website.
The data lists a total of 32622 observations regarding continental Portugal. It includes six variables on the location of the holiday homes with various scales of detail (up to parish), as well as information about the characteristics of the establishment – e.g. typology or the number of bedrooms –, information on its owner and the dates of registration and opening to business.
3.2.Airbnb
The second dataset was obtained from the Airbnb platform through web scraping. Airbnb is a two-sided market founded in 2008 for short-term housing renting, mainly used by tourists as an alternative to other hospitality service providers such as hotels or hostels. Offerors are mostly trying to make some revenue out of sub-utilized assets – 96% of the users registered in Airbnb have 5 or less offers on the site. In other words, the vast majority of offers available on Airbnb are holiday homes.
Since the Airbnb website includes many protection layers against scraping – e.g. IP detection, fingerprinting, proxy blocks, rate of access control, etc. – an algorithm simulating how a human would use the website was developed. This algorithm would take control over the computer and
7 would have it automatically dragging the interactive map feature provided by Airbnb to perform searches. Then, it would click on all the listings resulting from the search and save their respective pages in the hard drive. Also, because Airbnb has a limit on the number of listings shown for each portion of the interactive map, 300, the algorithm would make the computer zoom in and out the interactive map accordingly to the lowest level of zoom possible to get the maximum number of listings under 300. Since this method of data gathering is quite slow, the dataset was obtained throughout the whole month of September 2016. A brief description of the algorithm is available in the appendix.
In total, 44742 observations were gathered. This value alone is noteworthy, as it is 37% higher than the one for RNAL, suggesting a great deal of holiday homes are not registered in the latter. It is not possible to know the extent of the overlap between these two groups. One-time events could be explaining this discrepancy, such as the 2014 UEFA Champions League final in Estádio da Luz, in Lisbon. However, taking a closer look at Airbnb’s dataset, this seems unlikely, as 90% of Airbnb users on the supply side take at most a day to reply to the demand side – meaning at least 90% of the offers as of September 2016 on the platform were active. Moreover, 79% of the offers were updated at least 4 months prior to September 2016.
The Airbnb dataset includes several variables on location up to latitude-longitude in terms of precision. Moreover, it contains several characteristics (e.g. number of rooms) and the amenities of the offer, information on reviews by users and on the activity of the offeror, namely the month during which he joined the platform.
Any holiday home offered in Airbnb will be referred to throughout the paper as either “offer” or “listing”.
8 Finally, data was also gathered in very similar conditions for Homeaway, another short-term housing digital platform. However, this dataset was discarded as it does not fully capture the extent of this market in Portugal.
3.3.CI
Confidencial Imobiliário (CI) is a firm specialized in gathering information on the housing market in Portugal. The CI dataset used in this report includes the average quarterly sale prices and rents of housing in 35% of the municipalities in Portugal and on all the parishes in the municipalities of Porto and Lisbon. These municipalities encompass 84% of the population living in continental Portugal (80% in all of Portugal). The two series are reported quarterly from the 1st quarter of 2007 (the 1st quarter of 2010 for rents) to the 1st quarter of 2016. However, in earlier years the data is not only noisier but has a great number of municipalities and parishes with missing values, thus only the period between, and including, 2011 to 2016 is considered.
3.4.INE
From INE – Instituto Nacional de Estatística – two pieces of information were obtained, both from the 2011 Portuguese national census. The first was the total number of lodgings in Portugal by location, up to parishes. These are subdivided into two broad classes, familiar (e.g. a typical house) and collective lodgings (e.g. a hotel). This work is focused on the first, so, from this point on, familiar lodgings will be simply referred to as lodgings The second was the number of men and women living in Portugal by location (up to parish) and by country of origin. All data is publicly and freely available in INE’s website and refers solely to 2011.
3.5.Transformations applied to the data
The four datasets are aggregated at different levels. The Airbnb dataset provides the latitude and the longitude of the offer. These are determined automatically by Airbnb when the offeror writes
9 the full address of the listing, or by the offerors themselves by clicking on a location on an interactive Google Maps map. Airbnb has 3 additional variables on location but they are either defined by the users themselves or by the platforms. Hence, they are prone to error and they do not follow the standards of Portuguese statistics.
For this reason, using GIS (Geographic Information System) software, the points of latitude and longitude in the Airbnb dataset were converted into values characterizing parishes and municipalities. That is, if a point representing an offer was within the boundaries of a given parish or municipality, one unit would be added to a variable measuring the number of listings in that location. The map used to do such a conversion, CAOP 2016, is provided by Direção-Geral do Território, and freely available online. This institution is in charge of land-use planning and managing databases on geographical information in Portugal. After the conversion, the Airbnb database becomes directly comparable with the RNAL, CI and INE ones.
Lastly, following Lei 11-A/2013, which called for the reorganization of parishes in Portugal, several parishes were merged. This affected particularly Lisbon and Porto, which before 2013 had 53 and 15 parishes, but only 24 and 7 afterwards, respectively. Since the data from INE is from the 2011 census, the old denominations of the parishes were converted to the new ones. The only exception was Santa Maria dos Olivais, a parish in Lisbon, which was split in 2013 into Olivais and Parque das Nações. Hence, for this parish alone the old values for all variables in the INE database were evenly split between the two new parishes.
4. Characterization of the housing market in Portugal
The characterization of the housing market in Portugal rather than being comprehensive will focus on the key points required to follow the estimations done in section 5. Thus, it will cover the
10 evolution of prices in the Portuguese housing market and the distribution of holiday homes across continental Portugal.
4.1.Prices in the long-term housing market
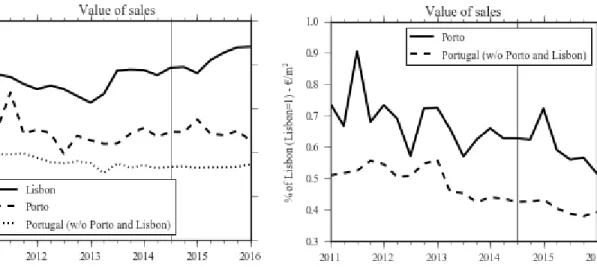
Housing prices as measured by the value of sales have increased 14% in Lisbon from the 1st quarter of 2011 to the 1st quarter of 2016, while decreasing 20% in Porto and 12% in the rest of continental Portugal – Figure 1. This divergence in prices between Lisbon and the rest of the country can be better seen in Figure 2, where the prices in Porto and the rest of Portugal are expressed relative to those in Lisbon. A quick glance suggests there has been a change in the behavior of the value of sales following the policy change introduced in the 3rd quarter of 2014, marked by a vertical line, DL128/2014, particularly for Porto.
Figure 1 – Value of sales, in € per m2, in Lisbon, Porto and the
rest of Portugal. The vertical line marks the date of the publication of DL128/2014. Source: CI.
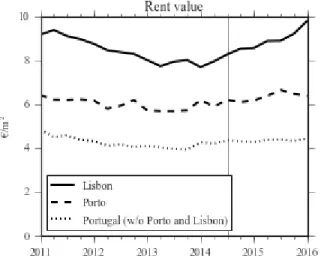
Figure 2 – Value of sales in Porto and the rest of Portugal (exc. Lisbon and Porto) as a percentage of Lisbon. The vertical line marks the date of the publication of DL128/2014. Source: CI. Rent values, in Figure 3, follow a similar pattern, even if less pronounced. In Lisbon, from the 1st quarter of 2011 to the 1st quarter of 2016, they have gone up by 7%, while they went down by less than 1% and 9% in Porto and the rest of Portugal, respectively. On the other hand, Figure 4, is markedly different from Figure 2, as from 2011 to 2014 rents were increasing in Porto and the rest of Portugal relative to Lisbon but afterwards they have been losing ground.
11 Figure 3 - Value of rents, in € per m2, in Lisbon, Porto and the
rest of Portugal. The vertical line marks the date of the publication of DL128/2014. Source: CI.
Figure 4 - Value of rents in Porto and the rest of Portugal (exc. Lisbon and Porto) as a percentage of Lisbon. The vertical line marks the date of the publication of DL128/2014. Source: CI. It is important also to note that during this period Portugal has suffered a severe economic and public debt crisis, explaining why some raw sales and rent values have a U-shape, particularly for the case of Lisbon.
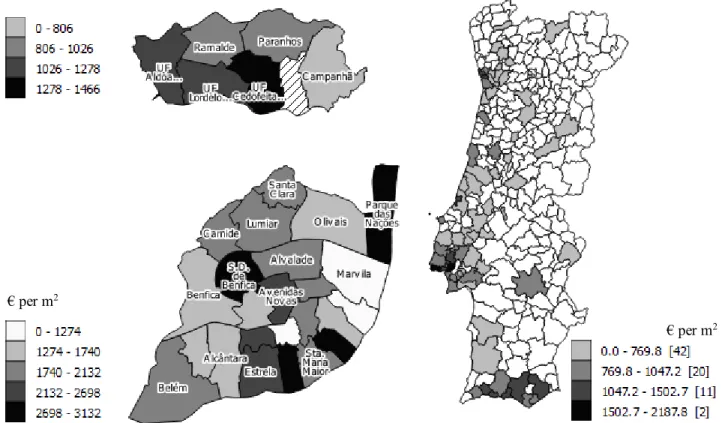
One can also take a look at the regional variation in the value of rents and sales – Figure 5 and 6. The values in both figures are for the first quarter of 2015, since it is the period for which there are fewer missing values. Additionally, these two figures make it clear that most of the regions covered are coastal regions of Portugal or district capitals, where, according to section 3.3, most of the population in Portugal lives. The two maps follow a similar pattern – the most expensive housing in Portugal, both in terms of rents and sale prices, is located in the municipalities of Lisbon and Porto, and the district of Faro. Moreover, looking at the parishes of Lisbon, it is possible to see prices are highest in the south, in the historical zones of the city; in Parque das Nações, a newly built location well-endowed with amenities; and São Domingos de Benfica and Avenidas Novas which concentrate a great part of the student housing for the universities in Lisbon. As for Porto, prices are highest in UF de Cedofeita, Santo Ildefonso, Sé, Miragaia, São Nicolau e Vitória, which include the historical zones of Porto.
12 Figure 5 – Sales price in € per m2, in the 1st quarter of 2015, in continental Portugal (on the right), Porto (on the upper-left) and
Lisbon (on the lower-left). The scales are determined using the Natural Breaks (Jenks) algorithm from QGIS. Source: CI.
Figure 6 – Rent values in € per m2, in the 1st quarter of 2015, in continental Portugal (on the right), Porto (on the upper-left) and
Lisbon (on the lower-left). The scales are determined using the Natural Breaks (Jenks) algorithm from QGIS. Source: CI.
€ per m2
€ per m2
€ per m2
€ per m2
13 4.2. Number of holiday homes
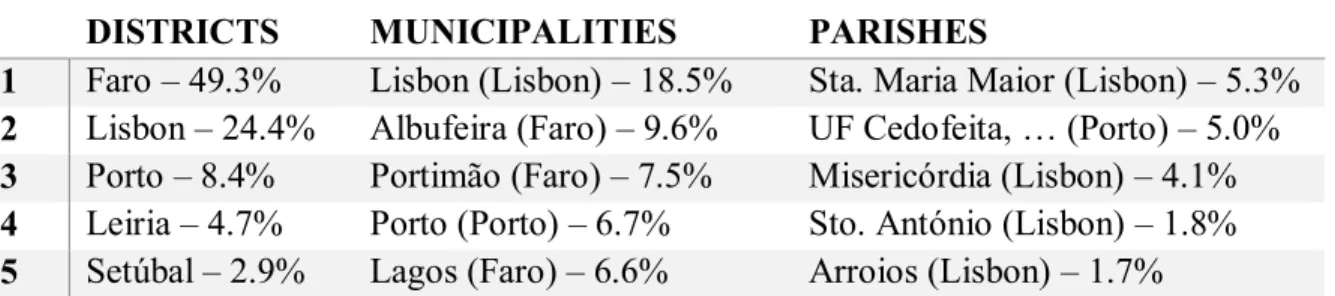
The 32622 holiday homes registered in RNAL are concentrated in the districts of, in descending order, Faro, Lisbon and Porto which account for 82% of all registries. Similarly, the top 5 municipalities, all located in these districts, account for nearly half of all registries.
DISTRICTS MUNICIPALITIES PARISHES
1 Faro – 49.3% Lisbon (Lisbon) – 18.5% Sta. Maria Maior (Lisbon) – 5.3% 2 Lisbon – 24.4% Albufeira (Faro) – 9.6% UF Cedofeita, … (Porto) – 5.0% 3 Porto – 8.4% Portimão (Faro) – 7.5% Misericórdia (Lisbon) – 4.1% 4 Leiria – 4.7% Porto (Porto) – 6.7% Sto. António (Lisbon) – 1.8% 5 Setúbal – 2.9% Lagos (Faro) – 6.6% Arroios (Lisbon) – 1.7%
Table 2 – Share of holiday homes in RNAL by districts, municipalities and parishes relative to total (top 5). Source: RNAL.
The distribution for Airbnb suggests a different picture. There are 44411 registries in this platform. The fact RNAL has less registries than Airbnb suggests a significant segment of the market is operating unregistered. Moreover, for the Airbnb database, holiday homes are more concentrated in the districts of, in descending order, Lisbon, Faro and Porto – a different ordering from RNAL. These three districts have 74% of the total number of listings.
DISTRICTS MUNICIPALITIES PARISHES
1 Lisbon – 32.0% Lisbon (Lisbon) – 21.3% UF Cedofeita, … (Porto) – 6.0% 2 Faro – 27.7% Porto (Porto) – 9.4% Sta. Maria Maior (Lisbon) – 5.5% 3 Porto – 12.9% Albufeira (Faro) – 5.2% Misericórdia (Lisbon) – 4.4% 4 Leiria – 5.5% Loulé (Faro) – 4.1% Albufeira (Faro) – 4.3% 5 Setúbal – 5.2% Lagos (Faro) – 3.9% Arroios (Lisbon) – 3.0%
Table 3– Share of holiday homes in Airbnb by districts, municipalities and parishes relative to total (top 5). Source: Airbnb.
4.3. Concentration of holiday homes relative to available lodgings
A concentration measure is not readily available. To compute it, it is necessary to compare a measure of the number of holiday homes in a region relative to the number of total lodgings. For the former, there are two datasets available: RNAL and Airbnb. It is clear that RNAL is not an appropriate measure, if Figure 7 and Figure 8 are compared. These count the number of new
14 registries in time in both platforms. And, since they purport to be capturing the same phenomenon, they should at least be strongly correlated and be similarly affected by shocks. Yet, in Figure 7, a spike of new registrations is evident right after DL128/2014 was published; and the same does not happen in Figure 8. Given that the number of listings in the Airbnb dataset is higher than the number of registries in the RNAL dataset and at least 90% of offerors in Airbnb are active, as seen in section 3.2, there is a strong suggestion of unregistered operation in the short-term housing market. Hence, the RNAL dataset does not seem to be accurately representing the extent of the market. For this reason, Airbnb was the preferred measure for the number of holiday homes in a particular location.
Figure 7 – Number of new registrations in RNAL. The vertical line represents the 3rd
quarter of 2014, the quarter during which DL128/2014 was published and it became known that registration in RNAL was mandatory. Source: RNAL.
Figure 8 – Number of new registrations in Airbnb. The vertical line represents the 4th
quarter of 2014, the quarter during which DL128/2014 came into effect. See section 5 for more information. Source: Airbnb.
15 For the latter measure, the number of lodgings from the INE database from the 2011 census was used. These are only available in 2011 and have a time lag of 3 years. This fact should not be worrisome as meaningful comparisons can still be made, provided there have not been significant changes in the relative number of lodgings between the different regions.
Figure 9 represents graphically the concentration of holiday homes throughout the different municipalities of Portugal and the parishes of Lisbon and Porto. Unlike what happened for sale prices and rents, almost all of continental Portugal is included because the CI dataset is not used. Nonetheless, this figure closely resembles Figure 5 and Figure 6. Holiday homes are mainly concentrated in the municipalities of Lisbon and Porto and the district of Faro. Within Lisbon, they are particularly concentrated in the parishes of Santa Maria Maior, Misericórdia and Santo António. As for Porto, they are concentrated in UF de Cedofeita, Santo Ildefonso, Sé, Miragaia, São Nicolau e Vitória. Again, these two sets are precisely the historical zones in each city which, alluding to section 2, are likely to be severely land constrained.
5. Methodology and results
This work takes advantage of a regulatory change introduced by DL128/2014 in the end of the 3rd quarter of 2014; more specifically, published on August 28th, 2014, and came into effect on November 28th, 2014. This law removed several barriers to entry in the holiday homes market, particularly for small offerors, introduced in Portaria 517/2008 on June 25th, 2008. Two important changes were:
- Before DL128/2014, an offeror, in order to register a holiday home would have to write a formal requirement to the mayor of the municipality and afterwards wait for its approval, a procedure which made the registration process very slow. After DL128/2014, an offeror
16 solely has to communicate his registration to the mayor, which is to be done through RNAL; hence why registration in RNAL became mandatory to operate;
- Before DL128/2014, formal declarations signed by certified technicians had to be delivered during the registration process. These would guarantee that the electrical, gas and hot-water storage systems were in full compliance with the law in effect. Afterwards, they no longer are required.
Indeed, as already seen in section 4.3, registrations in RNAL following the publication of DL128/2014 spiked – Figure 7 –, starting in the 3rd quarter of 2014, when the information on the Figure 9 – Ratio of the number of holiday homes and the total number of lodgings in continental Portugal (on the right), Porto (on the upper-left) and Lisbon (on the lower-upper-left). The scales are determined using the Natural Breaks (Jenks) algorithm from QGIS. Source: Airbnb and INE.
17 obligation of registering in RNAL was published. This, compared to Figure 8, as already mentioned, suggests many holiday homes are operating unregistered. Still, even if the effect is small, it is hypothesized that this legal change reduced the barrier to entry at least to some small offerors who were not keen on operating unregistered. Thus, it increased, on the margin, the attractiveness of providing holiday homes relative to the alternatives. The result is a supply constraint pressure put on the long-term housing market, which results in higher prices for the latter.
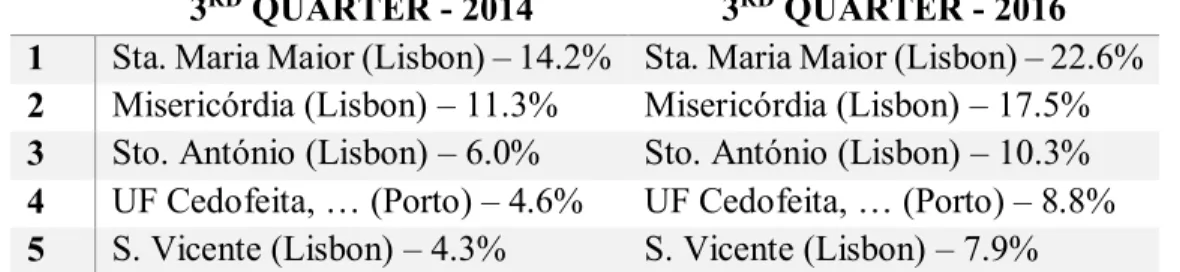
The effect, therefore reliant on already existing land restrictions, should be stronger in regions where a higher share of lodgings was allocated towards holiday homes when the law came into effect; that is, on November 28th, 2014, or rather the 4th quarter of 2014. This concentration measure, already described in detail in section 4.3, is going to be defined as the treatment variable. As seen in Table 4, this treatment variable is continuous.
3RD QUARTER - 2014 3RD QUARTER - 2016
1 Sta. Maria Maior (Lisbon) – 14.2% Sta. Maria Maior (Lisbon) – 22.6% 2 Misericórdia (Lisbon) – 11.3% Misericórdia (Lisbon) – 17.5% 3 Sto. António (Lisbon) – 6.0% Sto. António (Lisbon) – 10.3% 4 UF Cedofeita, … (Porto) – 4.6% UF Cedofeita, … (Porto) – 8.8% 5 S. Vicente (Lisbon) – 4.3% S. Vicente (Lisbon) – 7.9%
Table 4 – Concentration of holiday homes in the 3rd quarter of 2014 and the 1st quarter of 2016 (top 5). This only includes
municipalities in the CI dataset, as seen in section 3.3 and section 4.1.
It is applied regionally, at the level of parish in Lisbon and Porto, and municipality in the rest of the country. Hence, there is no way of opting out of the treatment as, by spatial fixity of the housing market, i.e. accommodations cannot move from high treatment areas to low treatment areas, or vice-versa, as detailed in Smith, Rosen and Fallis (1988).
This does not mean, however, contamination is not possible, namely by not respecting the stable unit treatment value assumption (SUTVA), according to which there cannot be a direct or indirect
18 influence of the treatment units on control ones. Following Rubin (2005) and Baum-Snow and Ferreira (2014), this is a difficult issue to avoid in questions such as the ones posed by this work, as it could be the case that, through general equilibrium effects, high treatment areas contiguous to low treatment areas could affect them. For these cases, the general recommendation is to aggregate to the highest regional level possible. However, this decision carries a serious trade-off – loss of variability. Nonetheless, and most importantly, in this exercise, a violation of the SUTVA would decrease the treatment effect from holiday homes concentration, as a strong treatment would increase not only the price in its region but in another, reducing the difference between the two. As such, the treatment effects estimated below would be lower bounds.
5.1.Differences-in-differences
The common trends assumption requires that no other variables affect differently different regions. The municipalities included in the analysis, as seen in section 4.1, are mainly in the coastal regions of Portugal, which is a subset more similar than the whole set of Portuguese municipalities. Moreover, within Lisbon and Porto, the different parishes are much more likely to be affected by the same variables, meaning they should evolve together in the absence of treatment effects. Lastly, since no controls for individual housing units are used and the treatment does not depend on fixed effects, following Baum-Snow and Ferreira (2014), the individual and regional average treatment effects should be the same.
5.1.1. Estimation for sale prices
ln(𝑠𝑎𝑙𝑒𝑠)𝑟,𝑦,𝑞 = 𝛽𝑦(𝑇𝑟𝑑𝑦𝑑≥14𝑄4) + 𝑓𝑟+ ℎ𝑦 + 𝑔𝑞+ 𝜀𝑟,𝑦,𝑞
In the equation above, there are three separate treatment effects, 𝛽𝑦, one for each year covered by the dummy equaling one for any period after the implementation of DL128/2014, 𝑑≥14𝑄4, that is for 2014, 2015 and 2016. The one of most interest is 𝛽16, as it reflects the latest information on the
19 impact of this regulatory change. The product multiplying with 𝛽𝑦, (𝑇𝑟𝑑𝑦𝑑≥14𝑄4), is the typical interaction term in the differences-in-differences approach, where 𝑇𝑗 is the treatment variable for region 𝑗 in percentage as defined in section 5., with a dummy (𝑑𝑦𝑑≥14𝑄4) depending on both 𝑦 and the after-treatment period to measure the different annual treatment effects. In addition, 𝑓𝑟, ℎ𝑦 and 𝑔𝑞 are the fixed-effects for the different regions, years and quarters, respectively. This specification
follows closely Bertrand, Duflo and Mullainathan (2004).
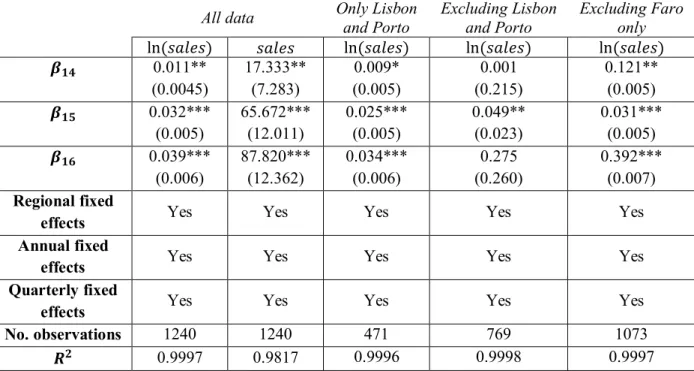
The estimate for 𝛽16 , Table 5 is significant at 1% and indicates that, ceteris paribus, following the regulatory change, for a percentage point increase in the concentration of holiday homes in a region the sale prices of housing in that region increased approximately 4% until 2016.
All data Only Lisbon and Porto Excluding Lisbon and Porto Excluding Faro only
ln(𝑠𝑎𝑙𝑒𝑠) 𝑠𝑎𝑙𝑒𝑠 ln(𝑠𝑎𝑙𝑒𝑠) ln(𝑠𝑎𝑙𝑒𝑠) ln(𝑠𝑎𝑙𝑒𝑠) 𝜷𝟏𝟒 0.011** (0.0045) 17.333** (7.283) 0.009* (0.005) 0.001 (0.215) 0.121** (0.005) 𝜷𝟏𝟓 0.032*** (0.005) 65.672*** (12.011) 0.025*** (0.005) 0.049** (0.023) 0.031*** (0.005) 𝜷𝟏𝟔 0.039*** (0.006) 87.820*** (12.362) 0.034*** (0.006) 0.275 (0.260) 0.392*** (0.007) Regional fixed
effects Yes Yes Yes Yes Yes
Annual fixed
effects Yes Yes Yes Yes Yes
Quarterly fixed
effects Yes Yes Yes Yes Yes
No. observations 1240 1240 471 769 1073
𝑹𝟐 0.9997 0.9817 0.9996 0.9998 0.9997
Table 5 – Differences-in-differences estimates for the effect of the concentration of holiday homes in a region on average sale prices.
Given, for instance, the concentrations presented in Table 4, comparing the two top regions in 2014– Santa Maria Maior and Misericórdia, two parishes next to each other in Lisbon – it would be expected prices in the former to be approximately 11% lower had it had a concentration of
20 holiday homes similar to the latter. Furthermore, considering the national (continental) average concentration is 0.6%, they would be 36% lower had Santa Maria Maior had a similar concentration.
5.1.2. Estimation for rent values
ln(𝑟𝑒𝑛𝑡𝑠)𝑟,𝑦,𝑞 = 𝛽𝑦(𝑇𝑟𝑑𝑦𝑑≥14𝑄3) + 𝑓𝑟+ ℎ𝑦+ 𝑔𝑞+ 𝜀𝑟,𝑦,𝑞
For rents, the estimation procedure is the same as for sale prices, the only difference being the dependent variable.
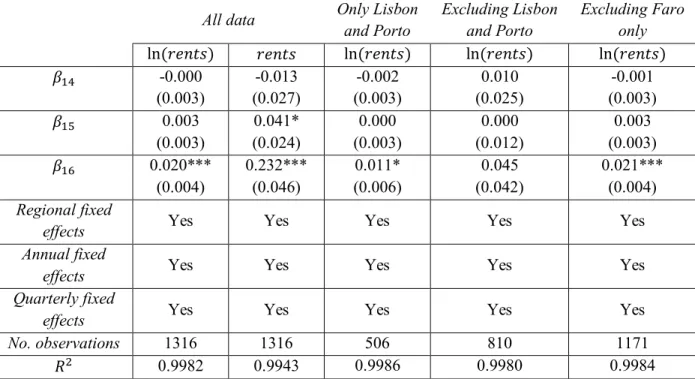
Hence, as seen in Table 6, the estimate for 𝛽16 is significant at 1% and indicates that, ceteris
paribus, following the regulatory change, for a percentage point increase in the concentration of holiday homes in a region the rent values of housing in that region increased approximately 1.8% until 2016.
All data Only Lisbon and Porto Excluding Lisbon and Porto Excluding Faro only ln(𝑟𝑒𝑛𝑡𝑠) 𝑟𝑒𝑛𝑡𝑠 ln(𝑟𝑒𝑛𝑡𝑠) ln(𝑟𝑒𝑛𝑡𝑠) ln(𝑟𝑒𝑛𝑡𝑠) 𝛽14 -0.000 (0.003) -0.013 (0.027) -0.002 (0.003) 0.010 (0.025) -0.001 (0.003) 𝛽15 0.003 (0.003) 0.041* (0.024) 0.000 (0.003) 0.000 (0.012) 0.003 (0.003) 𝛽16 0.020*** (0.004) 0.232*** (0.046) 0.011* (0.006) 0.045 (0.042) 0.021*** (0.004) Regional fixed
effects Yes Yes Yes Yes Yes
Annual fixed
effects Yes Yes Yes Yes Yes
Quarterly fixed
effects Yes Yes Yes Yes Yes
No. observations 1316 1316 506 810 1171
𝑅2 0.9982 0.9943 0.9986 0.9980 0.9984
Table 6 - Differences-in-differences estimates for the effect of the concentration of holiday homes in a region on average rent values.
21 Repeating the same exercise comparing Santa Maria Maior with Misericórdia and the rest of the country, we found similar, albeit less extreme, results: rents would be 5% lower compared to Misericórdia and 21% lower comparing to the national average.
5.2. Discussion and robustness
The first point to be noted is that the effect on rents is roughly half of the effect on sale prices, and that it is less likely, overall, to find a significant effect. This is to be expected if CI is including old contracts in the measurement of rents. Therefore, in the long-run, the effect would be roughly the same but rents take longer to adjust.
The second point is that effects increase over time, particularly for rents. Again, this is to be expected for the same reasons presented in the previous paragraph and because the housing market should take time to adjust to the new conditions set up by the strong presence of holiday homes. The third point is that, at least for sale prices, results seem to be mainly driven by Lisbon and Porto; and there seems to be no nationwide effect on prices, if these two cities are excluded. This alludes to the points raised in sections 2 and 4.3 about the land constraints faced by some parishes in Lisbon and Porto. Moreover, the simple fact data is available up to the level of parishes for these two cities induces more variability, which, in municipalities, may have been hidden when averaging out all their parishes.
Lastly, to clear doubts on the validity of the identification used above, propensity score matching (PSM) was used. Given the continuous treatment variable, the best approach would be to follow Hirano and Imbens (2004). Under slightly different assumptions, they introduce a generalized propensity score, which they use very similarly to the traditional one. However, when applying
22 their methodology for the current work, balancing is never achieved, likely due to the high number of regions, 14%, which have a concentration of 0.
Effect of 𝛽16 PSM DiD ATE (Binary=1, if t.var. > 𝑞0.80) 0.221*** (0.005) 0.209*** (0.044) ATE (Binary=1, if t.var. > 𝑞0.85) 0.198*** (0.005) 0.217*** (0.053) ATE (Binary=1, if t.var. > 𝑞0.90) 0.321*** (0.067) 0.253*** (0.065) ATE (Binary=1, if t.var. > 𝑞0.95) 0.433*** (0.079) 0.309*** (0.075)
Table 7 – Comparison between PSM and Differences-in-Differences when estimating 𝛽16 using a binary variable for possible definitions of the binary variable.
For this reason, using a traditional PSM is preferred, namely for sales where effects were the strongest. Because a binary variable is needed and it is not clear where the cut-off point should be, four scenarios are were tested: the dummy should equal 1 whenever the continuous treatment variable is higher than the 0.80, 0.85, 0.9 and 0.95 quantiles. When comparing the results of PSM with DiD for 𝛽16, the conclusion is that both are significantly different from zero at 1% significance level for all the proposed specifications of the binary variable, leading credence to the point the model is well identified in section 5.1. Matching is done on the number of individuals living in that region whose country of origin is Portugal, Europe (other than Portugal), Africa, Americas, Asia or Oceania, from the INE database described in section 3.4. This strategy is followed because regions with high concentration of holiday homes are the ones which also have the highest population of people of non-Portuguese origin.
6. Conclusion
The purpose of this work was to assess whether the concentration of holiday homes leads to an increase in housing prices. It was found that, with regards to sale prices, there was a 4% increase
23 for each additional percentage point of concentration of holiday homes in a region from the introduction of DL128/2014 until 2016. On the other hand, the effect was about half for rents, showing the possible role long-term contracts might be playing in slowing down the adjustment. It was also found that this effect is localized to the historical sites of the two biggest cities in Portugal, Lisbon and Porto, particularly in their historical centers, which exhibit levels of concentration of holiday homes well above average. This might be due not only to geographical constraints but also to specific preferences on part of the tourists who end exerting extra demand pressure on these regions.
These effects are also not trivial, implying that even within historical centers large discrepancies have arisen solely due to the higher or lower presence of holiday homes. This should not be ignored, as these effects are far from neutral from a distributional point of view.
Lastly, despite distributional concerns, this increase in prices increases incentives for dwellings in historical centers to be renovated and attracts younger people to them, which is a stark contrast with their degradation up until recently.
24 Appendix – sketch of the algorithm to gather data from Airbnb
On the search page of the platform, with the listings on the left and an interactive map whose region of focus affects what is to be listed, and updating them automatically when moved:
1. Define the minimum and maximum latitudes and longitudes, bounding the whole region of analysis on the map;
2. For all pages with listings:
a. Check whether there are more than 300 listings:
i. If yes: zoom-in; move to the upper-left corner of the previous zoom level; repeat the whole algorithm from 1. having the minimum and maximum longitudes as the boundaries of the map at the previous zoom level; and when done move to the center of the map at the previous zoom level and zoom-out;
ii. If not, continue;
b. For all listings displayed on the left not in memory: open the listing’s webpage, save the webpage in disk and save the listing’s ID and location in memory. Change the page of listings when necessary;
3. While the latitude of the upper border of the map is greater than the minimum latitude: a. While the longitude of right border of the map is lower than the maximum
longitude:
i. Move map to the right by a third of the longitudinal distance it covers; ii. Repeat the proceeding in 2.;
b. While the longitude of the left border is greater than the minimum longitude: i. Move map to the left by a third of the longitudinal distance it covers; ii. Repeat the proceeding in 2.;
c. Move map down by a third of the latitudinal distance it covers. References
Baum-Snow, Nathaniel, and Fernando Ferreira. "Causal inference in urban and regional economics". Handbook of Regional and Urban Economics Volume 5A (2015): 3-68.
Bertrand, Marianne, Esther Duflo, and Sendhil Mullainathan. "How much should we trust differences-in-differences estimates?". The Quarterly Journal of Economics 119.1 (2004): 249-275.
Green, Richard K., Stephen Malpezzi, and Stephen K. Mayo. "Metropolitan-specific estimates of the price elasticity of supply of housing, and their sources." The American Economic Review 95.2 (2005): 334-339.
25 Helms, Andrew C. "Understanding gentrification: an empirical analysis of the determinants of urban housing renovation." Journal of urban economics 54.3 (2003): 474-498.
Ihlanfeldt, Keith R. "The effect of land use regulation on housing and land prices." Journal of Urban Economics 61.3 (2007): 420-435.
Rubin, Donald B. "Causal inference using potential outcomes." Journal of the American Statistical Association (2011).
Quigley, John M., and Steven Raphael. "Regulation and the high cost of housing in California." The American Economic Review 95.2 (2005): 323-328.
Saiz, Albert. "Room in the kitchen for the melting pot: Immigration and rental prices." Review of Economics and Statistics 85.3 (2003): 502-521.
Saiz, Albert. "Immigration and housing rents in American cities." Journal of urban Economics 61.2 (2007): 345-371.
Saiz, Albert. "The geographic determinants of housing supply." Quarterly Journal of Economics 125.3 (2010).
Smith, Lawrence B., Kenneth T. Rosen, and George Fallis. "Recent developments in economic models of housing markets."