Hatice Kirkici
Risk Perception in Micro Enterprises in
Portugal
Master’s Thesis
Industrial Engineering and Industrial Management
Work done under the guidance of
Professor Pedro Miguel Ferreira Martins Arezes
DECLARATION Name: Hatice Kirkici
E-mail: [email protected] Telephone: 934605393 Identity Card Number: 52288GH79
Title of dissertation: Risk Perception in Micro Enterprises in Portugal Advisor: Professor Pedro Miguel Ferreira Martins Arezes
Conclusion year: 2019
Name of the Master: Industrial Engineering and Industrial Management
Universidade do Minho, ___/___/______ Signature:
I hereby declare having conducted this academic work with integrity. I confirm that I have not used plagiarism or any form of undue use of information or falsification of results along the process leading to its elaboration.
Acknowledgements
Foremost, I would like to express my sincere gratitude to my advisor Prof. Pedro Arezes for the continuous support of my study, for his patience, motivation, and immense knowledge. His guidance helped me in all the time of research and writing of this thesis.
Besides my advisor, I would like to thank my family for their support and motivation. Especially for my parents because they gave me the confidence to start a master’s degree abroad. They helped me to believe in myself during this period even though they are far from me.
I thank my fiancé Rogerio Goncalves for his patience and all the support he gave me from beginning to end.
Last but not the least, I would like to thank University of Minho, Department of Production and Systems and its all professors who contributed on my education.
Abstract
The detection, assessment and reduction of risks is one of the most important issues of the role assigned to Occupational Health and Safety practitioners. Health and safety in micro-enterprises (<10 employees) is a critical issue due to their lack of resources and the limited knowledge on the subject. Micro-enterprises comprise a major percentage of the existent enterprises in a small economy such as the Portuguese economy. The present study is based on survey which was developed based on a previous literature review about the analysed topics. The main purpose of the present study was to analyse risk perception of micro-enterprises’ workers and small-medium enterprises’ workers in Portugal and by comparing the results according to the size of the enterprises. Results showed that micro-enterprises workers perceive higher risk comparing with small and medium enterprise workers. The study also found that risk perception has a positive and statistically significant association with previous accident experience, workload and stress. Additionally, safety climate measure had a negative impact on risk perception. Keywords: Risk perception, Micro-enterprises, Occupational safety, Portugal
viii
Resumo
A deteção, avaliação e redução de riscos é uma das questões mais importantes do papel atribuído aos profissionais de segurança e saúde no trabalho. A segurança e saúde em microempresas (<10 funcionários) é uma questão crítica devido à falta de recursos e à limitação de conhecimento sobre o assunto. As microempresas constituem uma percentagem importante das empresas existentes numa economia pequena como a economia portuguesa. O presente estudo baseia-se num questionário desenvolvida a partir de uma revisão prévia da literatura sobre os tópicos analisados. O objetivo principal do presente estudo foi analisar a perceção de risco dos trabalhadores de microempresas e trabalhadores de pequenas e médias empresas em Portugal e comparando os resultados de acordo com o tamanho das empresas. Os resultados mostraram que os trabalhadores das microempresas têm maior precessão do risco em comparação com trabalhadores de pequenas e médias empresas. O estudo também descobriu que a perceção de risco tem uma associação positiva e estatisticamente significativa com a experiência de acidentes anteriores, carga de trabalho e stress. Além disso, a medição do clima de segurança teve um impacto negativo na perceção de risco.
I
NDEXAcknowledgements ... v
Abstract... vii
Resumo... viii
Index of Figures ... xi
Index of Tables ... xii
1. Introduction ... 1
1.1. Framework and Scope of the Project ... 1
1.2. Objective and Motivation ... 2
1.3. Dissertation Structure ... 2
2. Literature Review ... 5
2.1. Micro Sized Enterprises ... 5
2.1.1. Definition ... 5
2.1.2. Role in the economy ... 6
2.1.2.1. Micro Enterprises all around the world ... 8
2.1.2.2. Micro Enterprises in Europe and Portugal... 8
2.2. Occupational Health and Safety (OHS) in Micro Enterprises ... 13
2.3. Risk Perception ... 15
2.3.1. Definition ... 15
2.3.2. Tools for assessment... 16
2.3.3. Risk perception in SMEs ... 18
3. Methodology ... 21
3.1. Sample ... 21
3.2. Questionnaire development ... 21
3.3. Data Analysis ... 24
4. Results and discussions ... 25
4.1. Preliminary analysis ... 25
4.2. Risk perception analysis ... 28
4.2.1. Risk perception and enterprise size ... 28
4.2.2. Risk perception and accident experience ... 29
4.2.3. Risk perception and work type ... 30
x
4.2.5. Risk perception and stress ... 31
4.2.6. Risk perception and demographic characteristic ... 32
4.3. Occupational safety analysis ... 33
5. Conclusion ... 35
Bibliography ... 37 Appendix ... a1 Appendix 1: Demographic characteristics ... a1 Appendix 2: Perceived job risk (%) ... a2 Appendix 3: Safety climate at work (%) ... a2 Appendix 4: Stress and workload (%) ... a2
Index of Figures
Figure 1: Employment share, by enterprise size class reproduced from EU-27, 2005 ... 9
Figure 2: Share of micro-enterprises (fewer than 10 persons employed) in total employment reproduced from EU-27, 2005 ... 10
Figure 3: Enterprise size distribution ... 25
Figure 4: Activity at work ... 26
Figure 5: Work field of respondents ... 26
Figure 6: Accident experience ... 27
xii
Index of Tables
Table 1: European definition of SMEs ... 5
Table 2: Key indicators for enterprises in the non-financial business economy (reproduced from EU-27, 2005). ... 9
Table 3: Key indicators for enterprises in the non-financial business economy reproduced from, EU-28, 2016 ... 11
Table 4: Key indicators for enterprises in the non-financial business economy reproduced from EU-28, 2017 ... 12
Table 5: Key indicators for enterprises in the non-financial business economy of Portugal, EU-28, 2017 ... 13
Table 6: Questions related demographic characteristics of respondents ... 22
Table 7: Items asked to evaluate safety climate at work and risk perception ... 23
Table 8: Items asked to evaluate Workload and Stress ... 23
Table 9: Reliability Statistics ... 28
Table 10: Descriptive Statistics ... 28
Table 11: Risk perception and enterprise size correlation ... 29
Table 12: Risk perception and accident experience correlation ... 30
Table 13: Type of work and risk perception correlation ... 30
Table 14: Workload and risk perception correlation ... 31
Table 15: Stress and risk perception correlation ... 31
Table 16: Risk Perception and demographic characteristics correlation ... 32
List of Abbreviations, Acronyms and Acronyms MSEs – Micro and Small Enterprises
EU – European Union
GDP– Gross Domestic Product
SMEs–Small and Medium Sized Enterprises OHS –Occupational Health and Safety
1
1. Introduction
1.1. Framework and Scope of the Project
Micro enterprises are the businesses which employ fewer than 10 persons and their annual turnover is less than €2 Million (European Commission, 2005a).
Micro and small enterprises (MSEs) count for nearly 99% of enterprises in the European Union (EU) and employ nearly 50% of EU workers. Given these numbers, and the significant role such enterprises play in society, as well as in the EU economy, the importance of effective means to prevent harm to the health and safety of workers in these companies should be highlighted (Walters, Wadsworth, Hasle, Refslund, & Ramioul, 2018). Microbusiness types are different and various and reflect the wealth of economy at the smallest level. From a woman who makes firemen`s uniforms to a veterinary clinic, to a cookie maker, to a book sales representative, microenterprises comprise a very large variety of business types, while most are services or in the retail sector (Clark & Huston, 1993).
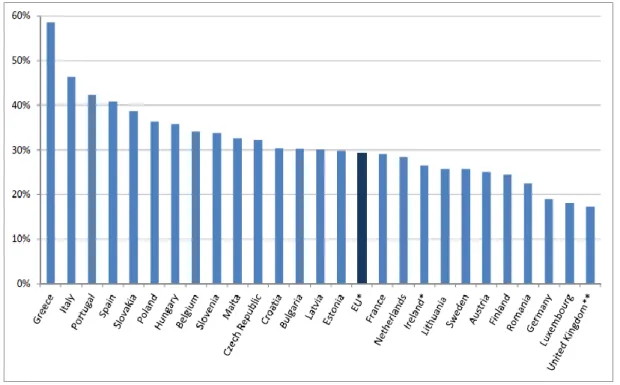
Portugal is the 3rd country in the EU where there is a greater percentage (42.3%) of people employed in companies with less than 10 employees, 12.1% above the European average. According to Eurostat data, Portugal, which has 95.2% of micro-enterprises, is at the top of the EU countries in the ratio of people employed in micro-enterprises, just behind the Greek and Italian economies (European Commission, 2017).
Management of health and safety activities in micro-enterprises is a crucial issue because of the relatively high level of injuries within this type of companies. It is also an under-researched area in the international safety literature (Hadjimanolis, Boustras, Economides, Yiannaki, & Nicolaides, 2015).
Micro-enterprises are considered “hard to reach” by occupational health and safety professionals. They are too countless to be routinely inspected, their workers are not organized, and their bosses and managers are often perceived to place low priority on health issues and safety programming (Eakin, 1992).
Safety training at work is a main issue. Effective training should include training workers the important technical skills for performing their tasks and also to assure that skills are carried over to the job in a safe and healthful manner (Goldenhar, Moran, & Colligan, 2001).
One way to increase preventive activity in occupational health and safety is workers’ participation in the organization of health and safety at the workplace level. The workers involvement in health and safety will have a positive effect on the work environment (Walters, 1996).
The perceived risk expresses workers’ perceptions of the working environment as risky or hazardous (McGonagle & Kath, 2010). Perception of risk is relevant to safety because it may affect the employees’ behavior and behavior can exert an influence on the probability of accidents. Therefore, the probability of accidents may be influenced by risk perception. When employees feel unsafe, this may cause workload and strain, which cause them to take chances. However, risk perception is not necessarily a significant predictor of risk behavior. Perception and behavior may as well be independent variables (Rundmo, 1996).
1.2. Objective and Motivation
On the contrary to the general perception, a big part of jobs in Portugal are companies with less than 10 people employed which called micro-enterprises(European Commission, 2018). However, the vast majority of fatal work accidents occurred with workers from micro-enterprises (1 to 9 workers) or with self-employed workers (39.4%). In large companies, with 250 and more people in service, they recorded the lowest percentage of total fatalities, 12% (ACT, 2017).
The main purpose of this research is to analyze risk perception of micro-enterprise workers and compare the results with workers from bigger enterprises. This work aims to explain if there is a different risk perception among the workers of the micro enterprises and SMEs in Portugal, additionally it analyzes employee’s opinions about their work conditions and manager concerns about Occupational Health and Safety (OHS)
The objectives of this study:
o Understand how micro enterprise workers perceive risk o Understand how SMEs workers perceive risk
o Define Micro and SMEs employee’s opinion about OHS related conditions at work o Analyze several factors (stress, workload) effect on risk perception
1.3. Dissertation Structure
This work is divided by the 5 chapters. In this chapter introduction, general framework and scope of the project is presented. Thereafter, objective and motivation of the work is presented respectively.
In the second chapter is presented the various theoretical concepts related to the developed work, based on the review of literature. In the third chapter is presented methodology of the work the adopted strategy throughout the research process is exposed. Here the research method used to collect the necessary elements for the development of the intended model is showed. In the following chapter is presented results and discussion of the work. This chapter was reserved for the analysis and discussion of the survey
3
results. The detailed tables and graphs from analyses were presented in this chapter. In the last chapter is presented conclusions of the study, includes a perspective of the work carried out, the main conclusions and some suggestions for further researches are talked in this chapter.
2. Literature Review
2.1. Micro Sized Enterprises
2.1.1. Definition
A micro-enterprise, with the correct meaning, is a very small business ran by a low-income individual with a loan (Banerjee, 1998).
Micro enterprises are those businesses able to provide employment less than ten employees and have an asset of less than €11,000 (Yahaya, Geidam, & Usman, 2015).
Meanings of small and micro-enterprises can be based on number of employees, capital investment, product or service cycle, net value, sales volume, range of markets, or amount and type of energy used in production (Hyman, 1989).
As defined by the European commission;
• micro enterprises: with less than 10 persons employed; • small enterprises: with 10-49 persons employed;
• medium-sized enterprises: with 50-249 persons employed;
• small and medium sized enterprises (SMEs): with 1-249 persons employed (European Commission, 2005).
• Table 1: European definition of SMEs
Company category Employees Turnover Balance sheet total
Micro Sized <10 < €2 million < €2 million
Small Sized <50 < €10 million < €10 million
Medium Sized <250 < €50 million < €43 million
Microenterprises, that is businesses have less than 10 employees, can be supplied with a series of small credits that let them to start or expand productive activities and thus increase incomes and escape poverty. Although the term microenterprise was in common use worldwide by the late 1970s, it came into local use about a decade later. Traditionally, the business sector has been divided into three groups: large, medium, and small (Christy, Wenner, & Dassie, 2000).
Micro-suppliers are simply local people using their gifts and capabilities creatively to deliver support and services that benefit other local people and their community. They work on a very small scale, typically delivering their service directly with the help of a small number of other people working as employees or volunteers (Lockwood, 2013).
Even though the descriptions vary according to the country context, it is mostly agreed that the informal sector, whether rural or urban, involve small sized and micro-enterprises producing and distributing goods and services in unregulated but vying markets. These enterprises are generally independent, largely family owned, employ low levels of skills and technology, and are highly labor intensive. These micro-enterprises are focused mainly in low-income low productivity activities, especially in minor trades and services (Harvie, 2003).
Microenterprises compose opportunities for clients to be involved in productive self-employment which will restore self-respect, facilitate self-reliance and above all transform a condition of dependency to one of self-sufficiency in which clients no longer consume scarce public resources but instead contribute positively to their own and the community’s wellbeing (Raheim, 2015).
Micro-enterprise growth projects prove that small sized businesses, such as designer dress shops, desktop publishing companies, flower shops, recycling services, and grocery stores, allow low-income individuals to gain economic self-sufficiency all around the world. Sometimes, they generate savings and home ownership and create employment opportunities for others. Additionally, there are numerous psycho-social and political benefits of micro-enterprise ownership, such as confidence, esteem, family stability, and authorization (Banerjee, 1998).
2.1.2. Role in the economy
Micro and small enterprises (MSEs) have been recognized as a main source of employment and income in many Third World countries (Mead & Leidholm C., 1998).
Micro companies are also a source of skilled workforce and have an important role in creating competitive industrial base (European Commission, 2005).
Micro enterprises are important for all economies in the world, but specifically for those in developing countries and, within that wide group, particularly in those economies with major employment and income distribution challenges. Small and Micro enterprises are the “engine” of growth, essential for developing competitive and efficient markets and decreasing of poverty mainly in developing countries (Fan, 2003). Across of diminished employment choices, the probability of running one’s own business in one’s own community seems to offer hope to some of the unemployed or underemployed. There is evidence that small businesses run by self-employed people, or very small businesses called microenterprises, are an important option for a section of the unemployed and working poor population today. Microbusiness types are different and various and reflect the wealth of economy at the smallest level. From a woman who makes firemen`s uniform to a veterinary clinic to a cookie maker to a book sales representative,
7
microenterprises comprise a very large variety of business types, while most are service or retail sector (Clark & Huston, 1993).
Micro-enterprises have strong ability of adapting to changes of market requests; micro-enterprises have clear asset rights and certain authority and tasks; the organizational structure of micro-enterprises is flexible and easy to manage; and with small-size but delicate business, micro-enterprises are able to provide closely to customer demands (Lin & Chang, 2011).
In the 1950s and 1960s. economists and policymakers suggested large sized, capital intensive industries because those industries generated more nonwage income, which was thought to increase investment rates (Hull, 1988). Micro-enterprises were generally seen as marginal, inefficient activities that did not contribute much to local development, avoided taxes, and had little potential for growth or development of entrepreneurial capacity (Hyman, 1989).
In many developing countries, micro and small sized businesses were discouraged either directly or indirectly by governments. Since the 1970s, this inclination has inversed itself and ever-growing number of scientists, policy-makers, and members of the assistance community have begun to see the potential of this sector as an engine of growth (McPherson, 1996).
MSEs are widespread in most developing countries. Although they have large numbers, MSEs are often seen as low-income activities that do not contribute to the economy (Daniels, 1999).
Since the early seventies there has been a growing consciousness that small sized enterprises are important for economic growth. Small sized enterprises are seen as the main source of employment, alleviating poverty and improving equality. In the 1980s seen as densification of this interest and a consequent enlargement of policy into the sector of micro-enterprises, following the discovery of widespread entrepreneurial activity in both developed and developing countries (Gomez, 2008).
Efforts of the micro enterprise have focused primarily on economic development, although ignoring the social and environmental consequences can endanger success (Vargas, 2000).
All around the world, micro-enterprise development attempts indicate that they are a favorable response to poverty. Micro-enterprise evolvement is encouraging new approach for social workers to help impoverished communities invigorate themselves. Micro-enterprises not only offer an empowering option to many people whose other alternatives are unemployment or low-wage, dead-end jobs, also they have the power of reviving regional economies by catering services and locally required products, thereby rebuilding communities from within. In this way, micro enterprises are a strong move against the face of ostensibly compelling poverty in disintegrating communities. In the worldwide, social workers make an
effort to reduce poverty can merge micro-meso and macro strategies with micro-enterprise development initiatives to build more self-contained communities (Banerjee, 1998).
2.1.2.1. Micro Enterprises all around the world
According to previous studies in both developing and developed countries, the greater part of the enterprises are Micro and Small Enterprises (Nichter & Goldmark, 2009).
Investigations show that in five African countries (Botswana, Kenya, Malawi, Swaziland, and Zimbabwe) MSEs generate approximately twice the level of employment that registered, large-scale enterprises and the public sector do (Mead & Leidholm C., 1998).
In many Latin American countries, micro and small businesses employ more than half of the working population. The Micro enterprises represented 54% of total employment in Latin America in the mid-1990s (Orlando & Pollack, 2000). Most microenterprise workers are self-employed microentrepreneurs. Examining enterprises with fewer than 10 workers found that they generated 58% of total employment in Paraguay, 54% in Mexico, and 53% in Bolivia (ILO, 2003).
The Microenterprises create significant employment and economic outcome in many countries. Their portion of overall employment inclined to be higher in developing countries, which are typically more focused on small-scale production (Tybout, 2000).
According to research MSEs contribute around 31% of overall GDP (Gross Domestic Product) in the Dominican Republic, 13% in Kenya, and 11% in Pakistan. Official statistics may underestimate MSE´s contribution to GDP—for example, some experts argue that Kenyan MSEs actually generate 40% of GDP, not 13% (Daniels, 1999).
2.1.2.2. Micro Enterprises in Europe and Portugal
Micro-enterprises, in additionally small and medium sized enterprises (SMEs), are main sources of the economy of the European Union (EU), creating jobs and contributing to economic growth
(Schmiemann, 2008).
The analysis of European commission about SME performance report focuses on the non-financial business sector. This broad sector consists of all sectors of the economies of the EU Member States, except ‘financial services’, ‘government services’, ‘education’, ‘health’, ‘arts’, ‘culture’ and ‘agriculture, forestry, and fishing’ (European Commission, 2017).
According to Eurostat data in 2005 (Table 2) there were nearly 20 million enterprises active within the EU-27 (the 27 European Union countries) in 2005 in the non-financial business economy and 99.8% of this enterprise were SMEs. The overwhelming majority of SMEs were Micro Enterprises (91.8%).
9
However, its relative importance was lower in terms of its contribution to providing work and wealth; while 67.1% of the non-financial work economy labor force in the EU-27 was used as an SME, 57.6% of the value added of the non-financial business economy was produced by SMEs (European Commission, 2005).
Table 2: Key indicators for enterprises in the non-financial business economy (reproduced from EU-27, 2005)
In the EU-27 there was an average of 39.3 SMEs within the non-financial business economy per 1 000 inhabitants in 2005. The highest densities of SMEs were recorded in the Czech Republic (86.0%) and Portugal (80.5%), followed by the three Mediterranean countries of Greece, Italy and Spain. At the other end of the range, Romania and Slovakia recorded the lowest density of SMEs per 1 000 inhabitants (18.9 and 7.7 respectively).
Micro enterprises employed more people than any other size class in a number of service sectors (Figure 1) This pattern was particularly pronounced for real estate services and the hotels & restaurant, construction, where an absolute majority of the workforce was found working in micro enterprises.
Based on Eurostat analysis the distribution of employment among the Member States indicate that a relatively high rate of the non-financial business economy labor force was employed in micro enterprises in many of the southern Member States, e.g. Greece, Italy, Portugal, Cyprus and Spain, as in Poland. There was however a significant variation between Member States, as the relative contribution of micro enterprises to non-financial business economy employment sequenced from a high of 56.5% in Greece to a low of just 13.0% in Slovakia; this range was larger than that recorded for either small or medium-sized enterprises, where the contribution of each size class to total employment was quite equal across countries (European Commission, 2005).
In 2012, of the 22.3 million enterprises in the EU’s non-financial business economy, a big majority (92.7%) were microenterprises with 29.2% of employment, 7.1% were small and medium enterprises with 38.0% of employment, and 0.2% were large enterprises with 33.0% of persons employed. 2.3 million enterprises were created in 2012 among the EU. Most of enterprises (70.8%) had none employees. These single entrepreneurs signified 46.9% of all persons employed in newly-born enterprises.
Figure 2: Share of micro-enterprises (fewer than 10 persons employed) in total employment (reproduced from EU-27, 2005)
In all EU Member Countries, the big majority of enterprises in the non-financial business economy were micro enterprises (less than 10 persons employed), with the biggest share being recorded in Greece (96.7%), Slovakia (96.5%), the Czech Republic (96.0%), Poland and Portugal (both 95.2%), Italy (94.9%) and France (94.8%). The share of small enterprises (10 to 49 persons employed) was below 10% in every
11
Member State, except Germany (14.7%), Austria (10.9%), Luxembourg (10.6%) and Romania (10.2%) It is also in these four Member Countries that the highest rate of medium enterprises (50 to 249 persons employed) were surveyed. For large enterprises (at least 250 persons employed), the share was 0.5% or lower in all Member Countries for which data are available. According to available data of Eurostat in 2012 in the majority of the EU Member States micro enterprises have the largest share of persons employed with proportions above 40%. Numbers for Southern EU member States: Greece (58.6%), Italy (46.4%), Portugal (42.3%) and Spain (40.8%). Whereas, less than 1 person out of 5 was employed in a micro-enterprise in the United Kingdom (17.3%), Luxembourg (18.0%) and Germany (19.0%). At level of Europe, large enterprises were the first employer (with 33.0% of all individuals employed), followed by micro-enterprises (29.2%), small enterprises (20.8%) and medium enterprises (17.2%) (Eurostat, 2015). According to annual report of EU commission in 2016 micro enterprises are certainly the most common type of SME, with the 93.0% of all enterprises and 93.2% of all SMEs in the non-financial business sector (Table 3). In addition to this, micro enterprises account for only 29.8% of total employment in the nonfinancial business sector, while small enterprises accounted for 20.0% and medium-size enterprises accounted for 16.7% of total employment. On the contrary to the very uneven distribution of the number of enterprises and employment among the three SME size classes, their influence is roughly equal from the point of value added, ranging from 17.8% (small enterprises) to 20.9% (micro enterprises) (European Commission, 2017).
According to annual report of European commission in 2017 Micro Enterprises are by far the most common type of SME, calculated as 93.1% of all enterprises and 93.3% of all SMEs in the non-financial business sector. On the other hand, micro SMEs accounted for only 29.4% of total employment in the non-financial business sector, while small and medium-sized SMEs accounted for 20.0% and 17.0% respectively of total employment (Table 4). In contrast to the uneven distribution of the number of enterprises and employment across the three SME size classes, their contribution is broadly equal in terms of value added, ranging from 17.6% (small SMEs) to 20.8% (micro SMEs) (European Commission, 2018).
Table 4: Key indicators for enterprises in the non-financial business economy (reproduced from EU-28, 2017)
According to Eurostat data in 2004 and 2005 there are nearly 81 SMEs per 1000 inhabitants in Portugal, which is more than duplicate the EU-27 average of almost 40. According to this, SMEs in Portugal have an extremely high importance for the local labor market compared to other EU Member States. More than four out of five jobs rely on SMEs and the contribution to the overall economy in terms of value-creation also goes highly beyond the EU average. In this regard, a specific role is attributed to the micro enterprises, accounting for 43% of all individuals employed (EU-average fewer than 30%) (European Commission, 2005b). In 2005, micro enterprises accounted for 92% of all EU companies, employing 30% of all people and accounting for 21% of total value added. In Portugal, micro-enterprises in the non-financial sector are even more pronounced, accounting for 93% of all companies, corresponding to 42.7% of the total employed and 30.6% of the value added (Hespanha, 2009).
SMEs play a significant role in the non-financial business economy in Portugal, calculated as 68.5% of value added and 78.1% of employment. These predictions are more than 10% higher than the related EU averages. In contrast, on average Portuguese SMEs employ about 3 people, which is about one less person than the EU average. The two largest SME sectors, manufacturing and wholesale and retail trade
13
together compose approximately half of SME employment and value added. Yearly productivity of Portuguese SMEs, calculated as value added per capita employed, is roughly EUR 21 500, which is half of the EU average. Portuguese SMEs are still recovering from the economic crisis. SME value added received a low point in 2012, but then consistently increased to 16.7% by the end of 2012-2016. However, in 2016, SME value added has remained 8.3% under its 2008 level. Employment recovery has been even slower for SMEs, with the first signs of growth recorded only since 2013, leading to an overall rise of 6.6% in 2013-2016. Even though employment was still 14.8 % lower in 2016 than its pre-crisis level, the most current records for 2015-2016 are positive, with growth in SME value added and employment of 3.8% and 3.5% respectively (European Commission, 2018).
Table 5: Key indicators for enterprises in the non-financial business economy of Portugal (reproduced from EU-28, 2017)
2.2. Occupational Health and Safety (OHS) in Micro Enterprises
Occupational Health and Safety include the social, mental and physical welfare of workers (Zoller, 2003). Micro enterprises spend less time on health and safety issues, they are disadvantaged in organizational health and safety encouragement due to their business size and face special challenges in the provision of health and safety (HSE, 2005).
Work carry out a fundamental function in our lives, since we generally spend an average of eight hours a day in the workplace. For this reason, labor environments should be safe and healthy, something that is most of the times not the case for too many workers. Every day occur many examples of workers all over the world who exposed to risks to their health, including dust, dangerous fumes, noise, vibrations and extreme temperatures (Montero, Araque, & Rey, 2009).
In the industrialized world, the incentive of safety in the workplace make an effort to improve the quality of work life and avoid occupational injuries. In spite of perpetual improvements in working conditions over
recent decades, the counts of accidents at work continues to be an essential problem (Barling & Frone, 2004).
Industrialization generated an immediate and increasing need for labor and caused the increase of pathetic working conditions in which men, women and children risked life and limb to earn their keep. The inexperience of the workforce and the ignorance of employers concerning what we now call OHS inescapable took a brutal toll, legislators were forced to interfere under the public pressure (Badri, Boudreau-Trudel, & Souissi, 2018).
OHS is an extensive discipline that concerns;
• the encouragement and maintenance of the highest level of physical, mental and social well-being of workers,
• the avoiding of departures from health caused by working conditions, • protection of workers from health hazards
• adaptation of the professional environment to the physiological and psychological abilities of the workers (Montero et al., 2009).
There are very few researches on micro enterprises and the present articles focus mostly on their unique features in terms of workplace safety management. Micro enterprises present various unique characteristics relevant to the limitations in service or product, immense economic pressure, limited capabilities to enter global markets, family-oriented traditions, ‘‘poor management’’ styles, limited access to training and inadequacy to combine in the use of safety consulting. Management of health and safety in micro-enterprises (fewer than 10 employees) is a serious issue because of the high level of injuries in such enterprises. In the same time under-researched area in the international safety literature. Promoting of training, risk evaluation, and safety policy formulation in micro enterprises is fundamental in order to improve their workplace safety (Boustras & Hadjimanolis, 2015).
The smaller enterprises are more vulnerable and less organized in relation to OHS than their larger counterparts (20-49 employees). It indicates that in smaller size of a company the owner and management (often the same person) do not feel they have enough time and resources to handle OHS matters, since they prioritize the daily operation of the enterprise above any other issues. The outcome of this a general lack of a systematic approach to solving and identifying problems and challenges in the work environment. Often such enterprises do not have — or do not prioritize — the necessary resources to address these problems and challenges (EU-OSHA, 2018).
15
According to the Health and Safety Executive report micro enterprises spend less time on health and safety issues, they are deprived in organizational health and safety encouragement because of their business size and face specific challenges in the provision of health and safety (HSE, 2005).
2.3. Risk Perception
2.3.1. Definition
The meaning of risk is “uncertainty about and seriousness of the consequences (or outcomes) of an activity with respect to something that man value,” and risk perception express individuals’ subjective judgment of the risk (Aven & Renn, 2009). Occupational risk perception express employee’s perception regarding the amount of risks at job (Basha & Maiti, 2013).
Risks involve all aspects of accidental damages that may cause any wastage of the establishment's, society’s and environmental assets. The term "risk" has a broad sort of interpretations. In one sense, risk is explicated to "mean possibility of an unwanted incident". It's an expression of the possibility that something unpleasant might happen (Zimolong & Elke, 2013).
Risk is a term that mostly used by occupational health and safety specialists. In fact, the occupational health and safety specialists should most essentially be experts of risk. They have tools and methods for detecting the possibility of harm to individuals at work, and for determining its probability. (Saari, 1995) Perceived risk particularly mentions chronic exposure to occupational health and safety risk, each provides subjective representation and insight into the estimation of risk (Mclain, 1995).
Risk perception is consisted of a subjective evaluation of the possibility of experiencing an accident or a health injury occasioned by exposure to a risk source and moreover emotions related to the source (T. Rundmo, 2000).
The perceived risk expresses workers’ perceptions of the working environment as risky or hazardous. At first sight, workers´ perceptions of risk might appear to be unavoidable or innate in some work environments (e.g., nuclear power plants, coal mines). Nevertheless, the risk can be managed by organizational leaders, for example, by providing appropriate equipment for workers, by maintaining effective safety regulations and by promoting a positive safety environment. In these cases, workers may still feel relatively safe (McGonagle & Kath, 2010).
Risk perceptions — or a people´s perceived sensitivity to a threat — are an important constituent of many health behavior change theories. Risk perceptions are often targeted in health behavior change interferences, and recent meta-analytic proof proposes that interferences that successfully engage and change risk perceptions create subsequent increases in health behaviors (Ferrer & Klein, 2015).
Since risk perception is subjective and workers rely on a range of values, concerns, or knowledge when they perceive risk, they are likely to use different methods to assess risk. Risk perception is a complicated, very determined phenomenon, same can be said for each significant aspect of behavior (Slovic, Fischhoff, & Lichtenstein, 1982).
It is critical to understand how risk is perceived, because managerial strategies are based on risk assessment results. On one hand, any deviation between the subjective assessment of risk and the truth can cause serious negative outcomes. In other respects, differences in the way risk is perceived can also provide chances for cooperation (Weber & Hsee, 1998).
2.3.2. Tools for assessment
Perceived risk is multidimensional and can be measured by scales reflecting the unique characteristics of the risk source (Torbjørn Rundmo & Nordfjærn, 2017).
In previous studies, age differences and risk perception relation were determined. It is believed that older people are likely to be more familiar with the work as they tend to have higher experience. According to previous research young people assess dangers to be fewer than elder and the former also take more risk (Ian Glendon, Dorn, Davies, Matthews, & Taylor, 1996).
The literature demonstrates the glance that the different sexes evaluate risks differently, with men usually perceiving lower risks than women. According to a study about gender differences in risk perception developed by Gustafson (1998), men and women possibly do not concern themselves with the same type of risk and the concept of gender-specific risks refers that men and women do not only perceive the same risks little differently, but also perceive different risk. What seem to be the same risks might have different meanings for women and men.
Another factor for assessment of risk perception is education. A study about psychometric attitudes to risk developed by Savage (1993) determined that people with low levels of education and income had more dread of hazards, possibly as a result of bigger perceived exposure to it. The higher the level of education, the less is the risk usually judged to be. The research about Expert and Lay Judgments of Chemical Risks (Slovic, Paul Malmfors, Torbjorn, Kraus, 1992) investigated differences in college educated and non-college educated participants. Generally, participants with a college degree had more affirmative attitudes to chemicals, more appreciation of the medicating role of dose and exposure, and less worry about risks. In this study, the college-educated participants seemed to be somewhat more similar to the experts than the non-college educated participants were.
Experience is another associated element with risk perception. Experience refers the amount of time employees engaged in their job. It is predicted that experienced employees might perceive their jobs more
17
correctly than an inexperienced employee. In the same time, experienced employees are likely to be exposed to a hazardous environment for a longer amount of time that might increase the likelihood of exposure to an injury. The concept of recognition and perception of hazards indicates that experience must have a negative relationship with the occupational accident (Basha & Maiti, 2013). The research about Occupational Injures and work experience analyzed each subject assigned to one of three experimental groups depending on their work experience, Incumbent (employees with a minimum of one year experience in work), Recent Hire (employees with more than 3 months but less than one year of work experience in the work), and Probationary (new employees with less than three months of experience) (Keyserling, 1983).
A study about health and safety risk in the work environment (Mclain, 1995) identifies and measures various types of risk interpretation associated with workplace health and safety conditions. These types involve workers’ concern about probable physical or psychological harm, the probability of their being harmed, the distribution of risk exposure in a work group, and the economic value of working a hazardous job. This study found out that health and safety risk might threatens an individual´s not only physical also psychological health.
Safety training positively changes the perception of risk, physical condition of the workplace, safety commitment, attitudes toward safety, and avoiding of the injuries. Related to this people who receive sufficient training on safety procedures feel more authorized to address the hazards that they come across (Leiter et al., 2009).
An employee who experienced an accident might evaluate the risk differently after the accident than before. However, the likelihood of an accident is no greater than it was before. Rundmo (1992) developed a study with offshore oil personnel and showed that person who had suffered an accident, felt less safe than those who had not experienced any accident. Another study, from Johnson & Tversky(1983), suggested that people who have experienced accident or witnessed an accident which involve serious damage or death relevant with the event might increase their perception of the risks of the work. However, it is not clear how long such effects will last.
Risk perception refers to a worker’s perception and anxiety about his or her probability of suffering a work-related accident or illness (Oah, Na, & Moon, 2018). Research about Safety climate, attitudes and risk perception in Norsk Hydro suggested that risk perception can be separated into one cognitive component and one emotional one. Accordingly, the questions which asking employees to assess the probability of an accident or health-injury, ask for an assessment which is mainly based on cognition and rational
judgements of risk perception. Questions which asking them about their worry and whether they feel safe or unsafe measures their emotional component (Rundmo, 2000).
Most of the injuries happen because workers do not comply to safety procedures. Favorable safety climate causes to bigger control over risks and more certain self-reporting of occupational injury. A strong safety environment encourages staff to be more responsible for their safety performance. According to researchers, a weak safety culture prevents strict implementation of safety procedures (Rundmo, 1996). Workers' attitude towards safety at work may also affect risk perceptions (Mohamed, Ali, & Tam, 2009). Applying proactive risk management enables employees to feel that the organization maintains their health and safety at the workplace, which causes a decrease in their risk perception a favorable safety climate as an organizational factor may reduce workers’ risk perceptions (Oah et al., 2018).
A workload may cite to different relevant structures such as job demands and job overload. On the other hand, a workload arises from mental processes during performing tasks, depending on the worker’s capabilities and the job requests. If employees have excessive workloads or hard tasks beyond their skills and capabilities, this can be a stressor for them. A workload is associated with many strains, including anxiety and fatigue. According to the results of a study of Korean Manufacturing Workers (Oah et al., 2018) results workload and accident experiences have a positive effect. Workload, safety leadership, and the safety climate effect perceived risk more than accident experience, particularly for the emotional risk perception. Job stress and physical workload may impair the personnel's ability to avoid dangers and may also cause perceived risk. Additionally, when these factors come together might cause risk behavior and accidents (Rundmo, Hestad, & Ulleberg, 1998).
The research about responses to health and safety risk in the work environment supported that one of the links between health and safety and task performance might be found in distraction from work task activities caused by health and safety threats and the cognitive effort essential to effect sufficient protective responses. The results concerning distraction from work task suggest that productivity loss resulting from injury is not the only performance inference of a hazardous occupational environment. Health and safety threats and worry about risks are distracting and place demands on an individual's attention to tasks. (Mclain, 1995) According to the distraction-conflict theory, any aspect of a working environment that distinguishes attention from work tasks may increase the time it takes to perform additional, conflicting attention requests to the individual (Baron, 1986).
2.3.3. Risk perception in SMEs
For all physical work environment factors with a significant relationship, the analysis indicates that when the enterprise is smaller the work environment is more hazardous. Several ergonomic, physical and
19
chemical hazards are strongly related to enterprise size. It is obvious that small enterprises have to handle with severe restrictions in order to secure their survival, and the work environment can be one of the issues thrusted aside in the daily struggle for survival (Sørensen, Hasle, & Bach, 2007).
Small enterprises have the biggest need for a kind of support about occupational safety and health, because of their own knowledge and resources are insufficient. In fact, most of the small enterprises do not seem to perceive this need, but rather define their own working environment as good or average. For this reason, they are unwilling to look for support related occupational health and safety. In this point, it is very substantial to have imperative assistive structures that reach a large proportion of small enterprises (Antonsson, Birgesdotter, & Bornberger-Dankvard, 2002).
In very small (micro) family-oriented enterprises (five employees or less), the technical control mechanisms are less detailed and the chance for exposure to risk factors is bigger. Nevertheless, substantial variations in tasks can refer shorter exposure to risk, the fact that employees spend more time doing the same work can actually reduce the level of risk compared to a larger firm (Champoux & Brun, 2003).
Even though the experimental basis and the quality of the studies examined vary considerably. Based on the studies about risk perception in small and micro enterprises results can be concluded that:
• The risk of hazardous accidents is higher in small enterprises. • There is a bigger risk of less severe accidents.
• Large enterprises have better OHS management systems.
• Only dispersed data exists about other hazards (Sørensen et al., 2007).
The labor force is a substantial factor. Small and micro scale enterprise workers are usually younger, less educated and less experienced than their counterparts in large corporations, and this may enhance the risk of workplace accidents. Additionally, because of lack of knowledge, workers may not certainly be aware of the risks they handle, they may not know how to guard themselves and tend to demonstrate risk admittance (Antonsson et al., 2002).
21
3. Methodology
This research work aims to analyze risk perception of micro enterprises workers and SMEs workers in Portugal. Additionally, research intends to compare those results. For this purpose and considering the literature review, carry out the work developed an online questionnaire. The online questionnaire has been designed to take 3 – 4 minutes to complete. The main reasons to use online questionnaire is to have faster answers and to distribute easily especially by social networks. Each item in the questionnaire was translated to Portuguese. To gain a deeper understanding the perceptions of employees in micro and small-medium enterprises a quantitative approach was followed. According to Saunders, Lewis, & Thornhill (2009) any business and management research is likely to involve some numerical data or contain data that could usefully be quantified to help answer research question(s) and to meet objectives. As methodology, to depict the participants in an accurate way a descriptive study design was utilized. SME - micro definition used in study as per European communities’ criteria for SMEs and micros.
3.1. Sample
A survey was conducted between November 2018 and January 2019 among 71 micro-enterprises (with less than 10 employees) and 47 Small-Medium enterprises. In total, 118 questionnaires were answered.
3.2. Questionnaire development
Questionnaire contains two sections; first section included 13 single questions. This section contains questions asked to collect the demographic characteristics of respondents. First section also includes questions about the respondents’ risk perception. According to study carried by Leiter et al. (2009b), factors that influence workers judgment include having safety training and the experience or witnessing of an accident at work.
Second section contains five-point rating scale questions-items to evaluate Risk perception and its relationship with Safety climate, Workload and Stress at work.
Table 6: Questions related demographic characteristics of respondents • Age • Gender • Educational Background • District • Type of enterprise
• Experience time in work area
• Amount of people work in the enterprise • Annual turnover of enterprise
• Type of work “physically or mentally active work” • Daily working hours
• Occupational health and safety related training • Witnessing or hearing about any accident at work • Experience of accident or near accident at work
In the second section respondents were asked to which extent they agreed with statements intended to measure safety climate and safety leadership at work, as well as risk perception.
In order to quantify these variables, respondents were asked to rate to which extent they agreed with several statements by using a Likerts’ five-point scale ranging from “Strongly Disagree (1)” to “Agree strongly (5)”.
Risk perception was assessed with three items that were extracted from previous studies (Oah et al. 2018; Taylor et al. 1996). The measurement of risk perception was intended to measure cognitive and emotional components. The respondents were asked to assess the probability for themselves as an emotional component "I am always worried about being injured on the job in this work place" as well as for the workplace in general as a cognitive component “In my workplace the chances of being involved in an accident are quite large''. The study carried by Rundmo & Nordfjærn (2017) distinguishes between risk perception and anticipated worry, i.e. how concerned the respondents felt ‘when thinking about’ the risk of an accident. This emotional component makes it possible to examine the associations between risk perception and worry.
Based on study conducted by Griffin & Neal (2000), safety climate at work values were measured by five items. Safety management was assessed by item that asked about the degree to which executives valued safety in the workplace. Safety communication was assessed by item that asked how safety issues were
23
communicated. Safety education and training measured the degree to which the staff was trained in safety procedures. Table 7 shows items asked to evaluate by respondents about risk perception and Safety climate and safety leadership at work.
Table 7: Items asked to evaluate safety climate at work and risk perception
Risk Perception o In my workplace the chances of being
involved in an accident are quite large o I am always worried about being injured
on the job in this work place
o There are significant dangers inherent in the workplace
Safety climate at work o I think management is sincere in its
efforts to ensure employee safety o There is open communication about
safety issues within this workplace o The contents of the health and safety
education and training provided by my organization are easy to understand o I am satisfied with the physical work
conditions in my work area
o I receive regular updates on technical aspects of safety
The respondents answered the questions intended to measure workload and stress at work, also distraction from task activity (Table 8). Workload and stress at work measured using three items, distraction from task activity measured using two items. Workload was measured using two items that were extracted from the study of Oah et al. (2018). Stress was measured using the item that was extracted from the study of Rundmo (1996). Workers responded on a 5-point scale ranging from “very rare” (1) to “very often” (5).
Table 8: Items asked to evaluate Workload and Stress
Workload and Stress at work o How often do you feel under stress in
your work?
o How often do you feel the need to rush your work?
o How often do you need to do another task before finishing the current task?
3.3. Data Analysis
Mann-Whitey and Kruskal-Wallis tests were used to compare two independent samples or three independent samples as variables were not normally distributed. The Shapiro-Wilk (N < 50) and Kolmogorov-Smirnov (N > 50) test were performed to study normal sample distribution. To compare obtained values against the medium point of scales used One-Sample t tests. Pearson correlation, Spearman correlation and Cronbach´s Alfa was also used. A p-value of less than .05 was considered significant. The scale of values employed in the questionnaire introduced a minimum score of 1 point (1point x 3 items/3) and a maximum score of 5 points (5 points x 5 items/5). The theoretical average score was thus calculated to be 3 points. SPSS (Statistical Package for the Social Sciences) version 25.0 was used to perform statistical analysis.
25
4. Results and discussions
4.1. Preliminary analysis
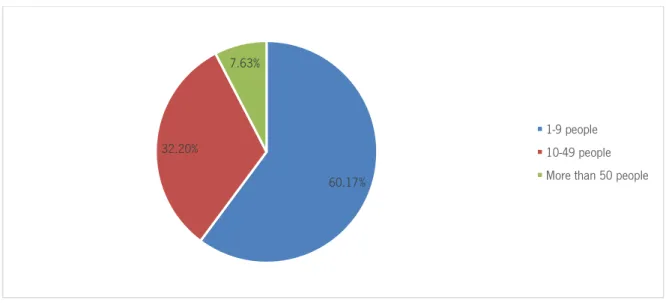
According to survey data approximately 60.2% of respondents were micro enterprise workers and 39.8% of respondents were small and medium enterprise workers (Figure 3). The population studied was, on average, 32.8 years old and 83.9% of the population had more than 1 year of experience in the same job. Of the 118 workers who constituted the study sample, 56.8% were female and living in Braga district (88.1%). 17.8% of respondents had Basic School or Less education, 17.8% of respondents had Professional Course education, 32.2% of respondents graduated from High School and 32.2% had High Education. Big percentage of (45.8%) respondents answered as they work 8 hours in a day.
Figure 3: Enterprise size distribution
Big percentage of respondents (74.63%) reported that they have physically and psychologically combined work activeness, 26.22% of respondents have only psychologically active work and 18.15% of respondents have only physically active work (Figure 4).
60.17% 32.20%
7.63%
1-9 people 10-49 people More than 50 people
Figure 4: Activity at work
As far as the work sector, 24.58% of respondents working in manufacturing, 22.03% of respondents working in retail sales (clothes, furniture, supermarkets etc.), 19.49% of respondents working in food & hospitality field (restaurant, hotel, bar, coffee etc.) (Figure 4).
Figure 5: Work field of respondents
Related with accident experience the 75.4% of respondents claim that they never had any accident at work and 24.6% of respondents declared as they had accident at work (Figure 6). Also 34.7% of
74, 63% 18, 15% 26, 22% Both Physically Psychologically 11.86% 4.24% 24.58% 19.49% 9.32% 22.03% 8.47% Office work Others Manufacturing Food & Hospitality Health & Personal Services Retail sales Service sector
0.00% 5.00% 10.00% 15.00% 20.00% 25.00% 30.00%
27
respondents reported that they heard or witnessed and accident in their workplace while 65.3% of respondents reported that they never heard or witnessed an accident.
Figure 6: Accident experience
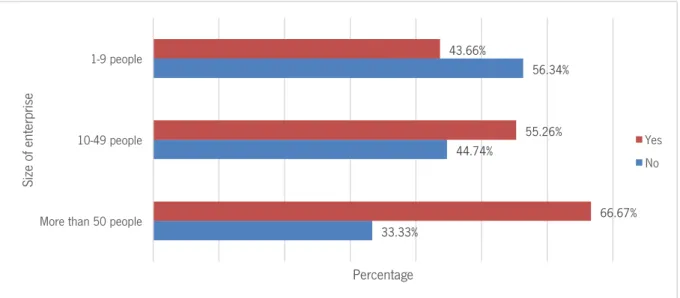
The 49.2% of respondents had occupational health and safety related training while 50.8% reported that they did not have. Nearly 43.7% of respondents from micro enterprise, 55.3% respondents from Small enterprise and 66.7% respondents from Medium enterprise declared that they had OHS related training (Figure 7). These results showed that micro enterprise workers have fewer percentage regarding occupational safety and health training. This result was consistent with result of previous study which found that training plays a part in the OHS standard and smaller companies perform poorer in safety training compared to larger companies (Mills & Lin, 2014).
Figure 7: Size of enterprise and OHS related training
75.42% 24.58% No Yes 33.33% 44.74% 56.34% 66.67% 55.26% 43.66%
More than 50 people 10-49 people 1-9 people Percentage Size o f en terp rise Yes No
Analysis of the internal reliability of the scales was made through the calculation of Cronbach’s alpha. Cronbach alpha coefficient was calculated to evaluate the internal consistency of the scales measuring the perceived risk, safety climate, and workload. For the selection of items, a cutoff criterion was applied: All scales had to have an internal reliability value of at least 0.7, which is considered to be acceptable, as suggested by Cortina (1993). The reliability results showed in Table 9 indicate that the risk perception, safety climate, workload and stress scales are reliable.
Table 9: Reliability Statistics
Cronbach's
Alpha N of Items
Job Risk .764 3
Safety Climate .898 5
Stress and Workload .853 3
According to descriptive statistics results perceived job risk score was 2.23, significantly under de medium point of the scale, t (117) = -7.672, p = 0.001. Safety climate, Stress and workload at work were above the medium point (p < .001). Safety climate was 3.89, stress and workload were 3.52.
Table 10: Descriptive Statistics
M SD
Job risk 2.23 1.07
Safety climate at work 3.89 1.11
Stress and workload 3.52 0.96
M =Medium, SD = standard deviation
4.2. Risk perception analysis
4.2.1. Risk perception and enterprise size
Correlation analysis was first conducted to explore the relationships between organizational variables and the outcome variable (risk perception).
The primary and main research aim was to analyse risk perception of micro enterprises workers and Small-Medium enterprises workers in Portugal. As expected, analysis results showed that micro enterprise workers perceive higher risk than small and medium enterprise workers (2.42 vs 1.96). Statistically positive and significant difference was found between micro enterprise workers and small/medium enterprise workers. MU = 1229.500, p = 0.015. Related results showed in Table 11.
This finding is consistent with prior research which suggests the smaller the enterprise the more hazardous the work environment is. Detailed investigation explored the relationship between enterprise
29
size and the level of occupational risk. The study clearly identified the increased occupational risks appearing in micro enterprises (Sørensen et al., 2007).
Table 11: Risk perception and enterprise size correlation
Micro Small or Medium
M SD M SD Sig.
Risk perception 2.42 1.07 1.96 1.04 .015*
* p ≤ .05 ** p ≤ .01 *** p ≤ .001
Another work carried out by Esener-2 (Second European Survey of Enterprises on New and Emerging Risks) also found that risk assessments is positively correlated with establishment size (EU-OSHA, 2016). Results can be correlated with idea that smaller the enterprise more significant the challenges in handling OHS. Micro enterprises have difficulties managing occupational health and safety (OHS) and hence may experience poor OHS conditions and may cause higher risk perception (EU-OSHA, 2018). One of the possible explanations for the lower risk perception in larger enterprises is that those enterprises often have greater resources that can be invested in health and safety issues, allowing for a greater degree of organization, planning, education, and training. when the enterprises bigger they are capable of investing more in proper equipment and reliable personal protective equipment. In addition, small/ medium enterprises can have a greater interest in safety comparing with micro enterprises.
4.2.2. Risk perception and accident experience
Analysis proved expected results regarding worker who had experienced an accident before. Worker who had suffered an accident perceive higher risk comparing with worker who did not experienced any accident before (2.75 vs 2.06) and difference showed statistically significant result, MU = 810.500, p = 0.002 (Table 12). This result explains that an employee who has experienced an accident assess the risk differently after the accident than before. Workers who have experienced accidents themselves are more likely to perceive a higher accident risk although, the probability of an accident is not greater after such an event has occurred. Likewise, correlation of accident experience and safety climate result supported that worker who had suffered an accident, felt less safe than those who had not experienced any accident (3.81 vs 3.92) but the difference was not statistically significant, MU = 1277.00, p = 0.932.
Table 12: Risk perception and accident experience correlation
Yes No
M SD M SD Sig.
Risk perception 2.75 1.11 2.06 1.01 .002**
* p ≤ .05 ** p ≤ .01 *** p ≤ .001
The result of previous study (Oah et al., 2018) found that accident experience positively influenced the perceived risk of an accident. One more study supported that worker who had suffered an accident themselves, felt less safe than those who had not experienced an accident (Rundmo, Hestad, & Ulleberg, 1998). Another study also confirms a consistent relationship of risk perception with the experience of workplace injuries. Employees who had experienced an injury perceived the workplace more hazardous than their non-injured coworkers from (Leiter et al., 2009).
4.2.3. Risk perception and work type
Results showed that if workers have psychologically active work, they perceive less risk comparing with workers who have physically active work (Table 13). But if workers have both physically and psychologically active work, they perceive highest risk comparing with others. Differences between those workers were significant, χ2 KW (2) = 6.087, p = 0.048
Table 13: Type of work and risk perception correlation
Psychological Physical Both
M SD M SD M SD Sig.
Risk perception 1.74 .71 2.35 .88 2.38 1.19 .048*
* p ≤ .05 ** p ≤ .01 *** p ≤ .001
Results showed that if workers have mentally active work, they assess low risk but when workers have mentally and physically active work, they assess higher risk.
It is expected that even if workers have physically active work, who feels more anxiety and stress in the workplace, they tend to take fewer precaution and eventually get involved in more injuries and accidents.
4.2.4. Risk perception and workload
The results of correlation between workload at the workplace and risk perception revealed that workload positively affected perceived risk of workers (Table 14). Results showed significant difference (p = .003). Based on this can be said that if workers have more workload, they will perceive higher risk.
31 Table 14: Workload and risk perception correlation
Risk
Workload .267**
* p ≤ .05 ** p ≤ .01 *** p ≤ .001
This result is consistent with previous study which demonstrated that workload has a positive impact on risk perception. A worker with a high workload experiences great distress, which is likely to lead to an accident (Oah et al., 2018). Based on this, it can suggest that it is essential to provide appropriate rest time for the workers and to adjust their job dispersion and their work speed to diminish the employees’ workload. In addition, ensuring appropriate work hours, work speed, and break time would be necessary to decrease workload and risk perception of workers.
4.2.5. Risk perception and stress
Result between stress level at work and risk perception clarified that stress and perceived risk of workers have positive correlation (Table 15). Results showed significant difference (p = 0.007). According to this finding can be supported that if workers take more stress, they will perceive higher risk. The study carried by Rundmo (1996) supported that bad working conditions may cause job stress as well as insecurity. Job-stress factors affecting both risk perception and safety also, may reduce workers’ capacity to deal with emergency situations correctly. Another study also explained that riskiness of a work environment was significantly and positively related to experience of stress symptoms (Mclain, 1995).
Table 15: Stress and risk perception correlation
Stress
Risk .248*
* p ≤ .05 ** p ≤ .01 *** p ≤ .001
related stress appears when workers perceive that their work demands exceed their abilities. Work-related stress can occur physical, mental and emotional. It is expected that when workers perceive stress, they are not capable for tasks which are important to them. Because of that work-related stress may lead to illness, injury and weakened organizational performance.
4.2.6. Risk perception and demographic characteristic
Analysis results showed that risk perception of older workers (≥45 years old) was higher, however the difference was not significant, MU = 891.000, p = 0.946. Even though, age was not found to have a statistically significant positive effect on risk perception it is acceptable that older workers perceive more risk comparing with younger workers. It can be also considered that younger workers may be less able to perceive hazardous situations.
Results showed that female workers perceive less risk comparing with male workers although there were no significant differences between women and men workers’ assessments, MU = 1476.500, p = 0.204 As anticipated, the higher the level of education the less is the risk perception, worker with basic school education felt more risk comparing with other workers but the results did not show significant differences, χ2 KW (2) = 0.572, p = 0.751.
Workers with more experience feel less risk than workers with 4 to 12 months of work experience, but difference is not significant, χ2 KW (2) = 1.016, p = 0.602.
Table 16: Risk Perception and demographic characteristics correlation
Risk Perception and demographic characteristics correlation
M SD Sig. Gender 0.204 Female 2.13 1.04 Male 2.38 1.13 Age (M; SD) < 45 years ≥ 45 years 2.22 2.35 1.04 1.33 0.946 Educational Background 0.751
Basic School or Less 2.43 1.28
High School 2.23 1.03 High Education 2.14 1.06 Work experience 0.602 0-3 months 1.88 .56 4-12 months 2.58 1.28 > 12 months 2.23 1.09
33
4.3. Occupational safety analysis
Results regarding to Safety climate at work and enterprise size showed that size of enterprise did not influence significantly workers’ opinion about safety climate at work, MU = 1370.000, p = 0.097. Results demonstrated that there is positive relation between safety training and safety climate (Table 17). Based on results, a worker who had an occupational health and safety training feels safer at work comparing with a worker who did not have any occupational health and safety training (4.30 vs 3.49), and this difference is statistically significant, MU = 917.500, p = 0.001.
On the other hand, risk perception of workers who had safety training was higher (2.40 vs 2.07). However, the difference is not statistically significant, MU = 1397.000, p = 0.063. Even though, the result was not significant and it is consistent with previous research which demonstrated that workers who receive adequate training on safety procedures feel more empowered to address the hazards that they encounter (Leiter et al., 2009).
Table 17: Safety climate and safety training correlation
Yes No
M SD M SD Sig.
Safety Climate 4.30 .99 3.49 1.09 .001***
* p ≤ .05 ** p ≤ .01 *** p ≤ .001
As expected, correlation result between safety climate in the workplace and risk perception is negative (-0.063). This result showed that workers´ perception about safety climate of enterprise exhibited a negative impact on their risk perception. We can infer that workers’ who feel higher safety perceive fewer risk in workplace, however it should be noted that this result is not significant (p = 0.498).