SugarCane planted after in-row deep tillage
indiamara marasca(1)*, Stella vannucci lemos(2), reginaldo Barbosa Silva(3), Saulo philipe
Sebastião guerra(4) and Kleber pereira lanças(5)
(1) Universidade Estadual Paulista, Campus de Botucatu, Departamento de Produção Vegetal, Programa de Pós-graduação em Agronomia - Energia na Agricultura, Botucatu, São Paulo, Brasil.
(2) Universidade Estadual Paulista, Campus de Botucatu, Departamento de Economia, Sociologia e Tecnologia, Programa de Pós-graduação em Agronomia, Botucatu, São Paulo, Brasil.
(3) Universidade Estadual Paulista, Campus de Botucatu, Departamento de Agronomia e Engenharia de Pesca, Registro, São Paulo, Brasil.
(4) Universidade Estadual Paulista, Campus de Botucatu, Departamento de Economia, Sociologia e Tecnologia, Botucatu, São Paulo, Brasil.
(5) Universidade Estadual Paulista, Campus de Botucatu, Departamento de Engenharia Rural, Botucatu, São Paulo, Brasil. * Corresponding author.
E-mail: [email protected]
aBStraCt
Soil tillage that maintains the productivity of sugarcane plantations, providing an area for the root development and without traffic on crop rows, has given rise to new technologies in rural areas. the purpose of this study was to evaluate the soil physical properties in two sugarcane plantations, one of which was prepared with deep tilling and the other with conventional tillage. the experiment was conducted in lençóis paulista, São paulo State. Soil penetration resistance and relative density were analyzed. the cone index was lower in deep-tilled soil without traffic in all layers, than in deep-tilled soil with traffic and in conventional tillage. In both tillage treatments, the relative density values were acceptable in the 0.00-0.15 m soil layer, but considered detrimental for sugarcane development in the 0.15-0.30 and 0.30-0.45 m layers.
Keywords: soil management, soil tillage, subsoiler, traffic control system, Saccharum spp.
introduCtion
In the 2013/2014 growing season, an estimated acreage of 8.8 million hectares of sugarcane was harvested, making the State of São Paulo the largest producer, with a 52 % share of the total cane-producing area. In addition, the recovery of degraded cultivated areas in 2014 increased the sugarcane area, compared to the 2013 growing season by 3.8 % (Conab, 2013). Sugarcane is one of the most successful agricultural crops in Brazil, and, due to the high economic returns, interesting for the food industry and as alternative energy source (Andrade et al., 2011).
In recent years, mechanical harvest has induced changes in sugarcane cultivation. Although straw mulch left on the soil can reduce the pressure of machine wheels, successive operations of mechanical harvest and stalk transport, performed by heavy equipment, can cause soil compaction and compromise the productivity in subsequent growing seasons (Otto, 2012).
Sugarcane root system reaches greater depths than other crops, with rhizomes and fasciculate roots, of which 85 % is found to a depth of 0.50 m and 60 % in the 0.20-0.30 m layer, where the crop is most affected by soil compaction (lima et al., 2013a).
The intensive use of agricultural equipment for all agricultural operations (sowing, crop treatments and harvesting) has increased soil compaction, affecting mainly the area exploited by the plant rhizosphere. The main reason for this phenomenon is the repetition of operations over years (Oliveira et al., 2003).
A possible alternative is to establish soil patches in the sugarcane plantations. In this case, the minimum tillage management includes the tilling of soil patches. This means that the soil is
tilled, limed and fertilized only in the rows where sugarcane will be planted. no soil improvement treatments are applied in the inter-rows, reserved
for machine traffic. This reduces compaction in the
crop rows, caused by the pressure of harvester tires, transshipment vehicles and even by the presence of
field workers (Rossetto et al., 2011).
To reduce machine traffic in sugarcane plantations, and to minimize the working stress and
increase the efficiency of vehicle operators, in terms
of number of working hours and effective nighttime operations, Oliveira and molin (2011) suggested the installation of autopilot systems. Soil tillage prior to sugarcane planting is crucial for crop longevity,
since the soil is only plowed again after the fifth or
sixth sugarcane harvest, depending on the variety and/or productivity (Carvalho et al., 2011).
Brazil has one of the world’s most extensive agricultural areas with sugarcane and palm trees for ethanol and sugar production in highly mechanized systems, which can modify the soil physical properties and cause compaction (Souza et al.,
2012). Soil compaction influences all stages of crop
development. nevertheless, in many areas with low sugarcane yields, the critical values and effects of soil compaction are ignored, while the producers claim not to know the location and intensity of soil compaction (Oliveira filho et al., 2015).
Soil compaction in sugarcane systems has been attributed mainly to mechanical harvesting in periods of high moisture content in the soil (Pankhurst et al., 2003), resulting in a reduction of the total porosity and consequent increase in bulk density, mainly in the 0.20-0.40 m layer, due to the absence of soil disturbance (Carvalho et al., 2011). Several authors suggested that soil compaction is determined by physical properties such as bulk density, pore-size distribution and aggregate stability in water, or by soil penetration resistance
reSumo: CompaCtação do Solo em um latoSSolo Vermelho CultiVado Com Cana-de-açúCar utilizando equipamento de preparo profundo e Canteirizado do Solo
um preparo de solo que seja capaz de manter a produtividade dos canaviais, proporcionado a cultura área de desenvolvimento radicular e sem tráfego em cima da cana-de-açúcar, tem impulsionado novas tecnologias no meio rural. este trabalho objetivou avaliar o comportamento dos atributos físicos do solo em duas áreas de cultivo de cana-de-açúcar sendo uma delas manejada com equipamento de preparo profundo canteirizado e a outra, pelo método de preparo convencional. o experimento foi realizado em lençóis paulista, São paulo. os atributos analisados do solo foram a resistência à penetração e a densidade relativa. o Índice de Cone do Solo (iCS) apresentou valores menores no preparo profundo Canteirizado sem tráfego (ppC sem tráfego) para todas as camadas em comparação ao preparo profundo Canteirizado com tráfego (ppC com tráfego) e ao preparo Convencional (pC). para ambos os tratamentos, a densidade relativa do Solo (drS) apresentou valores aceitáveis para a camada de 0,00-0,15 m; nas camadas de 0,15-0,30 e 0,30-0,45 m, foi considerada prejudicial ao desenvolvimento da cultura.
(Assis and lanças, 2005). Soil susceptibility to compaction is a function of factors such as
moisture content and texture, which influence
the soil behavior when subjected to external pressure such as friction and bonding of particles (macedo et al., 2010).
The purpose of this study was to evaluate soil compaction by the Cone Index and Relative Density methods, managing the soil with in-row deep tillage as well as conventional tillage.
material and metHodS
experimental setup
The study was conducted in an area of a partner company of the group Zilor, PHD Cana, in lençóis Paulista, Sao Paulo State (22º 40’ S and 48º 53’ w). The climate is temperate warm with a dry season from April to August and a rainy season from September to march; January is the wettest
month. The soil of the area is classified as latossolo Vermelho (Oxisol), with a medium sandy texture with 16 % sand (Embrapa, 2013).
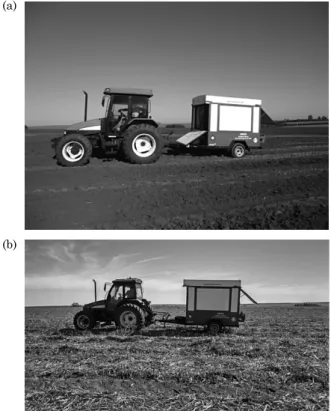
In both treatments, seedlings were planted at a spacing of 0.90 × 1.50 m, with 2.40 m in-between the wheel tracks. Seedlings of the variety RB 966928 were
planted and first cut at the age of 15 months (Figure 1).
The study area was divided in two subareas of 2.5 ha each (500 × 100 m), for the two soil tillage treatments: In-row deep tillage (IRDT) and Conventional Tillage (CT). Each treatment was subdivided into four 100-m long plots in the direction of the crop rows, with a 30 m wide border (Table 1). Both soil tillage treatments were replicated four times, and data collected in 2012 and 2013.
The variety RB 966928 was developed by the sugarcane breeding program of the federal University of Paraná, has a particularly high sucrose content, when grown in environments with medium to high production potential. In addition, RB 966928 is tolerant to the diseases rust, coal, scald, red stripe, false red stripe, rickets, mosaic, and drill (PmgCA, 2015).
in-row deep tillage equipment
The equipment used for the intensive in-row deep tillage of soil consists of components that allow
the performance of five operations or functions at
once, which coined the popular name “Penta”. The equipment consists of a subsoiler rod, a lime application mechanism, a fertilizer application mechanism with adaptable application depth (0.40 to 0.80 m), a rotary hoe to break the soil crust and a system to raise crop rows (formation of plant beds in rows).
The tractor-drawn “Penta” is manufactured by mafes Equipamentos Agrícolas, with a coupling system on the drawbar of the tractor (total height 3.00 m, total width 3.70 m, width of working bar 1.20 m). The rotary hoe has 16 knives, with a working depth of 0.30-0.40 m, and a central gearbox with a rotation of 540 rpm at the power outlet.
Soil penetration resistance
To measure soil penetration resistance, we used a mobile sampling soil unit UmAS (Unidade móvel
de Amostragem do solo, figure 1), developed at the
test center for agricultural machinery and tires nEmPA (núcleo de Ensaios de máquinas e Pneus Agrícolas do Departamento de Engenharia Rural), of the College of Agricultural Sciences (fCA/UnESP) in São Paulo State (lanças and Santos filho, 1998).
Tillage was performed at a soil moisture content of 0.12 kg kg-1 and harvest at 0.10 kg kg-1. Soil tillage operations were performed in areas with a soil friability between 0.12 and 0.14 kg kg-1 (figure 2).
The UmAS can be transported on the road,
pulled by cars or pickup trucks, and in the field,
by a tractor (figure 1), using a hydraulic system as power source to drive the two mechanisms: soil auger and penetrometer (lanças and Santos filho, 1998). The penetrometer was used to evaluate soil table 1. description of both soil tillage systems in
an area of Latossolo Vermelho (oxisol) in-row deep tillage (irdt) Conventional tillage (Ct)
Harrowing Harrowing
In-row deep tilling Subsoiling
lime and gypsum application lime and gypsum application
furrowing furrowing
filter cake application filter cake application Seedling planting Seedling planting furrow covering furrow covering
Traffic line center 2.40 m 0.90
0.90 0.90
0.75 0.90
1.30 1.10
1.50
0.20 0.20
1.10
1.50 0.90
0.75 0.75 0.90
penetration resistance at certain points. The data were collected by a load cell, model CS 1000, líder
Balanças, fixed to a rod, recording the displacement
by a multi-turn potentiometer and penetrometer speed set at 30 mm s-1, according to the standards of ASABE (2012).
The variable soil penetration resistance was evaluated in the form of a curve. In 2012, samples were collected at 15 points, 4 in the wheel tracks alongside the crop rows, and 7 in the crop row. In 2013, only the 7 points in the crop row were sampled, to avoid sugarcane trampling. The curves were assembled with the collected mean values, and the treatments divided into 4 sections, with 4 random locations per section, totaling 16 curves with 15 sampling points per treatment (in-row deep tillage and conventional tillage, with a total of 480 (240 + 240) points, sampled after soil tillage in 2012.
Soil penetration resistance was measured to a depth of 0.45 m, and separated in layers (0.00-0.15, 0.15-0.30 and 0.30-0.45 m). from soil penetration resistance values, the soil cone index was calculated as described by lanças and Santos filho (1998).
relative soil density
Samples for soil density determination to calculate relative soil density were obtained
after soil tillage and sugarcane harvest in both treatments. for soil density evaluation, undisturbed soil samples were taken with an auger.
The assessments of in-row deep tillage (IRDT)
were divided in two categories: with traffic (traffic
with IRDT), where the transshipment truck was
driven in the inter-row, and without traffic (IRDT without traffic), resulting in a total of 224 samples.
The same was done for conventional tillage (CT) with
112 samples, where the areas with traffic could not be distinguished from those without traffic, with a
total of 336 sampling points in 2013.
A total of 24 soil samples were taken per treatment and year (2012 and 2013), 12 from the plant line and 12 from the wheel track, in the 0.00-0.15, 0.15-0.30, and 0.30-0.45 m layers, to determine soil density.
The Relative Soil Density (RSD) was determined by a methodology proposed by Klein (2006):
rSd = Sd/dsmax Eq. 1
where RSD is the relative soil density, SD soil density and Dsmax the maximum soil density obtained by the normal Proctor test.
By the compaction curve equation generated by the normal Proctor test, it is mathematically possible to calculate the maximum soil density (Dsmax), as well as the optimum moisture content for compaction at that level of applied energy (marcolin and Klein, 2011).
The results of the Proctor test and density indicated high compaction. These values of soil density were used to calculate relative density, resulting in an approximate value of 1.87 mg m-3.
reSultS and diSCuSSion
Soil penetration resistance
After soil tillage, in 2012, the values of soil cone index
were significantly higher under conventional tillage in
the layers 0.15-0.30 and 0.30-0.45 m, compared to in-row deep tillage. However, for the 0.00-0.15 m layer,
a significant difference of about 10 % was found and the
lowest value of soil penetration resistance was observed in the IRDT treatment (Table 2).
These results agree with those of Dedecek
and Gava (2005), who studied the effect of traffic
of harvest equipment on eucalyptus yield. They claimed that traffic caused compaction in the 0.0-0.3 m layer in sandy soils, resulting in mean values of soil penetration resistance above 5.0 mPa. mean values of penetration resistance close to those in this study (4.7 mPa) were also found by lima et al. (2013b), in a sandy clay soil with loamy texture at a depth of 0.3 m.
figure 2. evaluation after soil tillage (a) and after sugarcane harvest after 15 months (b) with the mobile soil sampling unit.
(a)
The soil cone index was higher in the wheel track after soil tillage, a result already expected
due to the use of controlled traffic. The lowest value
(1.2 mPa) was found in the deep-tilled crop row and was statistically different from the value of conventionally tilled soil (Table 3).
Analyzing compaction and surface settlement of a latossolo Vermelho (Oxisol) exposed to different
traffic levels under field conditions, Couto et al. (2013) confirmed that traffic intensity was the only factor that influenced the analyzed variables, determining
the density values and degree of soil compaction. Increased soil aggregation depends on the soil type
and tillage and the use of controlled traffic avoids
excessive compaction. The negative effects of tillage on a sandy loam Hapludalf were reduced after 12 months, demonstrating the soil capacity of recovery of structure and aggregation (Prevedello et al.,
2014). Agricultural machinery traffic increases soil
density by decreasing the mean pore diameter and
macroporosity in the wheel track, causing cumulative degradation of soil physical quality over the years of cultivation (Roque et al., 2010).
Transshipment traffic increased the soil cone
index to values similar to conventional tillage. This
indicates the need to avoid vehicle traffic, which would be possible by installing a traffic control
system on transshipment trucks.
After the first cut, in 2013, the soil cone index of IRDT with traffic differed from conventional tillage
only in the 0.30-0.45 m layer, and from IRDT without
traffic in all layers (Table 4).
Soil cone index was lowest in IRDT with
controlled traffic. After 450 days (15 months), the
cone index under IRDT had increased 1 mPa, and 2 mPa under conventional tillage (Tables 3 and 4). The cone index values for soil tillage showed that the management zones corresponded to each treatment, reaching the expected mobilization layer. The points 1, 2, 3, 4, and 11 12, 13, and 14 represent the areas
of controlled traffic (Figure 3).
Measures of traffic control can improve the soil
physical structure and reduce fuel consumption, as a larger area of soil will be uncompacted and less resistant to be broken up by the passing soil tillage equipment. In addition, these measures improve the traction potential of the soil (tire-soil interface),
which increases the traction efficiency resulting from machine traffic on firmer soil (wheel tracks)
(Roque et al., 2010).
Machine traffic zones are efficient to minimize
soil compaction caused by IRDT, due to the low values of soil cone index (figure 3). A soil cone index value (SCI) of 4.0 mPa is considered critical for sugarcane by Ribeiro (2010), who reported that root development in sugarcane can be restricted at this SCI value.
The diagrams of 2012, based on data from soil sampled under wheel tracks and crop rows, showed lower values of soil penetration resistance (SPR) under IRDT, and clearly indicated the wheel track (figure 4a).
Under conventional tillage (figure 5a), the soil cone index of the samples was highest in the 0.30-0.45 m layer, approaching 5 mPa. Root growth is possible in soils with high moisture content and aeration, table 2. Soil cone index in treatments: in-row deep
tillage (irdt) and Conventional tillage (Ct), in different layers, after soil tillage
treatment Cone index
0.0-0.15 m 0.15-0.30 m 0.30-0.45 m mean
mPa
IRDT 1.3 a 3.9 b 5.7 b 4.0
CT 1.2 a 4.6 a 7.8 a 5.0
mean with same letters in a column do not differ by the Tukey test
(p<0.10). Standard deviation: 3.72; Coefficient of variation: 43 %.
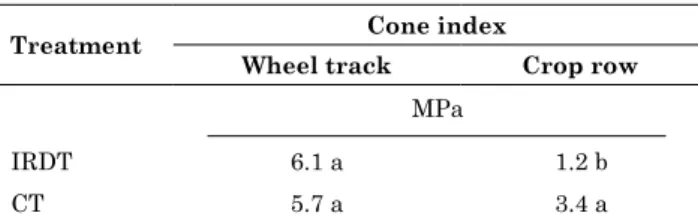
table 3. Soil cone index in treatments: in-row deep tillage (irdt) and Conventional tillage (Ct), at different sampling locations, after soil tillage
treatment Cone index
wheel track Crop row
mPa
IRDT 6.1 a 1.2 b
CT 5.7 a 3.4 a
means with same letters in a column do not differ by the Tukey test
(p<0.10). Standard deviation: 3.72; Coefficient of variation: 43 %.
table 4. Soil cone index of treatments in different layers after sugarcane harvest
treatment Cone index
0.00-0.15 m 0.15-0.30 m 0.30-0.45 m mean
mPa
In-row deep tillage with traffic 2.4 a 7.3 a 9.8 b 7.0
In-row deep tillage without traffic 1.5 b 3.2 b 3.8 c 3.0
Conventional tillage 2.3 a 7.1 a 10.3 a 7.0
even when the soil cone index exceeds 4.0 mPa (Dexter, 1987). for sandy soils with high contents of coarse sand, Sene et al. (1985) considered values of penetration resistance from 6.0 to 7.0 mPa as critical. These authors reported mean SPR values for
conventional tillage and IRDT with traffic (Figure 5b)
that were considered harmful to corn root development.
The lowest compaction values were observed in
IRDT without traffic (Figure 5c). Braunack et al.
(2006) found reduced compaction and increased
crop productivity of sugarcane in areas with traffic
control at sugarcane harvest.
The representation of evaluations in form of a curve was chosen for demonstrating the soil variability and accurately identifying the values in the plant rhizosphere, in the spacing of this study.
The sampling points in 2013 are shown in figure 4b.
relative soil density
for the physical property relative soil density (RSD), there was no statistical difference between treatments (Table 5). In the 0.15-0.30 and 0.30-0.45 m
layers, RSD was considered high and may have affected crop productivity negatively.
for all tillage operations (subsoiling in crop row + leveling harrow, plowing with moldboard plow + leveling harrow, subsoiling in total area + leveling harrow, subsoiling in total area, and intermediate harrowing), soil density was
maximized when machine traffic occurred under the
above moisture conditions (Carvalho et al., 2014).
The low yields in the fourth sugarcane harvest can be explained in part by: after four years of cultivation, soil bulk density was higher than 1.45 mg m-3, hampering the plant nutrient uptake, and macroporosity was less than 15 %, impeding the development of the root system (Camilotti et al., 2005).
Our data (Table 5) agree with those reported by lindstron and Voorhees (1994), in that RSD above 0.86 is high and harmful for crop development and below 0.80 may affect productivity. In the 0.30-0.45 m
layer, IRDT without traffic differed from the other treatments, due to the absence of traffic in the crop
row (Table 5). Over time, the accumulation of crop residues will tend to reduce the soil density, since a reduction in soil density and relative density was observed with increasing organic matter contents, figure 4. Sampling points for data collection of soil penetration resistance in 2012 (a) and in 2013 (b).
(a)
(b)
5 5 1 2 3 4
7 7
6 6
8 8
9 9
10 10
11
11 12 131415
10
0 1 2 3 4 5 6 7 8 9 11 12 13 14 15
Soil Penetration Resistance (MPa
)
0.00 0.25 0.50 0.75 1.00 1.25 1.50 1.75 2.00 2.25 2.50 2.75 3.00 3.25 3.50 3.75 4.00 4.25 4.50
0.00 0.25 0.50 0.75 1.00 1.25 1.50 1.75 2.00 2.25 2.50 2.75 3.00 3.25 3.50 3.75 4.00 4.25 4.50
0.0-0.15 m 0.15-0.30 m 0.30-0.45 m
Transept point
with consequent increase in the optimal gravimetric moisture content (Braida et al., 2006).
with a view to the sustainability of sugarcane plantations, organic matter incorporation can
influence the soil compaction degree, requiring further
research. for the soil managements evaluated in this
study, soil density was higher when the agricultural
machine traffic was limited to restricted zones.
ConCluSionS
The in-row deep tillage without traffic (IRDT without traffic) had lower soil cone index values in all layers compared to in-row deep tillage with traffic (IRDT with traffic) and to conventional tillage (CT).
for both tillage treatments, the relative soil density (RSD) was acceptable in the 0.00-0.15 m layer, but considered detrimental for crop development in the 0.15-0.30 and 0.30-0.45 m layers.
aCKnowledgementS
The authors would like to thanks the Coordination for the Improvement of Higher Education Personnel (CAPES), the companies PHD Cana and mAfES, and Sao Paulo State University - College of Agricultural Sciences (UnESP-fCA).
referenCeS
Andrade nSf, martins filho mV, Torres JlR, Pereira gT, marques Júnior J. Impacto técnico e econômico das perdas de solo e nutrientes por erosão no cultivo da cana-de-açúcar. R Eng Agríc. 2011;31:539-50.
American Society of Agricultural and Biological Engineers -ASABE. Standard S313.2 - Soil Cone Penetrometer. St. Joseph, michigan [US]: 2012.
0.00 0.25 0.50 0.75 1.00 1.25 1.50 1.75 2.00 2.25 2.50 2.75 3.00 3.25 3.50 3.75 4.00 4.25 4.50
0.00 0.25 0.50 0.75 1.00 1.25 1.50 1.75 2.00 2.25 2.50 2.75 3.00 3.25 3.50 3.75 4.00 4.25 4.50
0.00 0.25 0.50 0.75 1.00 1.25 1.50 1.75 2.00 2.25 2.50 2.75 3.00 3.25 3.50 3.75 4.00 4.25 4.50
Soil Penetration Resistance (MPa
)
Transept point
6 7 8 9 10
5
0 11
0.0-0.15 m 0.15-0.30 m 0.30-0.45 m
figure 5. Soil cone index curves in layers (0.00-0.15, 0.15-0.30 and 0.30-0.45 m), under conventional tillage (a), in-row deep tillage with traffic (b), and in-row deep tillage without traffic (c), in 2013.
table 5. relative soil density (rSd) in treatments (in-row deep tillage - irdt, and conventional tillage - Ct), in different layers, after soil tillage and after sugarcane harvest
treatment relative soil density 0.00-0.15 m 0.15-0.30 m 0.30-0.45 m
Soil tillage
In-row deep tillage 0.72 a 0.85 a 0.87 a Conventional tillage 0.71 a 0.95 a 0.79 a
Sugarcane harvest In-row deep tillage
with traffic 0.83 a 0.93 a 0.93 a
In-row deep tillage
without traffic 0.75 a 0.88 a 0.88 b
Conventional tillage 0.77 a 0.95 a 0.93 a for soil tillage: mean with same letters in a column do not differ
by the Tukey test (p<0.10). Standard deviation: 0.13; Coefficient of
variation: 31 %. for sugarcane harvest: means with same letters in a column do not differ by the Tukey test (p<0.10). Standard
Assis Rl, lanças KP. Avaliação dos atributos físicos de um nitossolo Vermelho Distroférrico sob sistema plantio direto, preparo convencional e mata nativa. R Bras Ci Solo. 2005;29:515-22.
Braida JA, Reichert Jm, Veiga m, Reinert DJ. Resíduos vegetais na superfície e carbono orgânico do solo e suas relações com a densidade máxima obtida no ensaio Proctor. R Bras Ci Solo. 2006;30:605-14. Braunack mV, Arvidsson J, Hakansson I. Effect of harvest
traffic position on soil conditions and sugarcane (Saccharum
officinarum) response to environmental conditions in Queensland,
Australia. Soil Till Res. 2006;89:103-21.
Camilotti f, Andrioli I, Dias flf, Casagrande AA, Silva AR, mutton mA, Centurion Jf. Efeito prolongado de sistemas de preparo do solo com e sem cultivo de soqueira de cana crua em algumas propriedades físicas do solo. Eng Agríc. 2005;25:189-98. Carvalho lA, Rezende IS, Panachuki E, Silva Junior CA, novak E, Silva gfC. Variáveis físicas do solo e produtividade de cana-de-açúcar sob sistemas de preparo na reforma de canavial. Agrar Acad. 2014;1:259-74.
Carvalho lA, Silva Junior CA, nunes wAgA, meurer I, Souza Júnior wS. Produtividade e viabilidade económica da cana-de-açúcar em diferentes sistemas de preparo do solo no Centro Oeste do Brasil. R Ci Agric. 2011;34:199-211.
Companhia nacional de Abastecimento - Conab. Companhia nacional de Abastecimento da Safra Brasileira 2013/2014, terceiro levantamento, dezembro 2013. Brasília, Df: 2013. Couto Rf, Reis Ef, Viana Pmf, Holtz V, Oliveira lA, Alves Smf.
Compactação e recalque superficial de um Latossolo Vermelho em
condição de campo e laboratório. R Agriambi. 2013;17:1239-45.
Dedecek RA, Gava JL. Influência da compactação do solo na
produtividade da rebrota de eucalipto. R Árvore. 2005;29:383-90. Dexter AR. mechanics of root growth. Plant Soil. 1987;98:303-12. Empresa Brasileira de Pesquisa Agropecuária - Embrapa. Centro
Nacional de Pesquisa do Solo. Sistema brasileiro de classificação
de solos. 3ª.ed. Brasília, Df: 2013.
Klein VA. Densidade relativa - um indicador da qualidade física de um latossolo Vermelho. R Ci Agrovet. 2006;5:26-32. lanças KP, Santos filho CA. Hydraulic-electronic penetrometer with DgPS for evaluation of the soil compaction. In: Anais del Congreso latinoamericano de Ingeniería Rural. la Plata, [Argentina]: Sociedade latinoamericano de Ingeniería Rural la Plata; 1998. p.570-6.
lima RP, león mJ, Silva AR. Compactação do solo de diferentes classes texturais em áreas de produção de cana-de-açúcar. R Ceres. 2013a;60:16-20.
lima RP, leon mJ, Silva AR. Comparison between two penetrometers in the evaluation of soil resistance to penetration. R Ceres. 2013b;60:577-81.
lindstron mJ, Voorhees wB. Response of temperate crops to soil compaction. In: Soane BD, van Ouwerkerk C, editors.
Soil compaction in crop production. Amsterdam: Elsevier; 1994. p.265-86.
Macedo VRM, Silva AJN, Cabeda MSV. Influência de tensões
compressivas na pressão de pré-compactação e no índice de compressão do solo. R Agriambi. 2010;14:856-62.
marcolin CD, Klein VA. Determinação da densidade relativa do
solo por uma função de pedotransferência para a densidade do
solo máxima. Acta Sci. 2011;33:349-54.
Oliveira filho f, miranda nO, medeiros Jf, Silva PCm, mesquita fO, Costa TKg. Zona de manejo para preparo do solo na cultura da cana-de-açúcar. R Agriambi. 2015;19:186-93.
Oliveira gC, Dias Júnior mS, Resck DVS, Curi n. Alterações estruturais e comportamento compressivo de um latossolo
Vermelho distrófico argiloso sob diferentes sistemas de uso e
manejo. Pesq Agropec Bras. 2003;38:291-9.
Oliveira TCA, molin JP. Uso de piloto automático na implantação de pomares de citros. Eng Agríc. 2011;31:334-42.
Otto R. Produtividade de colmos e desenvolvimento do sistema
radicular como relacionados a mineralização do nitrogênio do
solo e adubação nitrogenada [tese]. Piracicaba: Escola Superior de Agricultura “luiz de Queiroz”; 2012.
Pankhurst CE, magarey RC, Stirling gR, Blair Bl, Bell mJ, garside Al. management practices to improve soil health and reduce the effects of detrimental soil biota associated with yield decline of sugarcane in Queensland, Australia. Soil Till Res. 2003;72:125-37.
Prevedello J, Vogelmann ES, Kaiser DR, fontanela E, Reinert DJ, Reichert Jm. Agregação e matéria orgânica de um Argissolo sob diferentes preparos do solo para plantio de Eucalipto. Pesq flor Bras. 2014;34:149-58.
Programa de melhoramento genético da Cana-de-Açúcar - PmgCA. Viçosa, mg: Departamento de fitotecnia, Universidade federal de Viçosa; 2015.
Ribeiro CA. Variabilidade espacial da resistência mecânica do
solo à penetração em áreas mecanizadas de cana-de-açúcar
(Saccharum officinarum) [dissertação]. Jaboticabal: Universidade
Estadual Paulista; 2010.
Roque AAO. Controle de tráfego agrícola e atributos físicos do solo em área cultivada com cana-deaçúcar. Pesq Agropec Bras. 2010;45:744-50.
Rossetto R, Dias flf, Vitti AC, Cantarella H, landell mgA. manejo conservacionista e reciclagem de nutrientes em cana-de-açúcar tendo em vista a colheita mecânica. Inf Agropec. 2011;124:8-13.
Sene m, Vepraskas mJ, naderman gC, Denton HP. Relationships of soil texture and structure to corn yield response to subsoiling. Soil Sci Soc Am J. 1985;49:422-7.