Revista Brasileira de
Engenharia Agrícola e Ambiental
Campina Grande, PB, UAEA/UFCG – http://www.agriambi.com.br
v.19, n.11, p.1072–1078, 2015
Water erosion and soil water infiltration in different stages
of corn development and tillage systems
Daniel F. de Carvalho
1, Eliete N. Eduardo
2, Wilk S. de Almeida
3,
Lucas A. F. Santos
4& Teodorico Alves Sobrinho
5DOI: http://dx.doi.org/10.1590/1807-1929/agriambi.v19n11p1072-1078
A B S T R A C T
This study evaluated soil and water losses, soil water infiltration and infiltration rate models in soil tillage systems and corn (Zea mays, L.) development stages under simulated rainfall. The treatments were: cultivation along contour lines, cultivation down the slope and exposed soil. Soil losses and infiltration in each treatment were quantified for rains applied using a portable simulator, at 0, 30, 60 and 75 days after planting. Infiltration rates were estimated using the models of Kostiakov-Lewis, Horton and Philip. Based on the obtained results, the combination of effects between soil tillage system and corn development stages reduces soil and water losses. The contour tillage system promoted improvements in soil physical properties, favoring the reduction of erosion in 59.7% (water loss) and 86.6% (soil loss) at 75 days after planting, and the increase in the stable infiltration rate in 223.3%, compared with the exposed soil. Associated to soil cover, contour cultivation reduces soil and water losses, and the former is more influenced by management. Horton model is the most adequate to represent soil water infiltration rate under the evaluated conditions.
Erosão hídrica e infiltração de água no solo
sob diferentes sistemas de cultivo do milho
R E S U M O
Neste estudo foram avaliados, sob chuva simulada, perdas de solo e de água, infiltração de água no solo e modelos para a estimativa da taxa de infiltração em sistemas de preparo de solo e fases da cultura do milho (Zea mays, L.). Os tratamentos foram: cultivo em nível, cultivo morro abaixo e solo exposto. A perda de solo e a infiltração em cada tratamento foram quantificadas para chuvas aplicadas por um simulador portátil, aos 0, 30, 60 e 75 dias após o plantio do milho. Na estimativa da taxa de infiltração foram empregados os modelos de Kostiakov-Lewis, Horton e Philip. Com base nos resultados obtidos verifica-se que a combinação de efeitos entre sistema de manejo do solo e fase da cultura do milho reduz as perdas de solo e de água. O sistema de preparo do solo em nível promoveu melhorias nas propriedades físicas do solo favorecendo, aos 75 DAP, redução do processo erosivo em 59,7% (perda de água) e 86,6% (perda de solo) e aumento da taxa de infiltração estável de água no solo em 223,3%, em relação ao tratamento solo exposto. Associado à cobertura do solo, o cultivo em nível reduz as perdas de solo e de água, sendo a primeira mais influenciada pelo manejo. O modelo de Horton é o mais adequado para representar a taxa de infiltração de água no solo nas condições avaliadas.
Key words: soil loss infiltration rate soil tillage rainfall simulator
Palavras-chave: perda de solo taxa de infiltração preparo do solo simulador de chuva
1 Departamento de Engenharia/Instituto de Tecnologia/Universidade Federal Rural do Rio de Janeiro. Seropédica, RJ. E-mail: [email protected] (Autor
correspondente)
2 Departamento de Ciência do Solo/Universidade Federal de Lavras. Lavras, MG. E-mail: [email protected] 3 Departamento de Solos/Universidade Federal Rural do Rio de Janeiro. Seropédica, RJ. E-mail: [email protected]
4 Instituto de Agronomia/Universidade Federal Rural do Rio de Janeiro. Seropédica, RJ. E-mail: [email protected]
5 Faculdade de Engenharias, Arquitetura e Urbanismo e Geografia/Universidade Federal de Mato Grosso do Sul. Campo Grande, MS. E-mail:
Introduction
Erosion is one of the main environmental problems with respect to the degradation of soil and quality of water resources (Carvalho et al., 2014), being strongly influenced by soil management (Telles et al., 2011). Water erosion is a mechanical process involving the energy from the impact of raindrops on soil surface, directly associated with rainfall kinetic energy and the shear stress corresponding to the surface runoff itself (Panachuki et al., 2011). Erosion depends on many factors, like soil texture and structure, soil water content before the rain event, rainfall intensity, soil use and management, type and density of vegetal cover, slope inclination (Vahabi & Nikkami, 2008) and also on soil tillage techniques, crop type and planting orientation (Basic et al., 2004).
The methods of soil tillage vary in extension of the worked soil surface, tillage depth and degree of fragmentation of the mobilized soil mass. Management practices promote different physical conditions in surface and subsurface, which result in varied levels of erosion. The magnitude of this process is related, among other factors, to the soil water infiltration rate (Assouline & Ben-Hur, 2006), which is directly affected by the impact of raindrops on the soil. The impact energy can cause sealing in the superficial layer of uncovered soils, with consequent reduction in infiltration capacity and increase in surface runoff and its transport capacity (Sidiras & Rotjh, 1987).
The phenomena related to erosion, infiltration and surface runoff can be studied under both natural and simulated rains. Although studies under natural conditions are desirable, spatial and temporal distribution of the characteristics of natural rain cannot be controlled and, therefore, data acquisition is slow and difficult. On the other hand, rain simulators have been successfully used in different studies on surface runoff (Pérez-Latorre et al., 2010), soil crusting (Abudi et al., 2012), soil water infiltration (Panachuki et al., 2011) and soil erosion (Valette et al., 2012).
The combination of factors associated with rainfall, crop development stages and types of soil tillage and cover, is essential in the study of water erosion (Prasuhn, 2012). On the other hand, soil water infiltration has been measured through methods that do not express the dynamic condition of the impact of water on the soil (Sidiras & Roth, 1987), contrary to the rain simulator used in this study.
Given the economic importance of the corn crop, this study evaluated the effect of soil tillage and corn development stages on soil and water losses, infiltration characteristics and performance of infiltration rate estimation models, under simulated rain.
Material and Methods
The experimental area, located in the municipality of Seropédica-RJ, Brazil, has soil classified as Red Yellow Argisol (605 g kg-1 of sand, 109 g kg-1 of silt and 286 g kg-1 of clay) with
mean declivity of 0.09 m m-1. Soil physical properties (bulk
density, macroporosity, microporosity and total porosity) were determined in the layers of 0-10 and 10-20 cm, after applying
the simulated rains. The soil was conventionally prepared, with one plowing and two harrowings before the rainy season. Tillage orientation varied according to the management systems: i) corn rows planted along contour lines (CCL), in a spacing of 1.0 m between furrows and 0.3 m between plants, with conventional soil tillage also along contour lines; ii) corn rows planted down the slope (CDS) with conventional soil tillage also down the slope and the same crop spacing; and iii) exposed soil (ES) with conventional soil tillage down the slope, maintaining the soil uncovered during the experiment through manual weeding.
The rain simulator used in the experiment, developed by Alves Sobrinho et al. (2008), was calibrated to apply rains with intensity of 60 mm h-1, according to the methodology normally
adopted in studies of this nature (Panachuki et al., 2011). The tested plot that received the precipitation had an area of 0.70 m2, delimitated by galvanized steel plates that remained fixed
in the area during the entire evaluation period, corresponding to the corn crop cycle. One side of the plots had a funnel-like structure to allow the collection of the drained volume.
Simulated rains were applied in four occasions along crop development: at 0, 30, 60 and 75 days after planting (DAP). Therefore, soil and water losses and infiltration rates were evaluated in the three soil tillage systems and in four moments. The treatments, corresponding to soil management systems and moments of rain application, were arranged in a randomized design, using a factorial scheme with four replicates in each treatment, totaling 48 experimental units. The erosivity of each simulated rain event was calculated using its characteristics (intensity, duration, mean raindrop diameter, service pressure and height of sprinkler nozzles), according to the methodology described by Carvalho et al. (2005).
Before the tests using the simulator, the plots were pre-wetted with a drip system in order to make soil water contents uniform, according to Panachuki et al. (2011). Field tests lasted for 60 min, starting from the beginning of runoff. The time interval from the beginning of the application of each rain until the observation of outflow from the collecting gutter was measured and referred to as ‘time for the beginning of runoff ’, also denominated ‘time for the occurrence of initial abstractions’. When the outflow started, water volumes were collected from the funnel-like structure during 1 min and stored in recipients. The interval between collections was 1 min, and 30 samples of water volume were collected in each test. In the laboratory, the collected material was agitated and poured into graduated cylinders, which received 10 mL of aluminum sulfate solution at 0.018 mol L-1 in order to flocculate
the suspended material, thus facilitating the separation of sediments. After decantation of solids, the excess of water was removed using a siphon and the material was dried in an oven at 105 ºC. Then, the soil mass in the samples and the total mass proportional to the outflow volume collected in each event were determined. Water loss was determined from the total water depth drained superficially, considering the 30 samples of each test with the rain simulator.
calculated every minute through the relationship between the drained water volume and the area of the plot receiving the simulated rain. Thus, the infiltration rate was obtained by the relationship between the infiltrated water volume and the considered interval of collection time. The final infiltration rate was obtained when the stabilization of the superficially drained water depth was observed.
From the data of soil water infiltration, the parameters of the models proposed by Kostiakov-Lewis (Eq. 1), Horton (Eq. 2) and Philip (Eq. 3), which are the most used for the estimation of infiltration rate, were fitted according to Assouline (2013).
1 f i= + αi ktα−
( ) t
f o f
i= +i i +i e−β
0.5 1
i b kt
2 −
= +
where:
i - estimated instantaneous infiltration rate, mm h-1;
io - observed initial infiltration rate, mm h -1;
if - final infiltration rate, mm h-1;
α, β, k, b and k - statistical parameters of the models estimated through non-linear regression using the Gauss-Newton method; and
t - infiltration time, min.
The initial infiltration rate (io) was obtained by the
difference between the application intensity of the simulator and the outflow rate obtained in the first collection of each test.
The values of soil physical attributes, soil losses, surface runoff and soil water infiltration were subjected to analysis of variance, and Tukey test was applied when the p-value was significant at 0.05 probability level (p < 0.05).
In the evaluation of the models performance, a joint analysis of many indices is necessary, because a model can adequately fit the experimental data, according to the index, while the actual studied process is not well represented. Thus, besides the determination coefficient (R2), the following statistical
indices were used: standard error of the estimate (SEE) (Eq. 4), coefficient of residual mass (CRM) (Eq. 5), coefficient of adjustment (CA) (Eq. 6) and efficiency (EF) (Eq.7).
( ) n 2 i i I 1 O P SEE n 1 = − = −
∑
n n i iI 1 I 1 n i I 1 O P CRM O = = = − =
∑
∑
∑
(
)
(
)
n 2 i I 1 n 2 i I 1 O O CA P O = = − = −∑
∑
(
)
( )(
)
n 2 n
2
i i i
I 1 I 1
n 2
i I 1
O O O P
EF O O = = = − − − = −
∑
∑
∑
Means followed by the same letter, in the same column, do not differ by Tukey test at 0.05 probability level
Table 1. Mean values for the attributes soil density (Ds), macroporosity (Macro), microporosity (Micro) and total porosity (Total) (1) (2) (3) (4) (5) (6) (7) where:
Oi - observed data;
Pi - data estimated by the respective models; n - number of observations; and
O - arithmetic mean of the observations.
If the observed value of the evaluated variable is close to the estimated value, CRM becomes closer to zero. Positive CRM values indicate that the model underestimates the measurements and negative values indicate that it overestimates them. Better fitting is observed when R2, CA and EF values
become close to the unit. Negative EF values indicate that the observed mean value represents the estimation for the variable better than the estimated value.
Results and Discussion
Macroporosity in the layer of 10-20 cm and total porosity in the two soil layers in CCL were higher than in the other treatments (p < 0.05). On the other hand, soil density in the layer of 10-20 cm in ES was higher compared with the other treatments (Table 1). Tillage along contour lines associated with the crop root system promoted higher soil stability, thus decreasing losses of soil and water. According to Santos et al. (2014), in areas under conventional tillage, in comparison to conservational systems, higher microporosity and lower soil density are normally quantified immediately after the disturbance of the arable layer. However, soil water infiltration can decrease in the initial period of crop development, since the pulverization of soil aggregates and the breaking of pore continuity cause the sealing of soil surface due to the impact of raindrops.
During the conduction of the experiment (September 22 to December 17, 2011), a mean accumulated water depth of 245 mm was applied by the rain simulator, and natural precipitations totaled 137 mm . The simulated rains promoted mean accumulated erosivity of 3,728 MJ mm ha-1 h-1. According
to Machado et al. (2013), the mean annual erosivity in the region of Seropédica-RJ is 5,960.4 MJ mm ha-1 h-1, with
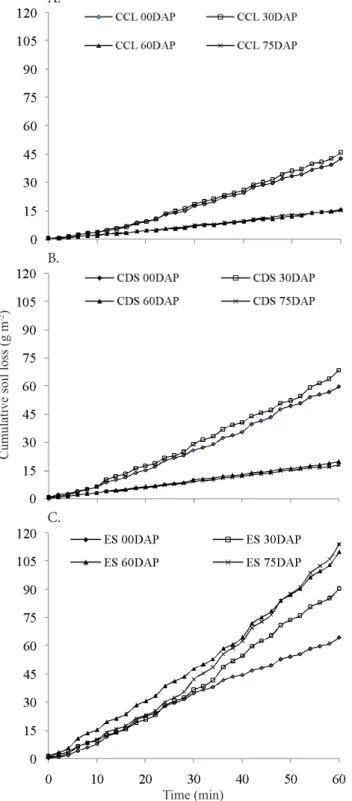
Soil losses in the initial crop development stage (0 to 30 DAP) showed more variation in ES (Figure 1), which showed the highest magnitude of the losses, due to the direct impact of raindrops. This impact disaggregates soil particles and decreases macroporosity; thus, water runoff is intensified, surface roughness decreases and there is a consequent increase in the production and transport of sediments. In ES, there was an increase of soil losses until 75 DAP. For CCL and CDS, increasing losses were observed until 30 DAP, decreasing after this period to approximately 1/3 (Figure 1A) and 1/4 (Figure
1B) of the value observed at the beginning of the cycle (0 DAP). The CCL system promoted the lowest soil losses, especially at the end of the crop cycle (60 and 75 DAP). Vegetal cover, as an isolated factor, had the highest effect on the dissipation of the kinetic energy of raindrops (Panachuki et al., 2011). Therefore, when associated with other conservational practices like contour planting (CCL), vegetal cover causes the water to be retained in the small superficial depressions formed by the planting rows, as it reaches the soil surface with lower velocity. Thus, the formation of puddles protects the soil and reduces the amount of disaggregated soil particles.
The effects of soil cover by corn plants on soil losses is observed from 30 DAP on in CCL and CDS, with lower losses in comparison to ES. Therefore, vegetal cover acts efficiently in the reduction of soil losses. However, until 30 DAP, the erosive process is more intense, because the soil is loose and disaggregated with little cover by corn plants (CCL, CDS) or even without vegetal cover (ES).
The mean values of drained water depths were equal between the management systems in the first two evaluations (0 and 30 DAP), when soil tillage has greater effect on the erosive process. At 60 and 75 DAP, the drained water depths in CCL and CDS were equal and determined by the vegetal cover of corn plants (Table 2). From the third evaluation on, differences in water loss were observed between ES and the others, indicating greater effect of vegetal cover on the reduction of surface runoff, in comparison to the type of soil tillage. Probably, the superficial sealing in ES increased surface runoff. On the other hand, contour planting associated with soil cover reduces the drained water depth due to higher water infiltration, since the continuity of macropores was not altered in this system (Table 1).
Therefore, the combination of effects between soil tillage systems and corn development stages reduced water losses by 0.6, 7.8 and 51.0% (CCL) and by 41.5, 59.7 and 39.3% (CDS) compared with exposed soil, respectively at 30, 60 and 75 DAP. The respective reductions in soil losses were 49.2, 24.2 and 85.5% (CCL) and 82.0, 86.5 and 84.2% (CDS), compared with exposed soil.
The presence of vegetal cover minimizes soil and water losses, regardless of the crop species cultivated in the soil. Studying water erosion in soil management systems and soybean phenological stages under simulated rain, Engel et al. (2009) concluded that soil losses were explained by canopy cover, cultivation system and the previous vegetal cover incorporated into the arable soil layer. Evaluating the erosive process in corn cultivation under conventional tillage, Volk
Figure 1 . Evolution of soil losses in the systems CCL (A), CDS (B) and ES (C) during 60 min of simulated rain for the four corn development stages: 0, 30, 60 and 75 days after planting (DAP)
Time (min)
C. B. A.
Cumulative soil loss (g m
-2)
Means followed by the same letter, in the column, do not differ by Tukey test at 0.05 probability level
Table 2. Mean values of superficially drained water depth
(SDWD) in the treatments of corn planted along contour
lines (CCL), corn planted down the slope (CDS) and
& Cogo (2014) observed greater soil losses in the beginning of the cycle.
Tillage and planting along contour lines form barriers and, consequently, reduce losses of water and soil. Another factor that minimizes soil and water losses is the root system of corn, because plants of the Poaceae family have roots well adapted for the control of erosion, due to their capacity to decrease flow intensity and soil particle disaggregation, acting like small obstacles and retarding surface runoff. From a certain development stage on, in this study 60 DAP, plant canopy promotes soil cover, which, associated with root system, causes a certain stabilization of water losses in CCL and CDS. From the results obtained in this study, soil losses are more influenced by management than water losses are, especially in the initial stage of the crop cycle.
The effect of CCL is observed in the end of the period, reducing surface runoff and increasing the stable infiltration rate (SIR). SIR values were close to 20 mm h-1 from 0 to 30
DAP, above 30 mm h-1 at 60 DAP and close to 40 mm h-1 at
75 DAP, when soil cover by corn plants was greater in the studied periods (Table 3). In CDS, the evaluation period
did not interfere with the stable infiltration rate; however, stable infiltration rates are higher compared with ES, which evidences the effect of vegetal cover on the increase of soil water infiltration, even in systems without the adoption of conservational practices.
The combination of effects between management systems and corn crop cycle interfered with soil water infiltration rate. The effects of CCL and CDS are observed from 60 DAP on, when SIR increases in ES, reducing surface runoff. SIR mean values in CCL and CDS were equal (p > 0.05) in all corn development stages. In spite of that, at 60 and 75 DAP, SIR values in CCL and CDS were higher compared with ES, due to the higher vegetal cover by the crop. Santos et al. (2014) obtained SIR values from 17 to 54 mm h-1 for the conditions
of conventional and minimum tillage in a Red Argisol with texture similar to that of the soil in the present study. The highest SIR value obtained by Santos et al. (2014) for the exposed soil is attributed to the presence of 3 Mg ha-1 of crop
residues on soil surface.
In the systems CCL and CDS, the roughness of soil surface promoted by tillage initially favors infiltration in both systems, because water is retained in the depressions on soil surface. On the other hand, the infiltration rate in ES decreased along the days after soil tillage, i.e., as DAP increased, infiltration rate decreased, the time for the beginning of runoff decreased and, consequently, the drained water depth increased. This behavior is probably related to the sealing of soil surface, which was more expressive in ES.
Tillage systems and rain conditions are among the factors that alter soil surface roughness. The volume and intensity of rains gradually decrease roughness (Bertol et al., 2006). Rosa et al. (2012), under simulated rain conditions, concluded that roughness is initially high in the conventional cultivation system and decreases after a maximum rain. This explains the
Means followed by the same letter, in the column, do not differ by Tukey test at 0.05 probability level. DAP - Days after planting
Table 3. Time for the beginning of runoff and infiltration
rate
*CCL – Corn planted along contour lines, CDS – corn planted down the slope and ES – exposed soil; DAP – Days after planting
variation pattern of the infiltration rate in ES in the present study.
The study confirmed the beneficial effect of maintaining soil cover on conservation, improvement of soil physical properties and on avoiding the formation of superficial sealing, which reduces soil water infiltration. Another aspect to be considered is the longer time for the beginning of runoff in CCL and CDS, at 60 DAP, which decreases the possibility of soil losses through water erosion. In CDS, this interval was longer than in the other systems at 0 and 75 DAP. Longer times for the beginning of runoff result from greater roughness on soil surface (Volk & Cogo, 2014), which favors higher soil water infiltration.
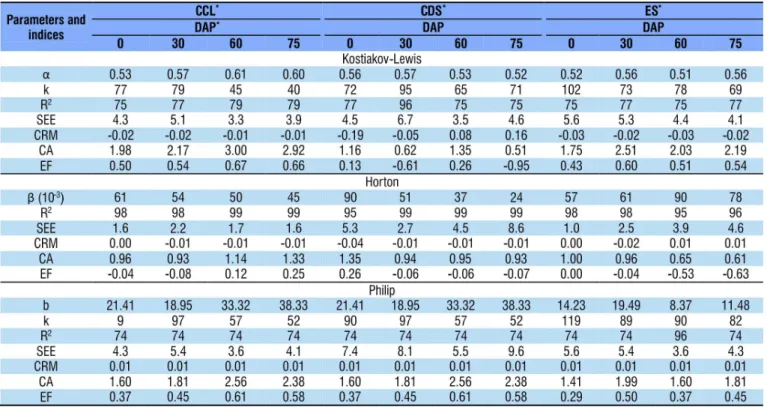
In general, the quality of fitting for the analyzed infiltration rate models was satisfactory, especially Horton’s, which promoted the lowest values of standard error of the estimate (SEE) in CCL and CDS. On the other hand, the highest SEE values were obtained in CDS for all the evaluated models, since the estimates were significantly lower than values observed at the field. In CCL, the fittings of the models of Kostiakov-Lewis and Philip to the field data were similar for the different corn development stages. The values of determination coefficient (R2) and CA close to the unit and CRM close to zero indicated
better quality of fitting for the model of Horton, i.e., the estimated values were close to those observed at the field, indicating a good fitting of these indices. Higher R2 values were
obtained when data were fitted to the model of Horton along the crop cycle, in comparison to the other models (Table 4).
Santos et al. (2014) observed better performance of Horton’s model when studying the effect of management systems on water infiltration, after the cultivation of common beans in a Red Argisol with granulometry similar to that of the soil in this study. Therefore, under dynamic conditions of water application using rain simulators, the model of Horton is the most adequate for the estimation of instantaneous infiltration rate, because it shows higher consistency compared with the others, considering greater effect of soil disturbance in the beginning of the cultivation and higher influence of vegetal cover at the end.
Conclusions
1. The combination between soil tillage system and crop development stages interferes with soil and water losses. Initially, the type of tillage has higher influence on the erosive process and, along crop development, soil and water losses decrease.
2. In cultivation systems under conventional soil tillage, the adoption of techniques like contour planting, associated with greater soil cover due to the natural development of the crop, reduces soil and water losses.
3. In conventional tillage systems, the effect of soil disturbance on the increase of soil water infiltration is temporary and occurs in the beginning of the cultivation, after soil tillage, with a subsequent decrease. As soil cover increases due to crop growth and development, water infiltration increases, especially in the end of the cycle.
4. Horton’s model is the most adequate to represent soil water infiltration rate, regardless of the soil tillage system used.
Acknowledgments
To the Federal Rural University of Rio de Janeiro (UFRRJ); to the Coordination for the Improvement of Higher Education Personnel (CAPES) and to the Research Support Foundation of Rio de Janeiro (FAPERJ), for granting the scholarships.
Literature Cited
Abudi, I.; Carmi, G.; Berliner, P. Rainfall simulator for field runoff studies. Journal of Hydrology, v.454-455, p.76-81, 2012. http:// dx.doi.org/10.1016/j.jhydrol.2012.05.056
Alves Sobrinho, T.; Macpherson, H. G.; Gómez, J. A. A portable integrated rainfall and overland flow simulator. Soil Use Management, v.24, p.163-170, 2008. http://dx.doi.org/10.1111/ j.1475-2743.2008.00150.x
Assouline, S. Infiltration into soils: Conceptual approaches and solutions. Water Resources Research, v.49, p.1-18, 2013. http:// dx.doi.org/10.1002/wrcr.20155
Assouline, A.; Ben-Hur, M. Effects of rainfall intensity and slope gradient on the dynamics of interrill erosion during soil surface sealing. Catena, v.66, p.211-220, 2006. http://dx.doi.org/10.1016/j. catena.2006.02.005
Basic, F.; Kisic, I.; Mesic, M.; Nestroy, O.; Butorac, A.Tillage and crop management effects on soil erosion in central Croatia. Soil & Tillage Research, v.78, p.197-206, 2004. http://dx.doi. org/10.1016/j.still.2004.02.007
Bertol, I.; Amaral, A. J.; Vazquez, E. V.; Gonzalez, A. P.; Barbosa, F. T.; Brignoni, L. F. Relations of soil surface roughness with the rainfall volume and water aggregate stability. Revista Brasileira de Ciência do Solo, v.30, p.543-553, 2006. http://dx.doi.org/10.1590/ S0100-06832006000300014
Carvalho, D. F.; Durigon, V. L.; Antunes, M. A. H.; Almeida, W. S.; Oliveira, P. T. S. Predicting soil erosion using Rusle and NDVI time series from TM Landsat 5. Pesquisa Agropecuária Brasileira, v.49, p.215-224, 2014. http://dx.doi.org/10.1590/S0100-204X2014000300008
Carvalho, D. F.; Montebeller, C. A.; Franco, E. M.; Valcarcel, R.; Bertol, I. Padrões de precipitação e índices de erosividade para as chuvas de Seropédica e Nova Friburgo, RJ. Revista Brasileira de Engenharia Agrícola e Ambiental, v.9, p.7-14, 2005. http:// dx.doi.org/10.1590/S1415-43662005000100002
Engel, F. L.; Bertol, I.; Ritter, S. R.; González, A. P.; Paz-Ferreiro, J.; Vázquez, E. V. Soil erosion under simulated rainfall in relation to phenological stages of soybeans and tillage methods in Lages, SC, Brazil. Soil & Tillage Research, v.103, p.216-221, 2009. http:// dx.doi.org/10.1016/j.still.2008.05.017
Machado, R. L.; Carvalho, D. F.; Rouws, J. R. C.; Gomes, D. P.; Eduardo, E. N. Erosividade das chuvas associada a períodos de retorno e probabilidade de ocorrência no estado do Rio de Janeiro. Revista Brasileira de Ciência do Solo, v.37, p.529-547, 2013. http://dx.doi. org/10.1590/S0100-06832013000200024
Pérez-Latorre, F. J.; Castro, L.; Delgado, A. A comparison of two variable intensity rainfall simulators for runoff studies. Soil & Tillage Research, v.107, p.11-16, 2010. http://dx.doi.org/10.1016/j. still.2009.12.009
Prasuhn, V. On-farm effects of tillage and crops on soil erosion measured over 10 years in Switzerland. Soil & Tillage Research, v.120, p.137-146, 2012. http://dx.doi.org/10.1016/j. still.2012.01.002
Rosa, J. D.; Cooper, M.; Darboux, F.; Medeiros, J. C. Soil roughness evolution in different tillage systems under simulated rainfall using a semivariogram-based index. Soil & Tillage Research, v.124, p.226-232, 2012. http://dx.doi.org/10.1016/j. still.2012.06.001
Santos, M. A. N.; Panachuki, E..; Alves Sobrinho, T.; Oliveira, P. T. S.; Rodrigues, D. B. B. Water infiltration in an Ultisol after cultivation of common bean. Revista Brasileira de Ciência do Solo, v.38, p.1143-1152, 2014. http://dx.doi.org/10.1590/S0100-06832014000500026
Sidiras, N.; Roth, C. H. Infiltration measurements with double-ring infiltrometers and a rainfall simulator under different surface conditions on an Oxisol. Soil & Tillage Research, v.9, p. 161-168, 1987. http://dx.doi.org/10.1016/0167-1987(87)90082-1
Telles, T. S.; Guimarães, M. F.; Dechen, S. C. F. The costs of soil erosion. Revista Brasileira de Ciência do Solo, v.35, p.287-298, 2011. http:// dx.doi.org/10.1590/S0100-06832011000200001
Vahabi, J.; Nikkami, D. Assessing dominant factors affecting soil erosion using a portable rainfall simulator. International Journal of Sediment Research, v.23, p.376-386, 2008. http://dx.doi. org/10.1016/S1001-6279(09)60008-1
Valette, G.; Prévost, S.; Léonard, J.; Lucas, L. A virtual discrete rainfall simulator. Environmental Modelling & Software, v.29, p.51-60, 2012. http://dx.doi.org/10.1016/j.envsoft.2011.10.003