Bone Characteristics of Broilers Fed Diets
Containing Different Lipid Sources
Mail Address
Keywords Author(s)
Arrived: November/2008 Approved: February/2009
ABSTRACT
Two experiments were carried out to evaluate the performance, abdominal fat yield, and bone parameters of broiler chickens fed diets containing different lipid feedstuffs as energy source. During the starter phase (1 to 21 days) of Experiment 1, a completely randomized design with four treatments with eight replicates of 49 birds each one was applied. Broilers were fed starter diets formulated with different lipid sources: soybean oil (SO), cottonseed oil (CO), poultry offal oil (PO), and beef tallow (BT). During the finisher phase (21 to 42 days) of Experiment 1, each initial treatment was divided in two experimental groups: one fed the same fat ingredient as the previous period, and the other fed SO as energy source. Thus, during this period, a completely randomized design with seven treatments, four replicates, and 43 broilers per experimental unit was tested. During the starter phase (1 to 21 days) of Experiment 2, all broilers were fed with the same soybean oil-supplemented diet. The experimental groups were divided during the finisher phase (21 to 42 d) in a completely randomized design with five treatments groups with six replicates of 30 birds each. During this period, treatments consisted of diets formulated with SO, rapeseed oil (RO), sunflower oils (SFO), PO, or BT as lipid sources. No effects (P>0.05) of the treatments on any of the studied parameters were observed in either experiment. Results suggest that there is no influence of animal or vegetable dietary lipid sources on performance, abdominal fat deposition, or tibia density and strength in broilers.
INTRODUCTION
Improvement in genetic selection for fast growth has resulted in early-finishing broilers with high muscle deposition. However, broiler bone tissue growth has not suffered the same influence of these physiologic processes, consequently increasing the incidence of leg problems and bone weakness.
Bird skeletal development and bone modeling of birds are highly influenced by a complex interaction among genetic potential, environment, and nutrition (Watkins et al., 2001). Some studies showed the influence of dietary lipid source on bone tissue development and cell membrane phospholipid composition, influencing bone cell function (Watkins et al., 2000; Liu & Denbow, 2001).
Improved performance and bone mineralization was observed when linseed oil was added to the diet of 1-7-d-old broilers, without any positive effects on subsequent breeding (Garcia, 2006). In addition, studies both with birds and mammalians showed the inhibitory influences of polyunsaturated fatty acids in fat tissue synthesis (Ntambi, 1991; Sanz et al., 2000). These effects may explain why polyunsaturated fatty acids decreased abdominal fat deposition.
Potença A1*
Murakami AE1
Fernandes JIM2
Matsushita M3
Nakagawa EL1
1
Animal Science Department - PPZ/UEM. Maringá, PR.
2
Animal Science Department - UFPR/ Palotina, PR.
3
Chemistry Department - UEM/Maringá, PR.
Alexandra Potença
Universidade Estadual de Maringá Centro de Ciências Agrárias
Programa de Pós-Graduação em Zootecnia Bloco J45 Sala 14
Avenida Colombo, 5790. Zona 07 87.020-900. Maringá, PR, Brasil
E-mail: [email protected]
Thus, the main objective of this study was to evaluate the use of different dietary lipid sources on broiler performance, abdominal fat deposition, and bone characteristics.
MATERIAL AND METHODS
Two experiments were carried out at the poultry facilities of Iguatemi Experimental Farm (FEI), Maringá State University (UEM), Brazil.
Experiment 1
A number of 1,568 one-day-old male Cobb broilers, weighing 47.54g in average, were housed in a conventional broiler house divided into 30 boxes of 6.3 m2 each, covered with straw litter, with enough space to raise 49 broilers up to 42 days of age. Broilers were vaccinated against Marek's disease just after hatching. No other vaccination was performed during the entire experimental period. A continuous 24-h light program from 1 to 10 days followed by 23-h of daily light up to 42 days of age was adopted. Water and feed were supplied ad libitum.
The feeding program was divided into two phases: starter, from 1 to 21 days, and finisher, from 22 to 42 days. The starter diets were formulated with different
lipids sources: soybean oil (SO), cottonseed oil (CO), poultry offal oil (PO), and beef tallow (BT). In the finisher phase, each starter treatment was divided into two other experimental groups: one was fed with the same lipid source of starter diet (SO, CO, PO or BT) and the other was fed with an SO-supplemented diet. Total lipid inclusion of the starter and finisher diets was 3% and 4.5%, respectively (Table 1).
A complete randomized design with five treatments, six replicates, and 50 broilers per experimental unit was used to test the starter diets (1 to 21 days). During the finisher phase (22 to 42 d), a completely randomized design with seven treatments, four replicates of 43 birds each was applied.
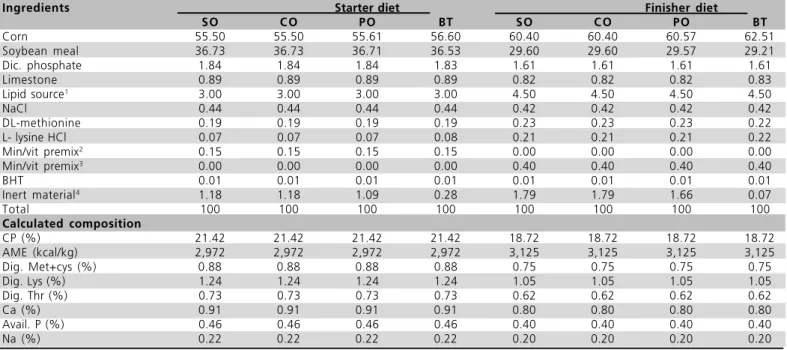
Experimental diets containing equal energy, amino acid, calcium, and phosphorus levels were formulated according to the recommendations of Rostagno et al. (2005) to meet the nutritional requirements of broilers during the starter (1 to 21 days) and finisher (22 to 42 days) phases of rearing. Percent and calculated compositions of experimental diets are presented in Table 1.
Performance data (weight gain, feed intake, and feed conversion), and mortality rate were calculated for the periods of 1 to 21, 22 to 42, and 1 to 42 days of age.
In order to evaluate bone parameters, two birds
Table 1 - Chemical and percent composition the starter (1 to 21 d) and finisher (22 to 42 d) diets. Experiment 1.
Ingredients Starter diet Finisher diet
SO C O PO BT SO C O PO BT
Corn 55.50 55.50 55.61 56.60 60.40 60.40 60.57 62.51 Soybean meal 36.73 36.73 36.71 36.53 29.60 29.60 29.57 29.21 Dic. phosphate 1.84 1.84 1.84 1.83 1.61 1.61 1.61 1.61
Limestone 0.89 0.89 0.89 0.89 0.82 0.82 0.82 0.83
Lipid source1
3.00 3.00 3.00 3.00 4.50 4.50 4.50 4.50
NaCl 0.44 0.44 0.44 0.44 0.42 0.42 0.42 0.42
DL-methionine 0.19 0.19 0.19 0.19 0.23 0.23 0.23 0.22 L- lysine HCl 0.07 0.07 0.07 0.08 0.21 0.21 0.21 0.22 Min/vit premix2 0.15 0.15 0.15 0.15 0.00 0.00 0.00 0.00
Min/vit premix3
0.00 0.00 0.00 0.00 0.40 0.40 0.40 0.40
BHT 0.01 0.01 0.01 0.01 0.01 0.01 0.01 0.01
Inert material4
1.18 1.18 1.09 0.28 1.79 1.79 1.66 0.07
Total 100 100 100 100 100 100 100 100
Calculated composition
CP (%) 21.42 21.42 21.42 21.42 18.72 18.72 18.72 18.72 AME (kcal/kg) 2,972 2,972 2,972 2,972 3,125 3,125 3,125 3,125 Dig. Met+cys (%) 0.88 0.88 0.88 0.88 0.75 0.75 0.75 0.75 Dig. Lys (%) 1.24 1.24 1.24 1.24 1.05 1.05 1.05 1.05 Dig. Thr (%) 0.73 0.73 0.73 0.73 0.62 0.62 0.62 0.62
Ca (%) 0.91 0.91 0.91 0.91 0.80 0.80 0.80 0.80
Avail. P (%) 0.46 0.46 0.46 0.46 0.40 0.40 0.40 0.40
Na (%) 0.22 0.22 0.22 0.22 0.20 0.20 0.20 0.20
from each experimental unit were euthanized by electric shock (220W) and bled at 21 and 42 days of age. Their left tibia was collected, cleaned, and stored at -18ºC for later bone density and strength analyses. Fat around the cloaca, bursa of Fabricius, proventriculus, and muscles adjacent to the abdomen considered as abdominal fat deposition -, was collected, weighed, and expressed as proportion of carcass weight without the head or feet.
Experiment 2
A number 900 one-day-old male Cobb broilers, weighing 49.22g in average, was used The same management procedures of Experiment 1 were here adopted.
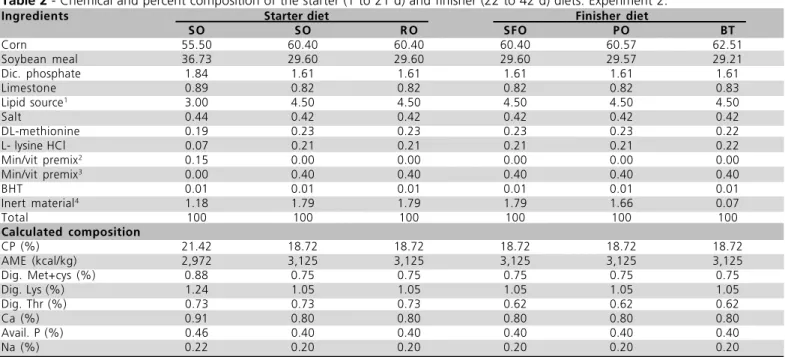
During the starter phase (1 to 21 days), all birds were fed a same ration supplemented with 3% SO as lipid source. Thereafter, broilers were fed with different final diets (22 to 42 days) supplemented with 4.5% of either soybean oil (SO), rapeseed oil (RO), sunflower oil (SFO), or beef tallow (BT). Total lipid inclusion in the finisher diet was 4.5% (Table 2).
During the finisher phase, a completely randomized design with five treatments with six replicates of 30 birds each was applied. Percent and calculated composition of the feeds are presented in Table 2.
The same protocol used in Experiment 1 for performance evaluation (22 to 42 days), bone characteristics (42 days) and fat deposition (42 days) was applied in Experiment 2.
Fatty acid profile of experimental rations
Lipid profile analysis was carried out at the Chemistry Laboratory of Universidade Estadual de Maringá. Lipids were extracted from the diets and meat according to the method of Bligh & Dyer (1959). Data were adjusted to 80% dietary humidity .
Triacylglyceride transesterification of samples was performed according to 5509 ISO (1978) method. A gas chromatograph with a flame ionization detector and capillary column of fused silica was utilized for fatty acids analysis. Clarity Lite software program determined peak areas, which were compared to the retention time standard of a methyl-ester-fatty acid (Sigma, EUA). Data were expressed as % fatty acid relative to total lipid amount in the samples.
Bone density
The tibia were thawed, and had the adjacent muscular tissues removed, and were weighed in an analytical scale (g ±0.0001). Tibia length was measured using an digital pachymeter (0 to 150 mm capacity,
Table 2 - Chemical and percent composition of the starter (1 to 21 d) and finisher (22 to 42 d) diets. Experiment 2.
Ingredients Starter diet Finisher diet
SO SO R O SFO PO BT
Corn 55.50 60.40 60.40 60.40 60.57 62.51
Soybean meal 36.73 29.60 29.60 29.60 29.57 29.21
Dic. phosphate 1.84 1.61 1.61 1.61 1.61 1.61
Limestone 0.89 0.82 0.82 0.82 0.82 0.83
Lipid source1
3.00 4.50 4.50 4.50 4.50 4.50
Salt 0.44 0.42 0.42 0.42 0.42 0.42
DL-methionine 0.19 0.23 0.23 0.23 0.23 0.22
L- lysine HCl 0.07 0.21 0.21 0.21 0.21 0.22
Min/vit premix2
0.15 0.00 0.00 0.00 0.00 0.00
Min/vit premix3
0.00 0.40 0.40 0.40 0.40 0.40
BHT 0.01 0.01 0.01 0.01 0.01 0.01
Inert material4
1.18 1.79 1.79 1.79 1.66 0.07
Total 100 100 100 100 100 100
Calculated composition
CP (%) 21.42 18.72 18.72 18.72 18.72 18.72
AME (kcal/kg) 2,972 3,125 3,125 3,125 3,125 3,125
Dig. Met+cys (%) 0.88 0.75 0.75 0.75 0.75 0.75
Dig. Lys (%) 1.24 1.05 1.05 1.05 1.05 1.05
Dig. Thr (%) 0.73 0.73 0.73 0.62 0.62 0.62
Ca (%) 0.91 0.80 0.80 0.80 0.80 0.80
Avail. P (%) 0.46 0.40 0.40 0.40 0.40 0.40
Na (%) 0.22 0.20 0.20 0.20 0.20 0.20
0.01 resolution). Seedor index, expressed as the ratio between tibia weight and length, was used to indicate bone density (Seedor et al., 1991).
Bone strength
Bone strength was analyzed at Laboratory of Building Materials and Soil Mechanics of the Technology Center of Maringá State University (UEM), and expressed in kgf. The support of the apparatus was fixed at the epiphysis of the tibia, and the force applied on the central portion of the diaphysis.
Statistical analysis
Performance and bone parameters data were submitted to ANOVA and Tukey's test at 5% probability using SAEG (1993) software package.
RESULTS AND DISCUSSION
Average maximum and minimum temperatures and relative humidity registered inside the poultry house in Experiment 1 were 29.28 ± 2ºC; 22.68 ± 1.75ºC; and 75.62 ±12.73%, respectively. Mortality rate during the total experimental period was 8.86%. In Experiment 2, average temperatures inside the poultry house were 30.71 ± 2.73ºC (maximum) and 22.59 ± 2.06ºC (minimum). Mortality rate recorded during Experiment 2 was 3%. The high mortality rate in Experiment 1 was due to the high incidence of omphalitis during the first week.
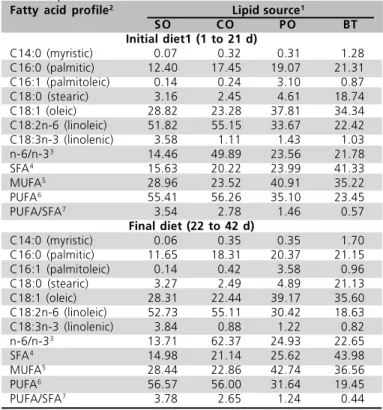
The fatty acid profiles of the diets of Experiments 1 and 2 are presented in Tables 3 and 4, respectively. Broiler performance and abdominal fat deposition results of Experiments 1 and 2 are shown in Tables 5 and 6, respectively.
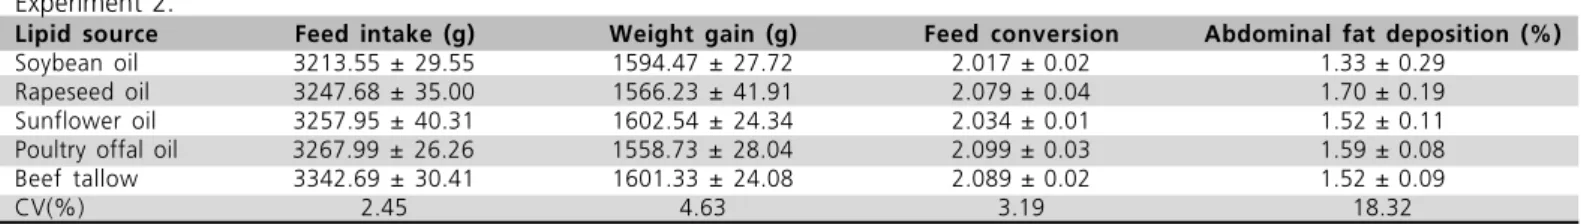
No differences in feed intake, weight gain, or feed conversion were observed among treatments (P<0.05) in either experiment.
Dietary lipid sources did not influence bird performance results. Broilers fed vegetable diets rich in polyunsaturated fatty acid (PUFA), containing SO, CO, RO and SFO, promoted similar performance as those fed diets formulated with animal lipid sources (PO and BT), which are rich in SFA. Therefore, fat saturation did not affect bird performance.
According to Noy & Sklan (1995), broilers older than four days of post-hatch life show an increase of feed intake and sufficient enzymatic activity and bile salt synthesis to hydrolyze and appropriately absorb fats. In the present experiments, the differences in dietary fatty acid profiles were probably not enough to cause
any effect on broiler performance, which is consistent with results of Lara et al. (2005) and Garcia (2006), who evaluated SO and PO as dietary lipid source. Only the last author observed some effect of the lipid sources included in the diet on the performance of 7-d-old broilers.
Table 3 - Fatty acid profile (%) of experimental initial and final
diets. Experiment 1.
Fatty acid profile2 Lipid source1
SO C O PO BT
Initial diet1 (1 to 21 d)
C14:0 (myristic) 0.07 0.32 0.31 1.28 C16:0 (palmitic) 12.40 17.45 19.07 21.31 C16:1 (palmitoleic) 0.14 0.24 3.10 0.87 C18:0 (stearic) 3.16 2.45 4.61 18.74 C18:1 (oleic) 28.82 23.28 37.81 34.34 C18:2n-6 (linoleic) 51.82 55.15 33.67 22.42 C18:3n-3 (linolenic) 3.58 1.11 1.43 1.03 n-6/n-33 14.46 49.89 23.56 21.78
SFA4
15.63 20.22 23.99 41.33 MUFA5
28.96 23.52 40.91 35.22 PUFA6
55.41 56.26 35.10 23.45 PUFA/SFA7
3.54 2.78 1.46 0.57 Final diet (22 to 42 d)
C14:0 (myristic) 0.06 0.35 0.35 1.70 C16:0 (palmitic) 11.65 18.31 20.37 21.15 C16:1 (palmitoleic) 0.14 0.42 3.58 0.96 C18:0 (stearic) 3.27 2.49 4.89 21.13 C18:1 (oleic) 28.31 22.44 39.17 35.60 C18:2n-6 (linoleic) 52.73 55.11 30.42 18.63 C18:3n-3 (linolenic) 3.84 0.88 1.22 0.82 n-6/n-33
13.71 62.37 24.93 22.65 SFA4
14.98 21.14 25.62 43.98 MUFA5
28.44 22.86 42.74 36.56 PUFA6
56.57 56.00 31.64 19.45 PUFA/SFA7
3.78 2.65 1.24 0.44
1 - SO = soybean oil; CO = cottonseed oil; PO = poultry offal oil; BT = beef tallow. 2 Results relative to total fatty acid composition. 3 -n-6/n-3: Omega 6 to Omega 3 fatty acid ratio. 4 - SFA: saturated fatty acids.5 - MUFA: monounsaturated fatty acids.6 - PUFA: polyunsaturated fatty acids.7 - PUFA/SFA = polyunsaturated fatty acid to saturated fatty acid ratio.
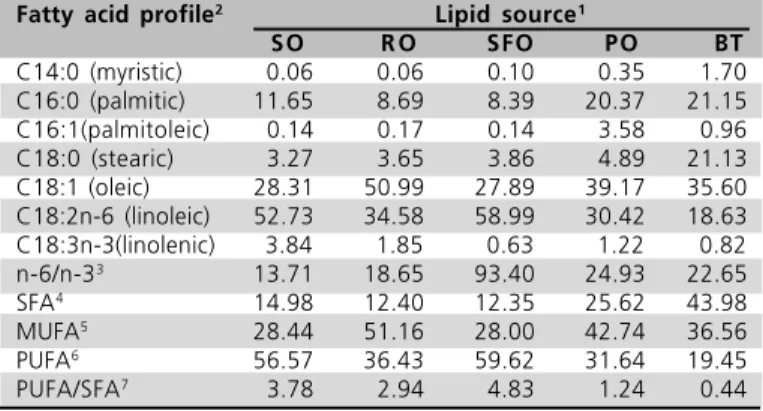
Also, in both experiments, dietary lipid sources did not affect abdominal fat deposition. The broilers fed diets containing PUFA-rich oils (SO, CO, RO, and FO) as lipid sources presented similar abdominal fat yield as those fed diets formulated with animal fats (PO and BT), which are rich in SFA. CO and SFO oils used in the diets of Experiment 1 and 2, respectively, have high omega-6 to omega-3 ratios (n-6/n-3) as compared to the other evaluated lipid sources; however, similar (P>0.05) abdominal fat deposition was observed among treatments.
supplemented with animals fats rich in SFA.
High n-6/n-3 ratios in CO and SFO used in Experiment 1 and 2, respectively, did not influence tibia density or bone strength. The different dietary fatty acid profiles were not enough to promote any effects on studied parameters, corroborating results found by Garcia (2006), who observed that lipid sources did not influence tibia strength and Seedor index of broilers.
CONCLUSION
Dietary lipid sources, either of vegetable or animal origin, do not affect broiler performance, abdominal fat deposition, or tibia density and strength. SFA and PUFA levels and n-6/n-3 ratio of the diet have no effects on abdominal fat deposition of broilers.
REFERENCES
Bligh EG, Dyer WJ. A rapid method of total lipid extraction and purification. Canadian Journal of Biochemistry and Physiology 1959; 37:911-917.
Crespo N, Esteve-Garcia E. Dietary fatty acid profile modifies abdominal fat deposition in broiler chickens. Poultry Science 2001; 80:71-778.
Crespo N, Esteve-Garcia E. Dietary polyunsaturated fatty acids decrease fat deposition in separable fat depots but not in the remainder carcass. Poultry Science 2002; 81:512-518.
Garcia ERM. Influência dos lipídios da ração sobre o desenvolvimento ósseo e sua composição lipídica em frangos de
Table 5 - Performance and abdominal fat deposition of broilers fed different lipid sources. Experiment 1.
Lipid source Feed intake (g) Weight gain, (g) Feed conversion Abdominal fat (%) 1 to 21 days
Soybean oil (SO) 1293.33±10.40 1003.13±10.31 1.289±0.00 -Cottonseed oil (CO) 1303.86±15.59 1011.82±13.00 1.289±0.00 -Poultry offal oil (PO) 1308.95 ± 9.66 1015.80±10.56 1.289±0.00 -Beef tallow (BT) 1310.00±15.01 998.72±16.02 1.312±0.01
-CV(%) 2.81 3.56 1.21
-22 to 42 days
SO (1-42d) 3416.64±16.63 2238.43±21.97 1.526±0.20 -CO oil (1-42d) 3440.76±29.80 2181.67±32.50 1.578±0.15 -PO (1-42d) 3356.17±68.27 2197.91±26.24 1.527±0.13 -BT (1-42d) 3451.77±69.95 2176.55±45.22 1.586±0.01 -CO (1-21d)/SO (22-42d) 3389.30±31.76 2238.78±27.61 1.514±0.01 -PO (1-21d)/SO (22-42d) 3384.70±22.56 2206.68±31.43 1.535±0.02 -BT (1-42d)/SO (22-42d) 3391.17±35.42 2,193.04±26.64 1.547±0.01
-CV (%) 2.45 2.89 2.10
-1 to 42 days
SO (1-42d) 4709.97±14.77 3241.56±15.80 1.453±0.01 1.488±0.90 CO oil (1-42d) 4750.72±46.81 3196.93±43.33 1.486±0.01 1.658±0.11 PO (1-42d) 4668.64±50.31 3211.42±5.76 1.454±0.01 1.742±0.16 BT (1-42d) 4769.10±71.31 3184.38±44.66 1.498±0.01 1.731±0.17 CO (1-21d)/SO (22-42d) 4687.07±48.55 3247.15±29.81 1.444±0.01 1.641±0.40 PO (1-21d)/SO (22-42d) 4687.39±23.27 3196.29±28.31 1.467±0.01 1.365±0.16 BT (1-42d)/SO (22-42d) 4696.61±39.81 3211.12±31.11 1.463±0.00 1.346±0.06
CV (%) 1.82 1.89 1.48 16.53
Crespo & Esteve-Garcia, 2001). Crespo & Esteve-Garcia (2002) found a reduction in abdominal fat deposition in broilers fed linseed oil (rich in n-3) as compared to birds supplied with BT as lipid source.
Table 4 - Fatty acid profile (%) of final diets (21 to 42 d). Experiment 2.
Fatty acid profile2 Lipid source1
SO R O SFO PO BT
C14:0 (myristic) 0.06 0.06 0.10 0.35 1.70 C16:0 (palmitic) 11.65 8.69 8.39 20.37 21.15 C16:1(palmitoleic) 0.14 0.17 0.14 3.58 0.96 C18:0 (stearic) 3.27 3.65 3.86 4.89 21.13 C18:1 (oleic) 28.31 50.99 27.89 39.17 35.60 C18:2n-6 (linoleic) 52.73 34.58 58.99 30.42 18.63 C18:3n-3(linolenic) 3.84 1.85 0.63 1.22 0.82 n-6/n-33 13.71 18.65 93.40 24.93 22.65
SFA4
14.98 12.40 12.35 25.62 43.98 MUFA5
28.44 51.16 28.00 42.74 36.56 PUFA6
56.57 36.43 59.62 31.64 19.45 PUFA/SFA7
3.78 2.94 4.83 1.24 0.44
1 - SO = soybean oil; RO = rapeseed oil; SFO = sunflower oil; PO = poultry offal oil; BT = beef tallow. 2 - Results relative to total fatty acid composition. 3 - n-6/n-3: Omega 6 to Omega 3 fatty acid ratio. 4 - SFA: saturated fatty acids.5 - MUFA: monounsaturated fatty acids. 6 - PUFA: polyunsaturated fatty acids. 7 - PUFA/SFA = polyunsaturated fatty acid to saturated fatty acid ratio.
Tibia strength values and Seedor index results of broilers fed different lipid sources in Experiments 1 and 2 are presented in Table 7.
corte [tese]. Maringá (PR): Universidade Estadual de Maringá; 2006.
International Organization For Standardization. Animal and vegetable fats and oils preparation of methyl esters of fatty acids [Method ISO 5509]. Geneve: ;1978. p. 1-6.
Lara JCL, Baião NC, Aguilar CAL. et al. Efeito de fontes lipídicas
adicionadas às dietas sobre o desempenho de frangos de corte. Arquivo Brasileiro Medicina Veterinária Zootecnia 2005; 57:792-798.
Liu D, Denbow DM. Maternal dietary lipids modify composition of bone lipids and ex vivo prostaglandin E2 production in early postnatal Japanese quail. Poultry Science 2001; 80:1344-1352. Noy Y, Sklan, D. Digestion and absorption in the young chick. Poultry Science 1995; 74:366-373.
Ntambi JM. Dietary regulation of stearoyl-CoA desaturase gene expression in mouse liver. Biological Chemistry 1991; 267:10925-10930.
Rostagno HS, Albino LFT, Donzel JL. et al.Tabelas brasileiras para
aves e suínos: composição de alimentos e exigências nutricionais.
2.ed. Viçosa: UFV; 2005.
Sanz M, Flores ,Pérez A. et al. Higher lipid accumulation in broilers fed on saturated fats than in those fed on unsaturated fats. British Poultry Science 1999; 40:94-101.
Sanz M, Lopes BCJ, Menoyo D. et al. Abdominal fat deposition and
fatty acid synthesis are lower and -oxidation is higher in broiler chickens fed diets containing unsatured rather than satured fat. Journal of Nutrition 2000; 30:3034-3037.
Seedor JG, Quarraccio HH, Thompson DD. The biophosphonate alendronate (MK-217) inhibits bone loss due to ovariectomy in rats. Bone and Mineral Research 1991; 6:339-346.
Universidade Federal de Viçosa. SAEG: manual de utilização do programa SAEG (Sistema para Análises Estatísticas e Genéticas). Viçosa (MG); 1993.
Watkins BA, Li Y, Allen KGD. et al. Dietary ratio of (n-6)/(n-3)
polyunsaturated fatty acids alters the fatty acid composition of bone compartments and biomarkers of bone formation in rats. Journal of Nutrition 2000; 130:2274-2284.
Watkins BA, Lippman HE, Le Bouteiller L, et al. Bioactive fatty acids: role in bone biology and bone cell function. Progress in Lipid Research 2001; 40:125-148.
Table 6 - Performance and abdominal fat deposition of broilers fed different lipid sources at final phase of 22 to 42days of age. Experiment 2.
Lipid source Feed intake (g) Weight gain (g) Feed conversion Abdominal fat deposition (%) Soybean oil 3213.55 ± 29.55 1594.47 ± 27.72 2.017 ± 0.02 1.33 ± 0.29
Rapeseed oil 3247.68 ± 35.00 1566.23 ± 41.91 2.079 ± 0.04 1.70 ± 0.19 Sunflower oil 3257.95 ± 40.31 1602.54 ± 24.34 2.034 ± 0.01 1.52 ± 0.11 Poultry offal oil 3267.99 ± 26.26 1558.73 ± 28.04 2.099 ± 0.03 1.59 ± 0.08 Beef tallow 3342.69 ± 30.41 1601.33 ± 24.08 2.089 ± 0.02 1.52 ± 0.09
CV(%) 2.45 4.63 3.19 18.32
Table 7 - Seedor index and bone strength of tibia from broilers
fed different lipid sources from 21 to 42 days of age. - Experiment 1 and 2.
Lipid source Seedor index Bone strength (mg/mm) (kgf) Experiment 1
21 days
Soybean oil (SO) 1.177 ± 0.01 15.36 ± 0.20 Cottonseed oil (CO) 1.203 ± 0.02 15.90 ± 0.56 Poultry offal oil (PO) 1.163 ± 0.02 15.07 ± 0.74 Beef tallow (BT) 1.193 ± 0.02 14.56 ± 0.54
CV* (%) 4.10 10.18
42 days
SO (1-42d) 2.034 ± 0.079 31.70 ± 2.021 CO oil (1-42d) 2.285 ± 0.101 31.33 ± 1.288 PO (1-42d) 2.337± 0.022 38.38 ± 2.351 BT (1-42d) 2.260 ± 0.072 30.37 ± 2.286 CO (1-21d)/SO (22-42d) 2.142 ± 0.065 35.81 ± 2.965 PO (1-21d)/SO (22-42d) 2.105 ± 0.066 28.28 ± 1.482 BT (1-42 d)/SO (22-42 d) 2.167 ± 0.023 33.73 ± 3.034
CV (%) 7.40 15.25
Experiment 2 42 days
Soybean oil 2.115 ± 0.053 28.62 ± 1.209 Rapeseed oil 2.123 ± 0.047 29.47 ± 2.255 Sunflower oil 2.200 ± 0.026 32.46 ± 1.693 Poultry offal oil 2.168 ± 0.080 33.64 ± 2.749 Beef tallow 2.288 ± 0.039 31.25 ± 2.017