www.ccarevista.ufc.br ISSN 1806-6690
Forms of soil organic phosphorus at black earth sites in the
Eastern Amazon
1Formas de fósforo orgânico do solo em sítios de terra preta na Amazônia Oriental
Adriane da Rocha Costa2*, Mário Lopes Silva Júnior2, Dirse Clara Kern3, Maria de Lourdes Pinheiro
Ruivo3 and Raphaël Marichal4
ABSTRACT -Soils containing archaeological black earth (ABE) are formed by the continuous deposition of organic residue, and maintain their high fertility even after years of cultivation. The aim of this study was to characterise and quantify the forms of organic phosphorus in areas of archaeological black earth (ABE), with a view to understanding the dynamics of the element and contributing to the development of sustainable practices of land use. Samples of 10 profiles were used from Latosols, Argisols and Gleysols located in the eastern Amazon with an anthropogenic A-horizon (ABE), using adjacent, non-anthropogenic soils as reference. The samples relative to the A, transitional and B-horizons, were subjected to sequential fractionation of P in an acid base extraction, and to further physicochemical characterisation. The acid-extracted P fraction in the A1 and B-horizons predominated over the basic-extractant labile and soluble fractions in all areas, displaying the highest percentages for the inorganic form. An increase in the labile organic phosphorus content (Pol) was found in the A1-horizon, with a reduction between the A and B-horizons of 97.6%. The amount of total phosphorus (TP) was significantly higher (6,778 mg dm-3) in the A-horizons of the ABE in comparison with the soil in the reference area (168 mg dm-3). The
predominance of inorganic phosphorus over organic phosphorus was found for the total fraction, while the opposite occurred with the labile fractions. Most of the total labile P is therefore accumulated in the organic fractions of the soil, and represents an active means of supplying the nutrient to plants as it mineralises.
Key words:Sequential fractionation. Anthropogenic soils. Labile phosphorus. Pyrogenic carbon.
RESUMO - Os solos com Terra Preta Arqueológica (TPA) são formados pela deposição contínua de resíduos orgânicos e mantêm sua fertilidade elevada mesmo após anos de cultivo. O objetivo do trabalho foi caracterizar e quantificar as formas de fósforo orgânico em sítios de Terra Preta Arqueológica (TPA), visando compreender a dinâmica desse elemento e contribuir com o desenvolvimento de práticas sustentáveis de uso do solo. Foram utilizadas amostras de 10 perfis com horizonte A antrópico (TPA) em Latossolos, Argissolos e Gleissolo, usando como referência solos adjacentes não antropogênicos, localizados na Amazônia Oriental. As amostras referentes aos horizontes A, horizonte de transição e B, foram submetidas ao fracionamento sequencial do P, em extrato ácido e básico e demais caracterizações físico-químicas. A fração de P em extrato ácido nos horizonte A1 e B predominou sobre as frações lábeis e solúvel em extrato básico em todas as áreas, apresentando os maiores percentuais observados na forma inorgânica. Verificou-se o aumento do conteúdo de fósforo orgânico lábil (Pol) no horizonte A1, com redução entre os horizontes A e B de 97,6%. O fósforo total (PT) apresentou teores significativamente elevados (6.778 mg dm-3) nos horizontes A de TPA em comparação com o mesmo horizonte no solo de referência (168 mg dm-3).
Na fração total observou-se o predomínio do fósforo inorgânico sobre o fósforo orgânico, enquanto que nas frações lábeis ocorreu o inverso. Portanto, a maior parte do P total lábil está acumulado nas frações orgânicas do solo, representando uma forma ativa para o fornecimento do nutriente aos vegetais à medida que se mineraliza.
Palavras-chave:Fracionamento sequencial. Solos antrópicos. Fósforo lábil. Carbono Pirogênico. DOI: 10.5935/1806-6690.20170001
*Autor para correspondência
1Recebido para publicação em 26/02/2014; aprovado em 17/03/2016
Parte da Dissertação de Mestrado da primeira autora apresentada ao Programa de Pós-Graduação da Universidade Federal Rural da Amazônia/UFRA
2Departamento de Solos e Nutrição Mineral de Plantas, Universidade Federal Rural da Amazônia, Av. Presidente Tancredo Neves, 2501, Terra Firme
Belém-Pará, Brasil, 66.077-830 [email protected], [email protected]
3Museu Paraense Emílio Goeldi, [email protected], [email protected]
INTRODUCTION
In the Amazon, anthropogenic soils known as Archaeological Black Earth (ABE), display high fertility related to the addition of organic residue and the presence of pyrogenic carbon resulting from biomass pyrolysis at temperatures over 600 °C, whose partial oxidation produces carboxyl groups that contribute to an increase in CEC, with a long-term increase in nutrient
levels (FRASER et al., 2011; GLASER; BIRK, 2012;
HOLLIDAY; GARTNER, 2007; KERN et al., 2010;
SANTOSet al.,2013; SILVAet al.,2012).
The anthropogenic A horizon occurs in discontinuous patches throughout the Amazon area over several orders of soil, such as Latosols Argisols, Gleysols and Neosols (SMITH, 1980). Sites can vary from 0.3 to 5 hectares (ha) in size, reaching hundreds of hectares in areas near rivers (COSTA; COSTA; KERN,
2013; KERN et al., 2010). These soils are generally
eutrophic in character, with high levels of nutrients in a form assimilated by plants, mainly calcium (Ca) and phosphorus (P), whose available content may be up to
3000 mg dm-3 (BARROSet al., 2012; CAMPOSet al.,
2011; GLASER; BIRK, 2012; KERN et al., 2010;
LIMAet al.,2002). Farmers recognize the benefits of
ABE to agricultural production, and use these areas mainly for subsistence farming (ARROYO-KALIN
et al., 2010; FRASER et al., 2011). However, such
sites are considered to be areas of cultural heritage of mandatory preservation, according to Federal Law No. 3924 of 26 July 1961.
In anthropological research, P can inform about past human occupation, and the duration and intensity of human activities (HOLLIDAY; GARTNER, 2007; SATO
et al.,2009; SOUZAet al., 2009). Moreover, P is a key
nutrient in agricultural areas, whose deficiency in the soil
directly affects crop development (DUDA et al.,2006;
DUDAet al.,2013.).
In Brazilian soils, such as Latosols, P is present mainly in forms which are unavailable to plants
(GUERRA et al., 1996; MERLIN; HE; ROSOLEM,
2013), especially forms of inorganic P with high-energy binding to the mineral fraction and to stable
organic forms (EBERHARDT et al., 2008; NOVAIS;
SMYTH, 1999; SÁNCHEZ-ALCALÁ et al., 2014).
After fertilization of these soils with superphosphate, around 85 to 90% of the P is unavailable to plants during the first year of application due to adsorption and precipitation with Fe, Al and Ca (GICHANGI; MNKENI; BROOKES, 2009). Management strategies are necessary to improve P usage efficiency in the soil, thereby reducing the high costs of adding mineral phosphate fertilizers.
The intake of organic material may contribute to a higher concentration of P in the soil and to an increase in the bioavailability of this nutrient in the long term for plants and soil organisms (BUSATO; CANELLAS; VELLOSO, 2005; MALIK; MARSCHNER; KHAN,
2012; NOGUEIRA et al., 2008; NOVAIS; SMYTH,
1999). In humid tropical soils, 32% of the total phosphorus (TP) on average is found in organic form, of which from 5 to 86% may be in the labile organic fraction (GUERRA
et al., 1996; HOLLIDAY; GARTNER, 2007), underlining
the importance of this fraction to the availability of P in
weathered soils (XAVIERet al., 2009).
Partelliet al. (2009) found a stock of total organic
P (Pot) accounting for up to 56.9% of the soil TP in
organic coffee plantations. On the other hand, Duda et
al. (2013) observed levels of labile organic phosphorus
(Pol) which ranged from 50 to 91% in relation to labile inorganic phosphorus (Pil) in 14 classes of soils in Brazil.
Mendoza et al. (2012) reported that in a Gleysol, even
with a predominance of the organic fraction, inorganic P displayed a higher stock of potentially available P.
The disposal of organic residue of plant and animal origin by past civilizations, associated with the intense use of fire, promotes an increase in total phosphorus (TP), changes the dynamics of the soil fractions and consequently the availability of P. The aim of this research was to characterise and quantify the forms of organic phosphorus in Archaeological Black Earth, using as a reference adjacent undisturbed areas, and generate information about the fertility potential of Latosols, Argisols and Gleysols in the tropics.
MATERIAL AND METHODS
The study was carried out at sites located in the eastern Amazon, in soils of the Order of Latosols Argisols and Gleysols (Table 1). The areas were defined as: a) of anthropogenic origin, Archaeological Black Earth (ABE); and b) soils adjacent to these sites, with no occurrence of anthropogenic processes (AD). Soil samples were
collected as per the methodology proposed by Santoset al.
(2005). The same horizons were selected, having different depths in each profile (A1, AB, BA, B).
The following were determined: pH in KCl 1 mol
L-1 in the proportion of 1:2.5; potential acidity (H+ + Al+3)
extracted with calcium acetate 0.5 mol L-1 at pH 7.0;
exchangeable Ca and Mg extracted with KCl 1 mol L-1;
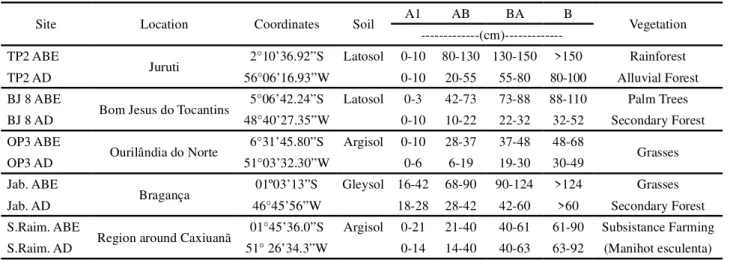
Table 1 - Characterisation of the Archaeological Black Earth sites at the sampling locations
TP2, Terra Preta 2; BJ8, Bom Jesus do Tocantins; OP3, Onça Puma 3; Jab., Jabuti; S.Raim., S.Raimundo
Site Location Coordinates Soil A1 AB BA B Vegetation
---(cm)---TP2 ABE
Juruti 2°10’36.92”S Latosol 0-10 80-130 130-150 >150 Rainforest
TP2 AD 56°06’16.93”W 0-10 20-55 55-80 80-100 Alluvial Forest
BJ 8 ABE
Bom Jesus do Tocantins 5°06’42.24”S Latosol 0-3 42-73 73-88 88-110 Palm Trees
BJ 8 AD 48°40’27.35”W 0-10 10-22 22-32 32-52 Secondary Forest
OP3 ABE
Ourilândia do Norte 6°31’45.80”S Argisol 0-10 28-37 37-48 48-68 Grasses
OP3 AD 51°03’32.30”W 0-6 6-19 19-30 30-49
Jab. ABE
Bragança 01º03’13”S Gleysol 16-42 68-90 90-124 >124 Grasses
Jab. AD 46°45’56”W 18-28 28-42 42-60 >60 Secondary Forest
S.Raim. ABE
Region around Caxiuanã 01°45’36.0”S Argisol 0-21 21-40 40-61 61-90 Subsistance Farming
S.Raim. AD 51° 26’34.3”W 0-14 14-40 40-63 63-92 (Manihot esculenta)
Table 2 - Chemical and granulometric characteristics of the soils studied in ABE and AD(1)
Site(2) Horiz.(3) pH K
+ Ca2+ Mg2+ H+Al CTCef V OM Sand Silt Clay
KCl ---(cmolc dm-3)--- (%) ---(g kg-1
)---TP2 ABE
A1 4.3 0.06 4.8 1.2 0.2 8.93 68 27.24 761 144 74
AB 5.1 0.02 2.5 0.6 0.2 6.62 47 14.95 743 102.5 134
BA 4.7 0.02 1.7 0.4 0.3 3.81 57 7.07 670 175.5 134
B1 4.6 0.02 1.6 0.4 2.7 3.53 58 5.57 657 168 154
TP2 AD
A1 4.4 0.05 0.3 0.2 1.5 2.10 29 11.59 729 176.5 74
AB 4.2 0.02 0.3 0.2 2.7 7.16 8 7.22 664 181 134
BA 4.5 0.02 0.3 0.1 2.8 5.73 8 3.37 647 198 134
B1 4.1 0.02 0.3 0.2 2.5 4.52 12 1.87 578 227.5 174
BJ8 ABE
A1 5.6 0.31 8.8 3.6 0.1 13.81 93 43.1 703 162.5 114
AB 5.1 0.05 2.7 0.6 0.1 4.23 80 18.01 646 159.5 174
BA 5.1 0.04 2.4 0.3 0.1 3.61 77 13.83 647 158 174
B1 5.1 0.04 2.4 0.4 0.1 3.70 77 9.29 585 180.5 214
BJ8 AD
A1 5.0 0.19 6.6 0.7 0.1 9.57 79 38.39 491 274 214
AB 5.0 0.08 2.9 0.8 0.1 5.32 72 8.27 447 278 254
BA 5.0 0.06 1.8 1.0 0.1 4.05 71 5.59 366 299 314
B1 5.1 0.07 1.8 1.0 0.1 3.91 75 4.95 351 314 314
OP3 ABE
A1 6.9 0.39 16.1 1.6 0.1 19.02 96 64.21 497 288 194
AB 5.2 0.07 5.0 2.4 0.1 9.81 76 29.38 499 246.5 234
BA 4.7 0.05 2.3 1.0 0.1 4.86 69 9.56 377 248.5 354
B1 5.3 0.13 2.6 0.6 0.1 5.19 65 14.38 387 238.5 354
OP3 AD
A1 5.2 0.23 7.4 1.6 0.1 11.64 80 58.31 458 387 134
AB 4.9 0.14 4.4 0.8 0.1 7.24 75 27.28 630 255 94
BA 5.3 0.14 3.0 0.9 0.1 5.92 69 19.85 577 308.5 94
Continued Table 2
and quantification of the granulometric fractions by the pipette method (EMBRAPA, 1997).
The TP was determined by nitro-perchloric
digestion (HNO3: HClO4) 1:1.5 (v/v), following the
methodology proposed by Olsen and Sommers (1982). The
Pol was obtained by extraction with NaHCO3 0.5 mol L-1
(BOWMAN; COLE, 1978). As per Bowman (1989), acid
extract inorganic phosphorus (Pi H+) was obtained from the
addition of 2 mL of concentrated H2SO4, then 50 mL NaOH
0.5 mol L-1were added to the centrifuge tube containing
the extraction residue so as to obtain the soluble base
extract phosphorus (Pi OH-). The total labile phosphorus
fractions (Ptl), both acid extract (Pt H+) and base extract
(Pt OH-), were determined by nitro-perchloric digestion
of 15 mL of the aliquots removed from the supernatant
resulting from the extractions with NaHCO3, H2SO4 and
NaOH respectively. The phosphorus contained in the extracts was quantified by spectrophotometry (MURPHY; RILEY, 1962). The Po content of each fraction is the result of the difference between the Pt and Pi contents.
The chemical attributes (MO, H+Al, V%, pH), the
granulometric fractions (sand, clay) and the P fractions: total organic and inorganic phosphorus (Pot; Pit - the sum of their respective fractions), organic phosphorus and total labile (Pol; Ptl - sum of the labile fractions), available P and total P (TP), were statistically evaluated by principal component analysis (PCA), with the Pearson
(1)Analyses performed as per methodologies shown in EMBRAPA (1997). (2)TP2, Terra Preta 2; BJ8, Bom Jesus do Tocantins; OP3, Onça Puma 3;
Jab., Jabuti; S.Raim., S.Raimundo;(3)Horiz., Horizon; Source: Costa (2011)
Jab. ABE
A1 4.3 0.11 8.8 0.3 1.2 18.15 52 67.30 779 126 74
AB 5.0 0.06 5.1 1.2 2.2 11.04 61 33.73 859 86.5 34
BA 5.1 0.05 2.3 0.3 1.7 4.34 66 5.97 888 37.5 54
B1 5.3 0.04 2.9 0.7 2.1 5.27 72 3.84 854 51.5 74
Jab. AD
A1 4.1 0.08 0.8 0.9 0.2 9.94 19 62.37 752 113.5 114
AB 3.9 0.04 0.3 0.2 0.3 6.18 9 9.25 851 74.5 54
BA 4.0 0.03 0.3 0.2 0.1 4.18 13 1.82 898 27.5 54
B1 4.0 0.03 0.3 0.2 0.2 4.35 13 2.83 849 56 74
S. Raim. ABE
A1 5.1 0.13 9.7 2.4 0.1 18.30 67 46.94 570 195.5 214
AB 4.6 0.04 2.0 0.4 0.1 5.65 62 8.89 373 92 514
BA 4.5 0.08 1.7 0.6 0.1 3.90 66 4.92 275 110.5 594
B1 4.7 0.03 1.9 0.4 0.1 3.34 70 4.85 280 185.5 514
S.Raim. AD
A1 3.8 0.06 0.4 0.1 2.2 8.55 7 38.94 605 100 274
AB 3.9 0.04 0.4 0.1 2 6.56 9 23.19 469 96.5 414
BA 4.0 0.04 0.4 0.1 1.9 5.37 11 6.24 413 52 514
B1 4.0 0.02 0.3 0.1 1.5 3.11 15 14.00 403 62 514
linear correlation coefficient (r) between them also being calculated. Only 12 variables were selected so as to remove any redundant data, retaining the original information.
The PCA was centred and normalised, and the results obtained by eigenvalue decomposition of the correlation matrix. The principal components 1 and 2 were selected according to the percentage of explained variance, where the accumulated variance of the components should be less than 70% (CARVALHO
et al., 2004). The R software was used in the analysis
(IHAKA; GENTLEMAN, 1996).
RESULTS AND DISCUSSION
The acid extract organic phosphorus content (Po H+)
between the studied orders of soil are described in Table 3. The
highest levels of Po H+ were found in the A1 horizon, at
the Jabuti ABE and Onça Puma 3 ABE sites. Intermediate levels were obtained at the Juruti 2 ABE and S. Raimundo ABE sites and, as with the remaining sites, at levels higher than in the areas of AD.
In the A1 horizon, the Po H+ fraction varied
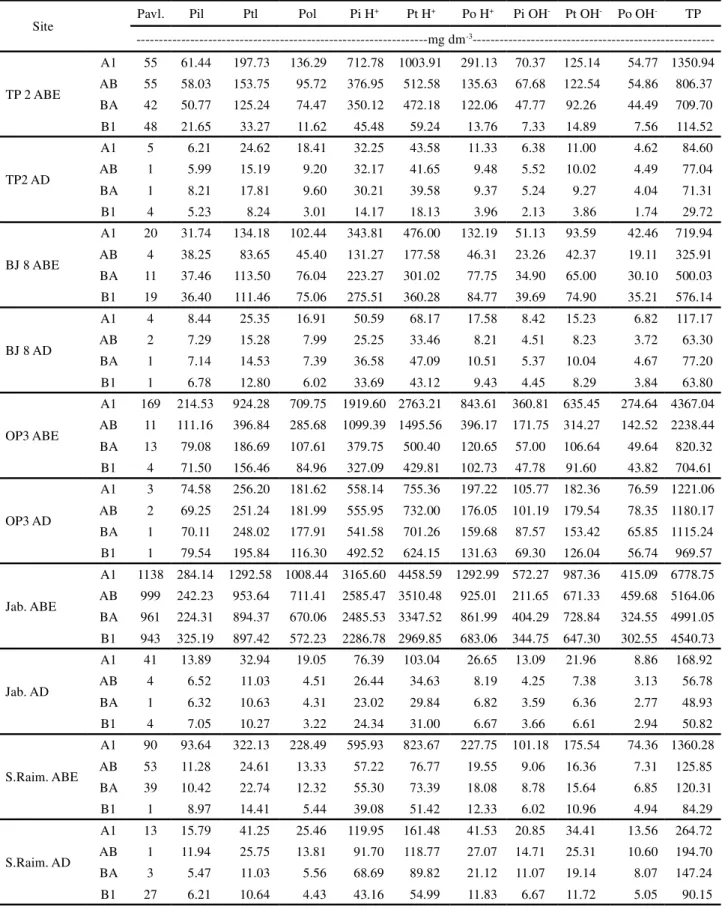
Table 3 - Available phosphorus, forms of phosphorus and total soil phosphorus at ABE and AD sites(1)
Site Pavl. Pil Ptl Pol Pi H
+ Pt H+ Po H+ Pi OH- Pt OH- Po OH- TP
---mg dm-3
---TP 2 ABE
A1 55 61.44 197.73 136.29 712.78 1003.91 291.13 70.37 125.14 54.77 1350.94 AB 55 58.03 153.75 95.72 376.95 512.58 135.63 67.68 122.54 54.86 806.37 BA 42 50.77 125.24 74.47 350.12 472.18 122.06 47.77 92.26 44.49 709.70
B1 48 21.65 33.27 11.62 45.48 59.24 13.76 7.33 14.89 7.56 114.52
TP2 AD
A1 5 6.21 24.62 18.41 32.25 43.58 11.33 6.38 11.00 4.62 84.60
AB 1 5.99 15.19 9.20 32.17 41.65 9.48 5.52 10.02 4.49 77.04
BA 1 8.21 17.81 9.60 30.21 39.58 9.37 5.24 9.27 4.04 71.31
B1 4 5.23 8.24 3.01 14.17 18.13 3.96 2.13 3.86 1.74 29.72
BJ 8 ABE
A1 20 31.74 134.18 102.44 343.81 476.00 132.19 51.13 93.59 42.46 719.94
AB 4 38.25 83.65 45.40 131.27 177.58 46.31 23.26 42.37 19.11 325.91
BA 11 37.46 113.50 76.04 223.27 301.02 77.75 34.90 65.00 30.10 500.03 B1 19 36.40 111.46 75.06 275.51 360.28 84.77 39.69 74.90 35.21 576.14
BJ 8 AD
A1 4 8.44 25.35 16.91 50.59 68.17 17.58 8.42 15.23 6.82 117.17
AB 2 7.29 15.28 7.99 25.25 33.46 8.21 4.51 8.23 3.72 63.30
BA 1 7.14 14.53 7.39 36.58 47.09 10.51 5.37 10.04 4.67 77.20
B1 1 6.78 12.80 6.02 33.69 43.12 9.43 4.45 8.29 3.84 63.80
OP3 ABE
A1 169 214.53 924.28 709.75 1919.60 2763.21 843.61 360.81 635.45 274.64 4367.04 AB 11 111.16 396.84 285.68 1099.39 1495.56 396.17 171.75 314.27 142.52 2238.44 BA 13 79.08 186.69 107.61 379.75 500.40 120.65 57.00 106.64 49.64 820.32 B1 4 71.50 156.46 84.96 327.09 429.81 102.73 47.78 91.60 43.82 704.61
OP3 AD
A1 3 74.58 256.20 181.62 558.14 755.36 197.22 105.77 182.36 76.59 1221.06 AB 2 69.25 251.24 181.99 555.95 732.00 176.05 101.19 179.54 78.35 1180.17 BA 1 70.11 248.02 177.91 541.58 701.26 159.68 87.57 153.42 65.85 1115.24 B1 1 79.54 195.84 116.30 492.52 624.15 131.63 69.30 126.04 56.74 969.57
Jab. ABE
A1 1138 284.14 1292.58 1008.44 3165.60 4458.59 1292.99 572.27 987.36 415.09 6778.75 AB 999 242.23 953.64 711.41 2585.47 3510.48 925.01 211.65 671.33 459.68 5164.06 BA 961 224.31 894.37 670.06 2485.53 3347.52 861.99 404.29 728.84 324.55 4991.05 B1 943 325.19 897.42 572.23 2286.78 2969.85 683.06 344.75 647.30 302.55 4540.73
Jab. AD
A1 41 13.89 32.94 19.05 76.39 103.04 26.65 13.09 21.96 8.86 168.92
AB 4 6.52 11.03 4.51 26.44 34.63 8.19 4.25 7.38 3.13 56.78
BA 1 6.32 10.63 4.31 23.02 29.84 6.82 3.59 6.36 2.77 48.93
B1 4 7.05 10.27 3.22 24.34 31.00 6.67 3.66 6.61 2.94 50.82
S.Raim. ABE
A1 90 93.64 322.13 228.49 595.93 823.67 227.75 101.18 175.54 74.36 1360.28
AB 53 11.28 24.61 13.33 57.22 76.77 19.55 9.06 16.36 7.31 125.85
BA 39 10.42 22.74 12.32 55.30 73.39 18.08 8.78 15.64 6.85 120.31
B1 1 8.97 14.41 5.44 39.08 51.42 12.33 6.02 10.96 4.94 84.29
S.Raim. AD
A1 13 15.79 41.25 25.46 119.95 161.48 41.53 20.85 34.41 13.56 264.72
AB 1 11.94 25.75 13.81 91.70 118.77 27.07 14.71 25.31 10.60 194.70
BA 3 5.47 11.03 5.56 68.69 89.82 21.12 11.07 19.14 8.07 147.24
B1 27 6.21 10.64 4.43 43.16 54.99 11.83 6.67 11.72 5.05 90.15
(1)Pavl., available phosphorus; Pil, labile inorganic phosphorus; Ptl, total labile phosphorus; Pol, labile organic phosphorus; Pi H+, acid extract
inorganic phosphorus; Pt H+, acid extract total phosphorus; Po H+, acid extract organic phosphorus; Po OH-, base extract organic phosphorus;
solubilises the forms bound to P-Ca. These results may be associated with the high levels of biogenic apatite, widely found in the form of animal and fish bones in ABE,
which are rich in P and Ca (FRASERet al.,2011; LIMAet al.,
2002; SATOet al., 2009; SOUZAet al.,2009).
The levels of Po H+ in the ABE also predominated
over the respective areas of AD in the remaining horizons, tending to decrease with increasing depth. In the Onça
Puma 3 area of AD, higher levels of Po H+ were seen from
the BA horizon in the case of an Argisol with the horizon sequence A1 - textural B, tending to greater subsurface
P retention due to the increase in clay content. Souzaet
al. (2009), in an ABE of a clayey to very clayey texture,
found the highest levels of total P (TP) and the highest levels of the main form of P (P-Ca).
There was no correlation between Po H+ and the
clay content of the soils in the A1 horizon (p < 0.05; n = 15, r = 0.05), even though this variability was not more than 10 to 20%, in the textural classes the accumulation in this fraction followed the sequence Sandy Loam (Gleysols) > Sandy Clay Loam (Argisols)> Sandy Loam (Latosols)> Sandy Clay Loam (Argisols) > Sandy Loam (Latosols).
On first examination, the greater Po H+ content
at the Jabuti site may be understood as a consequence of the anoxic condition common in the soils of those areas (Gleysols). In such cases, the water saturation associated with the input of labile organic matter results in the use
of forms of Fe3+ as final electron acceptors. As a result,
dissolution of the Fe oxides (III) takes place and the release of P-associated in the soil solution, which in turn
may create forms of P-Ca (MENDOZAet al., 2012).
The results for Pt H+ expressed the highest
percentage of P in inorganic form, as also seen by Bowman
(1989). This increase in the Po-H+/Pt-H+ ratio in the ABE
plays an important role, since this fraction acts as a P reserve compartment for plants in the short and medium term, in the form of fulvic acids (BOWMAN, COLE,
1978; DUDAet al.,2013; XAVIERet al.,2009).
The higher levels of base extract organic P (Po
OH-) in the areas of Terra Preta were also seen in the
A1 horizon of the sites at Jabuti and Onça Puma 3 ABE (Table 3), with a lower value found at the BJ 8 ABE site, showing a significant reduction for AD. The values for
Po OH- varied between 11.4 and 23.7% of the Pot, being
generally lower than the acid extract fraction, with a reduction of up to 49.0%.
The Po OH- fraction may be associated with humic
acids or undergo sorption at the surface by compounds of Fe and Al, suggesting an increase of these compounds with depth (OLSEN; SOMMER, 1982). These compounds are stable and of difficult availability, corresponding to
a more advanced and polymerised material, the humic acids, hindering the access of microorganisms and plants (NOVAIS; SMYTH, 1999). However, for Busato, Canellas and Velloso (2005), in low fertility soils of the tropical humid region, humic acids make up an important, readily available reserve of organic P.
In the ABE there is a predominance of highly humidified fractions (humin and humic acid - HAF) and lower levels of the fulvic acid fraction (FAF), resulting in
high HAF/FAF ratios (BARROSet al.,2012; CAMPOS
et al., 2011; LIMAet al.,2002). It is possible that in this
study, the humic acids of the soils, in comparison to the fulvic acids, are not enriched with P.
The levels of labile organic P (Pol) were higher in the A1 horizons of the ABE soils found at the Jabuti and Onça Puma 3 sites, with the lowest levels found at the BJ 8 site (Table 3). In general, there was an increase in Pol content in the A1 horizon, with a reduction between the A and B horizons of up to 97.6%, indicating the contribution of organic matter (OM) to this P fraction.
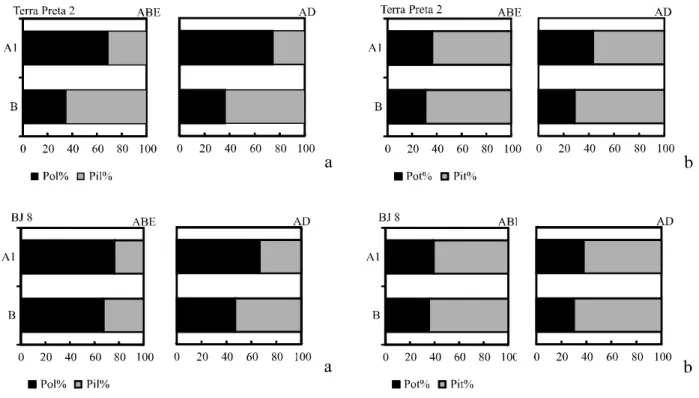
In relation to the total labile P (Ptl), the percentage of Pol varied between 31.4% in the B horizon of the soil under AD at the Jabuti site, and 78.0% in the A1 horizon of the ABE at the same site. There was a predominance of Pol over labile inorganic P (Pil) at all sites and in the areas of ABE and AD, which in most of the horizons was over 50% of the Ptl (Figure 1a). The addition of organic material, including crop residues and other biogenic rural and urban waste, increase P availability in
the soil (BOWMAN; COLE, 1978; DUDAet al.,2013;
GUERRAet al., 1996; PARTELLIet al.,2009 ). In this
study the available P was positively correlated with the Po fractions (r = 0.77).
Malik, Marschner and Khan (2012), comparing the lability of P after the addition of inorganic and organic P to the soil, noted that the latter is less prone to sorption and precipitation due to the lower concentration of water-soluble P and the stimulation of microbial activity through the addition of C. The competition between organic and phosphate anions for the same adsorption sites on the surface of oxides may increase P availability for plants
(XAVIERet al., 2009).
In the adjacent areas, the Argisols displayed the
highest levels of Pol (181.62 and 25.46 mg dm-3). These
results agree with those found by Dudaet al. (2006) and
Guerraet al. (1996), in which the highest levels of Pol were
found in the surface horizon and in the more clayey soils, however in the present study no significant correlation was seen between this P fraction and clay content (r = 0.14).
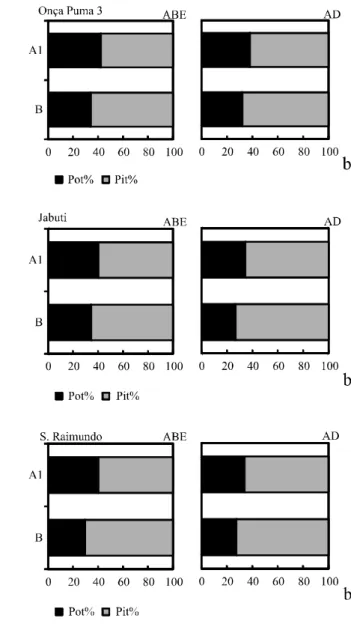
Figure 1a - Distribution of labile organic P (Pol) and labile inorganic P (Pil) relative to the total labile P (Ptl) in the A1 and B horizons of the ABE sites and adjacent areas
sites at Terra Preta 2 ABE and BJ 8 ABE respectively, where the areas had the lowest levels for TP (Table 3), in line with the levels found in tropical Latosols, generally
with a TP of around 200 mg dm-3 (DUDAet al.,2013;
GUERRAet al., 1996).
In the Argisols corresponding to the ABE Onça Puma 3 and S. Rimundo sites, the TP levels were higher than those found in the Latosols, but no significant correlation was found between TP and the clay fraction (r = 0.14). This increase in TP content may be related to the predominant vegetation in these areas; for example, the site at Onça Puma 3, vegetated with Marandu grass (Brachiaria brizantha), which has a high demand for P and
high biomass production that favours incorporation of the element into the plant tissue and increases organic residue
and reserves in the soil (DUDAet al.,2013; MERLIN;
HE; ROSOLEM, 2013). Studies by Nogueiraet al. (2008)
showed no difference between the Pol fraction in an area of native forest and an area of intensive farming, where the spontaneous growth of grass in the latter area may have facilitated the maintenance of OM in the soil.
At the S. Raimundo site, a decrease of 90.8% in
Pol was seen from the A1 horizon (1360.28 mg dm-3)
to the AB horizon (125.85 mg dm-3), probably a result
of the management applied in the cultivation of cassava.
Souzaet al. (2009), evaluating the forms of phosphorus
found in cultivated black earth sites in the Brazilian
Amazon, found TP levels of 1001.1 mg dm-3 in a Latosol
and 2043.0 mg kg-3 in an Argisol at a depth of 0-20 cm.
The highest TP levels were found in the A1 horizon at the Jabuti ABE site, decreasing with increasing depth; there was a positive correlation with the OM in both the ABE and the AD areas (r = 0.9; r = 0.99) respectively, indicating a contribution from different sources of P to the high levels of nutrients quantified in the ABE, such as the biogenic apatite widely found in these soils (COSTA,
2011; GLASER; BIRK, 2012; KERNet al., 2010).
With the percentage distribution of total organic P (Pot) and total inorganic P (Pit), a predominance of Pit was found in all sites and in an area of ABE and AD, accounting on average for 65.3% of the TP, whereas Pot represented on average 34.82% of the TP (Figure 1b), a percentage value higher than that found by Busato, Canellas and
Velloso (2005) of 25%, and by Guerraet al. (1996), where
the average contribution of this fraction was 27% for 17 soil samples.
Figure 1b - Distribution of total organic P (Pot) and of total inorganic P (Pit) relative to the total soil P (TP) in the A1 and B horizons of the ABE sites and adjacent areas
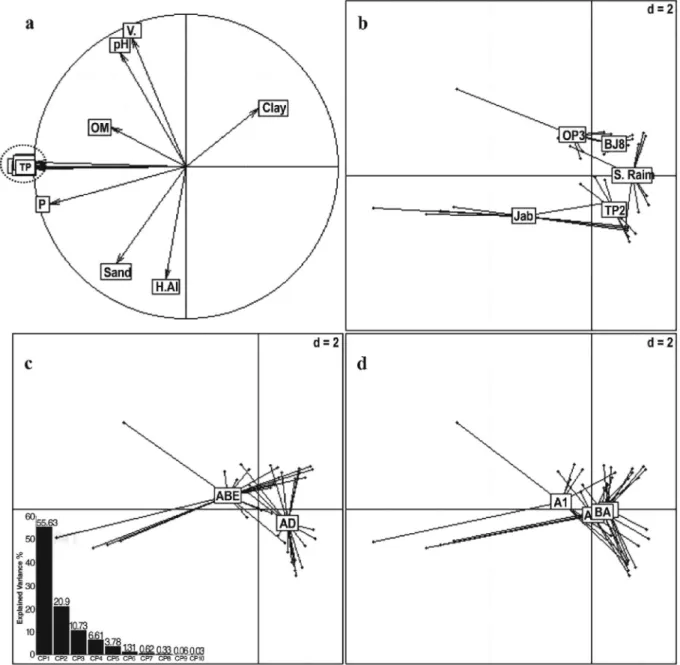
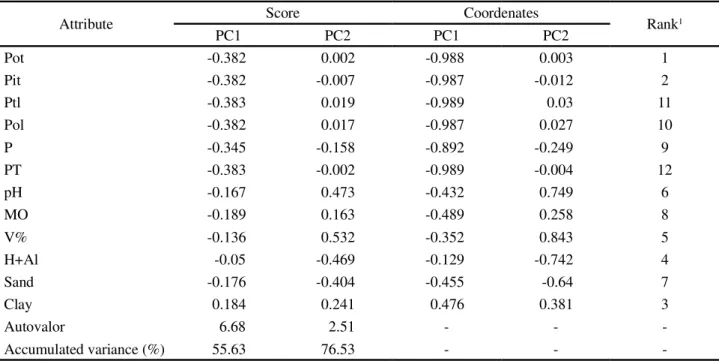
Distribution of the selected variables with a cumulative variation of 76.53% can be seen for the F1 and F2 axes, with the F1 axis explaining 55.63 and the F2 axis 20.9% of this variance (Table 4).
From the graphic dispersion it could be seen that there was a difference between the sites under study in relation to the variables shown in the PCA. The sites at S. Raimundo, Terra Preta 2 and BJ 8, differ from the others mainly in the forms of P, potential acidity (H+Al) and clay content respectively (Figure 2b). These sites had the lowest levels of P in the areas of ABE and AD; at the BJ 8 site, the levels of P correlate positively with the clay content (r = 0.72).
The greatest values for H+Al were found at the Terra Preta 2 site, reaching levels of 2.7 in the ABE B
horizon, and of up to 2.8 mg dm-3 in the BA horizon of
the AD area, showing the persistence of the geochemical characteristics of these soils, rich in Fe and Al oxides, as noted by Costa, Costa and Kern (2013) in studies in the area. The availability of P in weathered soils is partly controlled by the predominance of amorphous clays of Fe and Al of low crystallinity and high specific surface area, which at low pH are positively charged and tend
to adsorb phosphate anions (EBERHARDTet al., 2008;
GICHANGI; MNKENI; BROOKES, 2009;
Figure 2 - Principal Component Analysis (PCA) carried out for soil attributes and forms of P on the ABE sites and adjacent areas for five different locations, in the A1, AB, BA and B horizons. (a) Correlation circle between the soil chemical variables, forms of P and granulometric fractions. (b) Ordination diagram of the samples by site (p = 0.001, observation = 0.35). (c) Ordination diagram of the samples by horizon (p = 0.001, observation = 0.17). (d) Ordination diagram of the samples by area studied (ABE, AD) (p = 0.001, observation = 0.15)
The site at Onça Puma 3 displayed a correlation with CP1 for OM, and a correlation with CP2 for pH and V%, with high levels of OM in the A1 horizon
(64.21 g kg-1) and the greatest values for pH and V%
between sites, of 6.9 and 96% respectively. In the area of AD, high values for these attributes were also seen at
a low pH (5.2). In soils under systems of high biomass production, besides the addition of bases to the soil (Ca, Mg and K) as a result of nutrient cycling, the free Al+ and H+ ions are complexed in the anionic organic compounds, buffering or raising the pH (GICHANGI; MNKENI; BROOKES, 2009).
Attribute Score Coordenates Rank1
PC1 PC2 PC1 PC2
Pot -0.382 0.002 -0.988 0.003 1
Pit -0.382 -0.007 -0.987 -0.012 2
Ptl -0.383 0.019 -0.989 0.03 11
Pol -0.382 0.017 -0.987 0.027 10
P -0.345 -0.158 -0.892 -0.249 9
PT -0.383 -0.002 -0.989 -0.004 12
pH -0.167 0.473 -0.432 0.749 6
MO -0.189 0.163 -0.489 0.258 8
V% -0.136 0.532 -0.352 0.843 5
H+Al -0.05 -0.469 -0.129 -0.742 4
Sand -0.176 -0.404 -0.455 -0.64 7
Clay 0.184 0.241 0.476 0.381 3
Autovalor 6.68 2.51 - -
-Accumulated variance (%) 55.63 76.53 - -
-Table 4 - Correlation of soil-attribute data used in the Principal Component Analysis (PCA) between the first two principal components, and classification of the attribute scores by contribution
1Classification of attributes by contribution to the construction of PC1
All the forms of phosphorus were correlated with PC1, explaining 55.63% of the cumulative variance, the fractions are shown superimposed graphically, all highly represented by proximity to the unit circle, with Pot having the greatest participation in the construction of CP1 (Table 4). The P fractions are shown in relation to the site at Jabuti, which has the highest TP content (6778.75
mg dm-3) in the area of ABE, and high levels of available P
in all the horizons, ranging from 1138 to 943 (A1 and B). It was not possible to see the individual influence of the P fractions by means of the PCA however, due to their being strongly related.
The sand fraction and potential acidity were best explained by CP2 and also related to the site at Jabuti. The potential acidity in this area increased with the
increase in depth, varying from 1.2 to 2.1 cmolc dm-3.
High values were seen for the sand fraction, on average
845 g kg-1 in the ABE. The greatest concentration of
this granulometric fraction is commonly reported in anthropogenic soils associated with the formation of stable organo-mineral material with a size equal to that of sand, where the use of fire and deposition of organic residues may be responsible for this transformation
(BARROSet al., 2012). However, in the present study
there did not appear to have been any changes in soil granulometry at the Jabutí site, since the adjacent areas
show an average content of 837.5 g kg-1.
The A1 horizon and the area of ABE correlated in the main with CP1, relating to the forms of P, the OM, and to a lesser extent the pH and V%, which are better explained by CP2 (Figures 2c and 2d). The A horizon is identified, among other properties, by the dark coloration resulting from the decomposition of organic material and in the form of charcoal left over from such cultural practices as clay ovens and firing ceramics for use in agriculture,
among others (CAMPOS et al., 2011; SMITH, 1980).
This horizon stood out from the others, mainly due to the OM and the high levels of P in the fractions under study.
At the sites at Terra Preta 2 and Jabuti, high levels were also seen for the forms of P and for TP at depth, that may result from wildlife activity (bioturbation)
(ARROYO-KALIN et al., 2010; LIMAet al., 2002) or
the significant transfer of P to deeper horizons through leaching due to the high sand content found in these areas.
Silvaet al. (2012), characterising the BJ 8 site by attribute,
observed an increase from 20 mg dm-3 in the A1 horizon to
50 mg dm-3 in the B2 horizon.
The organic matter content in the ABE was higher at all sites compared to the areas of AD, agreeing
with the levels of 46.50 mg dm-3 found by Silvaet al.
(2012), but less than those found by Campos et al.
(2011) of 75.39 mg dm-3, and Santos et al. (2013) of
In the ABE, the eutrophic characteristic of the soils is often reported, highlighting the contribution of Ca to the high base saturation. In turn, the high levels of P are used as one of the criteria for classifying the anthropogenic horizons that should show over 200 mg
TP dm-3, as seen at all the sites in this study (GLASER;
BIRKet al.,2012; LIMAet al.,2002).
The chemical attributes and the P content of these soils show that the Amerindian peoples were able to make persistent changes in favour of the conservation and improvement of the agricultural potential of the weathered soils of the Amazon, representing a model for sustainability in tropical regions.
CONCLUSIONS
1. Anthropic action increases the TP content of ABE sites in relation to the surrounding area, with a predominance
of the form of acid extract organic phosphorus (Po H+),
giving anthropogenic soils a high level of resilience in the availability of phosphorus for plants;
2. Most of the total labile P (Ptl) accumulates in organic soil fractions and represents an active means of supplying the nutrient to plants.
REFERENCES
ARROYO-KALIN, M. The Amazonian formative: crop domestication and anthropogenic soils. Diversity, v. 2, p. 473-504, 2010.
BARROS, K. M. et al. Fracionamento químico da matéria orgânica e caracterização física de Terra Preta de Índio.Revista de Ciências Agrárias, v. 55, p. 44-51, 2012.
BOWMAN, R. A. A sequential extraction procedure with concentrated sulfuric acid and dilute base for soil organic phosphorus.
Soil Science Society of America Journal, v. 53, p. 362-366, 1989. BOWMAN, R. A.; COLE, C. V. An exploratory method for fractionation of organic phosphorus from grassland soils. Soil Science, v. 125, p. 95-101, 1978.
BUSATO, J. G.; CANELLAS, L. P.; VELLOSO, A. C. X. Fósforo num Cambissolo cultivado com cana-de-açúcar por longo tempo. I: Fracionamento sequencial.Revista Brasileira de Ciência do Solo, v. 29, p. 935-944, 2005.
CAMPOS, M. C. C.et al. Caracterização e classificação de terras pretas arqueológicas na Região do Médio Rio Madeira.
Bragantia, v. 70, p. 598-609, 2011.
CARVALHO, L. G.et al. Modelo de regressão para a previsão de produtividade de cafeeiros no Estado de Minas Gerais.Revista Brasileira de Engenharia Agrícola e Ambiental, v. 8, p. 204-211, 2004.
COSTA, A. R.Formas de fósforo do solo em sítios de Terra Preta Arqueológica na Amazônia Oriental. 2011. 116 f. Dissertação (Mestrado em Agronomia) - Instituto de Ciências Agrárias, Universidade Federal Rural da Amazônia, Belém, 2011.
COSTA, J. A.; COSTA, M. L.; KERN, D. C. Analysis of the spatial distribution of geochemical signatures for the identification of prehistoric settlement patterns in ADE and TMA sites in the lower Amazon Basin. Journal of Archaeological Science, v. 40, p. 2771-2782, 2013. DUDA, G. P.et al. Caracterização de fósforo e carbono orgânico em solos cultivados com diversas culturas em sistema de produção agroecológica.Revista Científica Rural, v. 11, p. 34-32, 2006.
DUDA, G. P. et al. Phosphorus bioavailable evaluation in different soil classes from Brazil.Semina: Ciências Agrárias, v. 34, p. 1563-1576, 2013.
EBERHARDT, D. N.et al. Influência da granulometria e da mineralogia sobre a retenção do fósforo em latossolos sob pastagens no cerrado. Revista Brasileira de Ciência do Solo, v. 32, p. 1009-1016, 2008.
EMPRESA BRASILEIRA DE PESQUISA AGROPECUÁRIA. Centro Nacional de Pesquisa de Solos.Manual de métodos e análise de solo. 2. ed. Rio de Janeiro, 1997. 212 p.
FRASER, J.et al. Anthropogenic soils in the central Amazon: from categories to a continuum. Area, v. 43, p. 264-273, 2011.
GICHANGI, E. M.; MNKENI, P. N. S.; BROOKES, P. C. Changes in inorganic and microbial P fractions over time following inorganic phosphate and goat manure addition to a high P xing soil in a controlled incubation experiment. Soil Science and Plant Nutrition,v. 55, p. 764-771, 2009.
GLASER, B.; BIRK, J. J. State of the scientific knowledge on properties and genesis of Anthropogenic Dark Earths in Central Amazonia (Terra Preta de Índio).Geochimica et Cosmochimica Acta, v. 82, p. 39-51, 2012.
GUERRA, J. G. M.et al. Teor de fósforo orgânico em amostras de solos.Pesquisa Agropecuária Brasileira, v. 31, p. 291-299, 1996. HOLLIDAY, V. T.; GARTNER, W. G. Methods of soil P analysis in archaeology.Journal of Archaeological Science, v. 34, p. 301-333, 2007.
IHAKA, R., GENTLEMAN, R. R: a language for data analysis and graphics.Journal Computational and Graphical Statistics, v. 5, p. 299-314, 1996.
KERN, D. C.et al. Evolução do conhecimento em Terra Preta de Índio.In: TEIXEIRA, W. C.et al. (Org.).As Terras Pretas de
Índio da Amazônia:sua caracterização e uso deste conhecimento na criação de novas áreas. 1. ed. Manaus: Embrapa Amazônia Ocidental, 2010. v. 1, p. 72-81.
MALIK, M. A.; MARSCHNER, P.; KHAN, K. S. Addition of organic and inorganic P sources to soil: effects on P pools and microorganisms.Soil Biology & Biochemistry, v. 49, p. 106-113, 2012.
MENDOZA, U. N. et al. Flooding effects on phosphorus dynamics in an Amazonian mangrove forest, Northern Brazil.
Plant & Soil, v. 353, p. 107-121, 2012.
MERLIN, A.; HE, Z. L.; ROSOLEM, C. A. Ruzigrass affecting soil-phosphorus availability. Pesquisa Agropecuária Brasileira, v. 48, p. 1583-1588, 2013.
MURPHY, J.; RILEY, J. P. A modified single solution method for the determination of phosphate in natural waters.Analytica Chimica Acta, v. 27, p. 31-36, 1962.
NOGUEIRA, R. S. et al. Formas de fósforo em Luvissolo Crómico Órtico sob sistemas agroflorestais no município de Sobral-CE. Revista Ciência Agronômica, v. 39, p. 494-502, 2008.
NOVAIS, R. F.; SMYTH, T. J.Fósforo em solo e planta em condições tropicais. Viçosa, MG: UFV, 1999. 399 p. OLSEN, S. R.; SOMMERS, L. E. Phosphorus.In: MILLER, R. H.; KENNEY, D. R. (Ed.).Methods of soil analysis. Madison: American Society of Agronomy, 1982. p. 403-430.
PARTELLI, F. L. et al. Qualidade da matéria orgânica e distribuição do fósforo no solo de lavouras orgânicas de café Conilon. Pesquisa Agropecuária Brasileira, v. 44, p. 1404-1415, 2009.
SÁNCHEZ-ALCALÁ, I. et al. The Olsen P/solution P relationship as affected by soil properties. Soil Use and Management, v. 30, p. 297-302, 2014.
SANTOS, L. A. C. dos et al. Caracterização de terras pretas arqueológicas no sul do estado do Amazonas.Revista Brasileira de Ciência do Solo, v. 37, p. 825-836, 2013.
SANTOS, R. D.et al. Manual de descrição e coleta de solo no
campo.5. ed. Viçosa, MG: Sociedade Brasileira de Ciência do Solo: Embrapa: CNPS, 2005. 100 p.
SATO, S. et al. Biogenic calcium phosphate transformation in soils over millennial time scales. Journal of Soils and Sediments, v. 9, p. 194-205, 2009.
SILVA, A. K. T. daet al. Mineralogia e geoquímica de perfil de solo com Terra Preta Arqueológica de Bom Jesus do Tocantins, sudeste da Amazônia. Acta Amazônica, v. 42, p. 477- 490, 2012.
SMITH, N. J. H. Anthrosols and human carrying capacity in Amazonia. Annals of the Association of American Geographers, v. 70, p. 553-566, 1980.
SOUZA, K. W. et al. Phosphorous forms in cultivated Indian Black Earth (Anthrosols) of varying texture in the Brazilian Amazon. Revista Brasileira de Ciência do Solo, v. 33, p. 1347-1355, 2009.
XAVIER, F. A. S. et al. Phosphorus fractionation in a sandy soil under organic agriculture in Northeastern Brazil.