Revista Brasileira de
Engenharia Agrícola e Ambiental
Campina Grande, PB, UAEA/UFCG – http://www.agriambi.com.br
v.21, n.11, p.780-784, 2017
Erosive rainfall in the Rio do Peixe Valley in Santa Catarina, Brazil:
Part II - Characteristics and temporal distribution pattern
Álvaro J. Back
1, Augusto C. Pola
1, Nilzo I. Ladwig
2& Hugo Schwalm
3DOI: http://dx.doi.org/10.1590/1807-1929/agriambi.v21n11p780-784
A B S T R A C T
Exploring the characteristics of erosive rain is an important aspect of studying erosive processes, and it allows researchers to create more natural and realistic hydrological simulations. The objective of this study was to analyse the characteristics of erosive rain and to determine the temporal distribution pattern of erosive rainfall in the Valley of Rio do Peixe in the state of Santa Catarina, Brazil. Daily pluviograms from the meteorological stations located in the cities Campos Novos, Videira, and Caçador in Santa Catarina from 1984 to 2014 were utilized for this study. By studying rainfall that is classified as erosive, the values of kinetic energy, maximum intensity in thirty minutes, and the value of EI30 erosivity index were determined. The rainfall was also classified according to the temporal distribution of rainfall in advanced, intermediate, and delayed patterns. Erosive rainfalls occur at a frequency of 53.3% advanced, 31.1% intermediate, and 15.6% delayed patterns. Erosive rainfall has an average precipitation amount of 25.5 mm, duration of 11.1 h, kinetic energy of 5.6 MJ ha-1, maximum intensity of 30 min of 17.7 mm h-1, and erosivity of 206.4
MJ mm ha-1 h-1. The highest frequency of erosive rainfall occurred in rainfalls lasting from
6 to 12 h (36.1%), followed by rainfalls lasting from 4 to 6 h (22.4%).
Chuvas erosivas do Vale do Rio do Peixe:
Parte II - Características e padrão de distribuição temporal
R E S U M O
As informações sobre as características das chuvas erosivas são importantes para estudar os processos erosivos e permitir as simulações hidrológicas com chuvas mais semelhantes às reais. Este trabalho teve como objetivos analisar as características das chuvas erosivas e determinar o padrão de distribuição temporal das chuvas erosivas da região do Vale do Rio do Peixe, em Santa Catarina. Foram utilizados os pluviogramas diários das estações meteorológicas de Campos Novos, Videira e Caçador do período de 1984 a 2014. Das chuvas classificadas como erosivas foram determinados os valores de energia cinética, intensidade máxima em trinta minutos e o valor do índice de erosividade EI30. Foram ainda classificadas de acordo com a distribuição temporal em chuvas do padrão avançado, intermediário e atrasado. As chuvas erosivas ocorrem com frequência de 53,3% do tipo avançado, 31,1% do tipo intermediário e 15,6% do tipo atrasado. As chuvas erosivas têm em média altura pluviométrica de 25,5 mm, duração de 11,1 h, energia cinética de 5,6 MJ ha-1, intensidade máxima de 30 min de
17,7 mm h-1 e erosividade de 206,4 MJ mm ha-1 h-1. A maior frequência (36,1%) de chuvas
erosivas ocorre na duração de 6 a 12 h, seguido pelas chuvas com duração de 4 a 6 h (22,4%). Key words:
soil conservation water erosion precipitation
Palavras-chave: conservação do solo erosão hídrica precipitação
1 Empresa de Pesquisa Agropecuária e Extensão Rural de Santa Catarina/Estação Experimental de Urussanga. Urussanga, SC. E-mail: [email protected]
(Corresponding author); [email protected]
2 Universidade do Extremo Sul Catarinense/Programa de Pós-Graduação em Ciências Ambientais. Criciúma, SC. E-mail: [email protected] 3 Universidade do Extremo Sul Catarinense/Departamento de Engenharia de Agrimensura. Criciúma, SC. E-mail: [email protected]
Introduction
In the prior study on rainfall erosivity, "Erosive Rainfall in Rio do Peixe Valley in Santa Catarina, Brazil: Part I - Determination of the Erosivity Index", the goal was to determine the erosivity factor. However, it is equally significant to study the rainfall distribution along its duration causing erosivity; this study on the rainfall distribution pattern was carried out with the objective of characterizing the most frequent rainfall pattern. According to Eltz et al. (2001), most of the studies with simulated rainfall use a single pattern of rainfall, i.e., the constant pattern. This is not an accurate simulation for tropical regions where soil losses are correlated more to high intensity rainfall with a short duration. According to Evangelista et al. (2005), the information on the precipitation patterns of rainfalls allows researchers to perform more accurate studies with simulated rainfall by creating conditions that are closer to natural rainfall.
Several authors highlight the effects of the rainfall temporal distribution on soil losses (Mehl et al., 2001; Bemfica et al., 2000; Silva et al., 2013; Eltz et al., 2013). However, most of the studies on the hydrological patterns of erosive rainfall is limited to a description of the most frequent type of rainfall, without analyzing other characteristics of rain. In Santa Catarina, there are few studies on erosion, and in most of these studies, the rainfall erosivity is determined by the EI30 index, as verified in Bertol (1993) and Schick et al. (2014) on Lages, Bertol (1994) on Caçador, and Valvassori & Back (2014) on Urussanga. The relationship between the characteristics of the erosive rainfall and the hydrological patterns was only analyzed and described in the study on Urussanga (Valvassori & Back, 2014).
The objective of this study was to characterize the erosive rainfall based on the temporal distribution pattern in the Valley of Rio do Peixe in the state of Santa Catarina, Brazil.
Material and Methods
The Valley of Rio do Peixe is located in the midwest region of the state of Santa Catarina, Brazil. The watershed, with an area of 5,238 km², is composed of 26 cities; the most important are: Caçador, Videira, Joaçaba, Ouro, Capinzal, Treze Tilias, Água Doce, Fraiburgo, Campos Novos, and Piratuba (Figure 1). The regional economy is based on agriculture and agribusiness. The predominant relief is corrugated and the usable main soils are limited due to erosion. The climate of the region is classified, according to the classification of Köppen, as a humid, subtropical climate, without a dry season and with a mild summer (Cfb) (Alvares et al., 2014).
Daily pluviographic data from three meteorological stations of the Company of Agricultural Research and Rural Extension of Santa Catarina (EPAGRI), located in the Valley of Rio do Peixe in the state of Santa Catarina, Brazil, were used for this study. The data series from January, 1984 to December, 2014 were used for the Campos Novos and Caçador stations, and, for the Videira station, the data series from April, 1985 to April, 2015 were utilized.
The pluviograms were digitized and a computer program was developed to read the digitized data; the program performed the identification and individualization of the erosive rainfall, and calculated the EI30 erosivity index of each erosive rainfall, as described in Valvassori & Back (2014).
In order to analyze the temporal distribution pattern of erosive rainfall, erosive rain was classified according to advanced, intermediate, and delayed patterns (Evangelista et al., 2005). An advanced pattern is when the highest intensity of rainfall occurs in the first third of the total rainfall duration time; an intermediate pattern is when the highest intensity is verified in the middle third of the total duration; and delayed pattern when the highest intensity occurs in the final third of the total rainfall duration time.
Results and Discussion
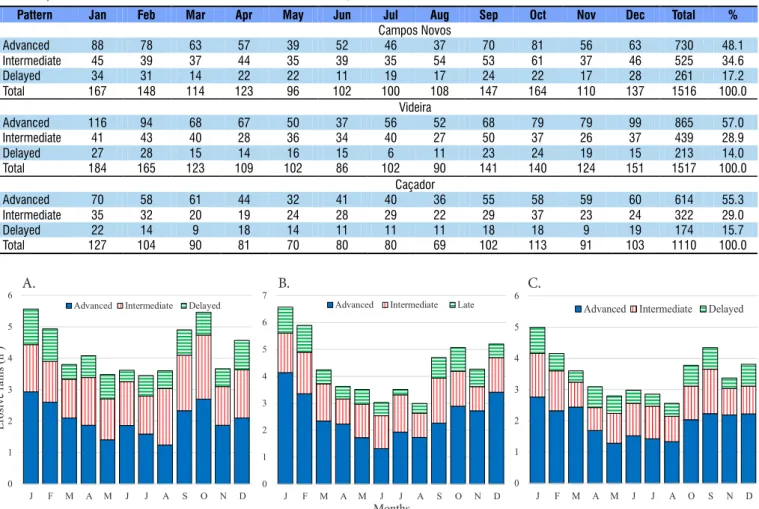
In the analyzed period, 1,516 erosive rainfalls were recorded in Campos Novos (Table 1), out of which 48.1, 34.6 and 17.2% were classified as advanced, intermediate, and delayed patterns, respectively. In the Videira and Caçador stations, 1,517 and 1,100 erosive rainfalls were registered, respectively; a similar distribution was obtained with most rainfalls classified as having an advanced pattern (57.0 and 55.3%, respectively) and less rainfalls with a delayed pattern (14.0 and 15.7%, respectively).
Erosive rainfalls follow the distribution pattern of total precipitation, with the highest erosive rainfall frequency from January to February and from September to October. The lowest distribution is from May to August. That bimodal distribution is explained by the behavior of air masses responsible for causing precipitation in the western region of the states of Santa Catarina and Paraná, as described in Cavalcanti et al. (2009).
In the three stations, 4,143 erosive rainfalls were evaluated, with 53.3% classified as advanced, 31.1% intermediate, and 15.6% delayed. The results obtained are similar to the majority of the studies carried out in Brazil reporting erosive rainfall patterns (Eltz et al., 2013; Silva et al., 2013; Carvalho et al., 2005; Santos & Montenegro, 2012; Valvassori & Back, 2014).
In Campos Novos (Figure 2A), the highest monthly average occurrence of erosive rainfall (5.5) is in January and October, and the lowest from May to August, with 3.5 monthly erosive rainfalls. Throughout the year, rainfalls with an advanced pattern is the most frequent, followed by the intermediate and
Table 1. Number of monthly erosive rainfalls according to the temporal distribution pattern from the rain gauge stations in Valley of Rio do Peixe in the state of Santa Catarina, Brazil
Pattern Jan Feb Mar Apr May Jun Jul Aug Sep Oct Nov Dec Total %
Campos Novos
Advanced 88 78 63 57 39 52 46 37 70 81 56 63 730 48.1
Intermediate 45 39 37 44 35 39 35 54 53 61 37 46 525 34.6
Delayed 34 31 14 22 22 11 19 17 24 22 17 28 261 17.2
Total 167 148 114 123 96 102 100 108 147 164 110 137 1516 100.0
Videira
Advanced 116 94 68 67 50 37 56 52 68 79 79 99 865 57.0
Intermediate 41 43 40 28 36 34 40 27 50 37 26 37 439 28.9
Delayed 27 28 15 14 16 15 6 11 23 24 19 15 213 14.0
Total 184 165 123 109 102 86 102 90 141 140 124 151 1517 100.0
Caçador
Advanced 70 58 61 44 32 41 40 36 55 58 59 60 614 55.3
Intermediate 35 32 20 19 24 28 29 22 29 37 23 24 322 29.0
Delayed 22 14 9 18 14 11 11 11 18 18 9 19 174 15.7
Total 127 104 90 81 70 80 80 69 102 113 91 103 1110 100.0
0 1 2 3 4 5 6
J F M A M J J A S O N D
Advanced Intermediate Delayed
0 1 2 3 4 5 6 7
J F M A M J J A S O N D
Advanced Intermediate Late
0 1 2 3 4 5 6
J F M A M J J A O S N D
Advanced Intermediate Delayed
Erosive rains (nº)
Months
A. B. C.
delayed patterns. In Videira (Figure 2B), a seasonal variation was observed with the highest values from December to February and the lowest values from April to August, when less than four monthly erosive rainfalls occur on average. In Caçador (Figure 2C), the lowest values of erosive rainfall were registered, but with seasonal variation similar to that observed in Campos Novos.
The mean annual average rainfall precipitation values of the erosive rainfall was 27.3, 30.5 and 28.6 mm for the advanced, intermediate, and delayed patterns, respectively (Table 2). In general, the average seasonal variation is higher than 30 mm from April to October, whereas from December to March, the averages were less than 25 mm.
The average rainfall duration is 10.1, 12.5, and 11.8 h for the advanced, intermediate, and delayed patterns, respectively. In Urussanga, Valvassori & Back (2014) found rainfall with an average duration of 13.0, 16.0. and 15.2 h for the advanced, intermediate, and delayed patterns, respectively; these values were higher than those obtained in this study.
Regarding the seasonal variation, it is observed that, on average, erosive rainfall from April to October last between 10.0 and 14.2 h, and from December to March, the duration ranged from 8.2 to 9.0 h. Those seasonal differences are explained by the the precipitation mechanisms acting in Santa Catarina. In this state, rainy events are associated with the passage of frontal systems throughout the year. The frontal rains are characterized by their long duration and medium intensity. In the summer,
Figure 2. Number of erosive rainfalls according to the temporal distribution pattern of Campos Novos (A), Videira (B), and Caçador (C) in the state of Santa Catarina, Brazil
convective rains are more frequent and are characterized by their short duration and high intensity (Vianello & Alves, 2002).
The kinetic energy was similar among the rainfall patterns, and in winter months, the intermediate and delayed pattern rainfalls had slightly higher values of kinetic energy. The average kinetic energy for the advanced, intermediate, and delayed patterns were 5.5, 5.9 and 5.6 MJ ha-1, respectively, with
total average annual kinetic energy of 5.6 MJ ha-1. Valvassori
& Back (2014) found that the average erosive rainfall’s kinetic energy was 5.5 MJ ha-1 in Urussanga. The average intensity
of the erosive rainfall was 19.0, 16.0, and 16.4 mm h-1 for the
advanced, intermediate, and delayed patterns, respectively. There was a significant seasonal variation in the average value of I30, with values above 20 mm h-1 from January to March,
and below 15 mm h-1 from May to August.
The advanced pattern rainfall had an average erosivity of 228.2 MJ mm ha-1 h-1, while the rainfall of the intermediate
pattern had an average of 153.1 MJ mm ha-1 h-1. The delayed
pattern had an average of 236.6 MJ mm ha-1 h-1. This is higher
than the values observed in Urussanga, which is located in southern Santa Catarina, where the average erosivity was 159.1 MJ mm ha-1 h-1; the intermediate and delayed patterns
were 107.3 and 85.8 MJ mm ha-1 h-1, respectively (Valvassori
& Back, 2014). From May to August, the average erosivity was higher than 250 MJ mm ha-1 h-1; however, the lowest EI30 value
Table 2. Erosive rainfall data according to the temporal distribution pattern of the Valley of Rio do Peixe in the state of Santa Catarina, Brazil
Pattern Period
Jan Feb Mar Apr May Jun Jul Aug Sep Oct. Nov Dec Year
Average precipitation (mm)
Advanced 24.4 23.3 23.8 28.4 33.7 28.4 30.0 27.9 31.5 31.3 26.2 23.9 27.3
Intermediate 25.4 26.2 25.7 34.0 34.8 32.3 30.5 31.7 35.8 35.5 26.7 26.2 30.5
Delayed 26.3 25.7 19.5 33.7 33.0 37.3 35.0 29.9 32.3 26.7 24.8 23.4 28.6
Total 25.0 24.5 23.9 30.9 34.0 31.1 30.8 29.7 33.1 32.0 26.2 24.5 28.5
Duration (h)
Advanced 8.2 8.1 7.6 9.2 13.0 12.8 13.8 12.4 12.1 11.3 9.6 7.6 10.1
Intermediate 9.4 10.1 9.6 12.1 14.9 14.0 14.4 14.8 16.2 13.7 9.5 10.4 12.5
Delayed 9.7 9.9 8.5 13.1 13.3 15.3 15.0 14.0 14.7 10.9 10.9 10.2 11.8
Total 8.8 9.0 8.3 10.7 13.7 13.6 14.2 13.5 13.9 12.0 9.7 8.8 11.1
Kinetic energy (MJ ha-1)
Advanced 5.3 5.0 5.1 5.9 6.7 5.4 5.6 5.4 6.1 6.2 5.3 5.1 5.5
Intermediate 5.2 5.3 5.2 6.8 6.5 5.9 5.5 5.8 6.7 6.9 5.3 5.2 5.9
Delayed 5.4 5.4 3.9 6.7 6.2 7.0 6.7 5.5 6.1 5.1 4.8 4.5 5.6
Total 5.3 5.2 5.0 6.3 6.5 5.8 5.7 5.5 6.3 6.3 5.2 5.1 5.6
I30 (mm h-1)
Advanced 23.3 22.2 20.9 20.3 16.7 14.1 14.2 14.3 16.4 17.3 18.3 21.8 19.0
Intermediate 19.0 19.9 20.2 19.3 12.6 12.0 11.7 11.7 14.1 16.1 16.7 18.7 16.0
Delayed 20.0 21.6 17.3 17.2 13.2 14.1 14.4 14.5 13.6 14.8 17.1 15.0 16.4
Total 21.7 21.5 20.3 19.5 14.6 13.3 13.3 13.3 15.2 16.5 17.7 19.9 17.7
EI30 (MJ mm ha-1h-1)
Advanced 153.6 183.0 219.2 250.5 347.8 323.7 296.4 336.7 218.1 193.0 216.9 189.6 228.6
Intermediate 135.6 144.0 169.2 180.3 172.7 162.5 157.8 159.3 124.3 121.6 190.8 153.4 153.1
Delayed 154.0 175.1 336.3 236.6 245.7 345.4 355.0 327.7 196.6 199.7 284.0 206.1 236.6
Total 149.1 170.9 218.0 227.7 265.9 265.9 252.7 266.9 182.8 170.9 219.3 182.3 206.4
Figure 3. Erosive rainfall data according to the pattern and duration of Campos Novos (A), Videira (B), and Caçador (C) in the state of Santa Catarina, Brazil
0 100 200 300 400 500 600 700 800 900
< 2 2-6 6-12 12-18 18-24 24-48 >48 Advanced
Intermediate
Delayed
0 5 10 15 20 25 30
< 2 2-6 6-12 12-18 18-24 24-48 >48 Advanced
Intermediate
Delayed
0 50 100 150 200 250 300 350 400 450 500
< 2 2-6 6-12 12-18 18-24 24-48 >48 Advanced
Intermediate
Delayed
Erosive rains (nº)
A
verage I30 (mm h
-1)
A
verage EI30 (MJ ha mm
-1 h -1)
Duration (h)
A. B. C.
Figure 3A shows the number of erosive rains according to the duration and the time distribution pattern. Advanced rainfall occurred the most frequently in rainfalls lasting up to 18 h. The highest frequency of erosive rainfall occurred in rainfalls lasting from 6 to 12 h (36.1%), followed by rainfalls lasting from 4 to 6 h (22.4%), 12 to 18 h (20.2%), and 18 to 24 h (8.8%). Rainfall lasting less than 2 h or lasting from 24 to 48 h happens with a frequency of 6.0%, while rainfall lasting more than 48 h occurred with a frequency of 0.5%.
Regarding the average intensity of the rainfall, it is observed that rainfall lasting less than 2 h had an average intensity of around 25 mm h-1 (Figure 3B), and for durations of more than
4 hours, there was no marked variation in the average intensity, which assumes values around 15 mm h-1. Rainfall erosivity
lasting up to 18 h varies between 110 and 125 MJ mm ha-1 h-1;
and 170 MJ mm ha-1 h-1 for durations between 18 and 24 h;
210 MJ mm ha-1 h-1 for durations between 24 and 48 h; and
410 MJ mm ha-1 h-1 for durations over 48 h (Figure 3C).
Figure 4 shows the frequency of maximum intensities in 30 min. of erosive rainfall according to the temporal distribution pattern. The advanced pattern rains had a higher occurrence than those of the intermediate and delayed patterns, especially in rains with frequency between 10 and 70%. With this data, the I30 can be estimated. Rainfall with a 20% frequency, or probability of exceeding 20% of the cases (P [X > x] = 0.20) can be observed in Figure 4.
In Campos Novos (Figure 4A), the I30 values were 27.6 mm h-1
for the advanced pattern and 22.8 mm h-1 for the intermediate
and delayed patterns. In Videira (Figure 4B), the I30 values had a 20% frequency, or probability exceeding in 20% of the cases (P [X > x] = 0.20). They were respectively 26.2, 22.4, and 24.2 mm h-1 for the advanced, intermediate, and delayed
patterns. In Caçador (Figure 4C), the values were 24.8, 21.6, and 24.2 mm h-1 for the advanced, intermediate, and delayed
patterns, respectively. Mehl et al. (2001) points out that
due to the diversity of rainfall patterns and their frequency, modification to erosion control and hydraulic structures in the different climatic regions of Brazil is recommended.
Conclusions
1. Erosive rains in the Valley of Rio do Peixe in Santa Catarina have a frequency of 53.3% advanced pattern, 31.1% intermediate pattern, and 15.6% delayed pattern.
2. In summer, there is a higher frequency of erosive rainfall with a higher intensity than the rainfall that occurred in the winter months. However, they have lower precipitation, shorter duration, and less erosivity than the erosive rainfall that occurred in the winter.
3. Erosive rainfalls have an average precipitation of 25.5 mm with a duration of 11.1 h, kinetic energy of 5.6 MJ ha-1, maximum
intensity of 30 min with 17.7 mm h-1 and an erosivity of
206.4 MJ mm ha-1 h-1.
4. The highest frequency of erosive rainfall occurrs in rainfalls lasting from 6 to 12 h (36.1%), followed by rainfalls lasting from 4 to 6 h (22.4%). The advanced pattern rains have a higher occurrence of I30 than those of the intermediate and delayed patterns, especially in rains with frequency between 10 and 70%.
Acknowledgments
The authors thank the Brazilian National Council for Scientific and Technological Development (CNPq) for the financial support to this research.
Literature Cited
Alvares, C. A.; Stape, J. L.; Sentelhas, P. C.; Gonçalves, J. L. de M.; Sparovek, G. Köppen's climate classification map for Brazil.
Meteorologische Zeitschrift, v.22, p.711-728, 2014. https://doi.
org/10.1127/0941-2948/2013/0507
Bertol, I. Índice de erosividade (EI30) para Lages (SC) - 1a aproximação.
Pesquisa Agropecuária Brasileira, v.28, p.515-521, 1993.
Bertol, I. Avaliação da erosividade da chuva na localidade de Campos Novos (SC) no período de 1981-1990. Pesquisa Agropecuária Brasileira, v.29, p.1453-1458, 1994.
Figure 4. Frequency of I30 values in Campos Novos (A), Videira (B), and Caçador (C) in the state of Santa Catarina, Brazil
I30 (mm h
-1)
Frequency
A. B. C.
Bemfica, D. da C.; Goldenfum, J. A.; Silveira, A. L. L. da. Análise da aplicabilidade de padrões de chuva de projeto a Porto Alegre. Revista Brasileira de Recursos Hídricos, v.5, p.5-16, 2000. https:// doi.org/10.21168/rbrh.v5n4.p5-16
Carvalho, D. F. de; Montebeller, C. A.; Franco, E. M.; Valcarcel, R.; Bertol, I. Padrões de precipitação e índices de erosividade para as chuvas de Seropédica e Nova Friburgo, RJ. Revista Brasileira de Engenharia Agrícola e Ambiental, v.9, p.7-14, 2005. https:// doi.org/10.1590/S1415-43662005000100002
Cavalcanti, I. F. A.; Ferreira, N. J.; Silva, M. G. A. J.; Dias, M. A. F. S. Tempo e clima no Brasil. São Paulo: Oficina de Textos, 2009. 463p. Eltz, F. L. F.; Cassol, E. A.; Pascotini, P. B.; Amorim, R. S. S. Potencial
erosivo e características das chuvas de São Gabriel, RS, de 1963 a 1993. Revista Brasileira de Engenharia Agrícola e Ambiental, v.17, p.647-654, 2013. https://doi.org/10.1590/S1415-43662013000600011 Eltz, F. L. F.; Mehl, H. U.; Reichert, J. M. Perdas de solo e água em
entressulcos em um Argissolo Vermelho-Amarelo submetido a quatro padrões de chuvas. Revista Brasileira de Ciência do Solo, v.25, p.485-493, 2001. https://doi.org/10.1590/S0100-06832001000200024 Evangelista, A. W. P.; Carvalho, L. G.; Bernardino, D. T. Caracterização do padrão das chuvas ocorrentes em Lavras, MG. Irriga, v.10, p.306-317, 2005.
Mehl, H. U.; Eltz, F. L. F.; Reichert, J. M.; Didoné, I. A. Caracterização de padrões de chuvas ocorrentes em Santa Maria (RS). Revista Brasileira de Ciência do Solo, v.25, p.475-483, 2001. https://doi. org/10.1590/S0100-06832001000200023
Santos, T. E. M. dos; Montenegro, A. A. A. Erosividade e padrões hidrológicos de precipitação no Agreste Central pernambucano. Revista Brasileira de Engenharia Agrícola e Ambiental, v.16, p.871-880, 2012. https://doi.org/10.1590/S1415-43662012000800009 Schick, J.; Bertol, I.; Cogo, N. P.; González, A. P. Erosividade de
chuvas em Lages, Santa Catarina. Revista Brasileira de Ciência do Solo, v.38, p.1890-1905, 2014. https://doi.org/10.1590/S0100-06832014000600024
Silva, T. V.; Machado, R. L.; Marques, D. R.; Ferreira, E. A. Determinação do potencial erosivo e dos padrões de chuva de Rio Verde GO. In: Simpósio de Pesquisa e Extensão de Ceres e Vale de São Patrício, Ceres, Goiás. 2013.
Valvassori, M. L.; Back, A. J. Avaliação do potencial erosivo das chuvas em Urussanga, SC, no período de 1980 a 2012. Revista Brasileira de Ciência do Solo, v.38, p.1011-1019, 2014. https:// doi.org/10.1590/S0100-06832014000300033