and Tallow on the Productive Performance and Egg
Quality of Laying Hens in the Late-phase Production
Author(s)
Nassiri Moghaddam H Kazemi Fard# M
Agah MJ Hosseini SJ Mirakzehi MT
Excellence Center for Animal Sciences Research and Department of Animal Science, Faculty of Agriculture, Ferdowsi University of Mashhad, PO Box 91775-1163, Mashhad, Iran
Mail Adress
* Corresponding author:
E-mail: [email protected]
Keywords
Eggshell, egg weight, fat, specific gravity, sulfur amino acids.
Submitted: August/2011 Approved: September/2012
ABSTRACT
An experiment was conducted to determine the effects of different levels of methionine, protein and tallow on productive performance and egg quality of laying hens in the late phase of production. A completely randomized design with a 3×2×2 factorial arrangement, with three levels (0.34, 0.31, and 0.27%) of methionine (MET), two levels (12.8 and 14.7%) of protein (PRO) and two levels (1 and 3%) of tallow (TAL) with constant level of linoleic acid (1.55 ± 0.02%), was used. A number of 144 Hi-Line W-36 layers from 70 to 76 wk of age was randomly distributed into 12 treatment groups with 4 replicates of 3 hens each. Egg production and egg weight were daily recorded and feed intake and egg quality traits were recorded every 2 wk. There was a significant interaction between PRO levels and TAL for egg weight. Low levels of TAL and PRO decreased egg weight throughout the experiment. High levels of MET and TAL with concomitant reduced PRO, increased eggshell thickness, and a significant interaction between levels of MET, PRO and TAL was observed during the experiment (70 to 76 wk). Low level of protein (12.8%) significantly decreased albumen weight in the third 2-wk period. Yolk color increased when hens were fed low levels of PRO and TAL. Results of this experiment indicated that the simultaneous reduction of dietary PRO and MET in diets of Hi-Line W-36 laying hens in the late phase of production, reduced egg weight (P<0.05). Productive performance and egg quality were not affected by 12 and 20% reduction of PRO and MET, respectively. It seems that decreasing the levels of MET and PRO to lower than the recommended values can decrease egg weight without negative effects on productive performance and egg quality of laying hens in the late phase of production.
INTRODUCTION
In spite of preferences for large eggs by consumers, a very large increase in egg size in old hens might not be of benefit because the incidence of shell quality problems and the proportion of broken eggs increase (Bennett, 1992; Abdallah et al., 1995). As hens grow older, the nutrient requirements decrease. It is important for commercial laying breeders to know the nutritional requirements of laying hens at different ages (Wu et al., 2005b). Methionine is the first limiting amino acid for egg weight (Al-Saffar & Rose, 2002).
egg size should also prevent loss of shell thickness (Keshavarz, 2003). Increase in egg size has resulted in reduced of eggshell thickness and eggshell weight (as a percentage of egg weight) (Roland, 1988; Jackson et al., 1987). Thus, researchers have been interested in reducing egg size during the late stages of the egg production cycle by dietary manipulation of nutrients for increasing eggshell quality.
MET (Sohail et al., 2002), linoleic acid (LIN) (Harms & Russell, 2004), and fat (Grobas et al., 1999b,c) are three factors that affect egg size. Also, Keshavarz (2003) observed that, by reducing dietary level of protein (PRO) to 13% and omitting supplemental MET from the diet, egg production, egg weight, egg mass, feed consumption, body weight gain, and extra-large plus extra-large-sized eggs were reduced and feed conversion and the number of small plus tiny sized eggs increased. Accordingly, a reduction in the levels of these factors in the diet may decrease egg size and increase eggshell quality. Keshavarz (2003) pointed that reducing the dietary MET level in laying hens from 54 to 72 wk of age from 0.36 to 0.23% decreased productivity, including lower egg production and smaller egg size. Jackson et al. (1987) observed that egg weight was reduced and shell strength increased by reducing dietary MET. However, these changes were obtained at the expense of lower egg production. Petersen et al. (1983) reported that reducing dietary MET reduced egg weight and improved shell quality without affecting egg production. Safaa et al. (2008) reported that a decrease in MET content of the diet from 0.36 to 0.31% and of LIN from 1.60 to 1.12% did not affect hen performance at any age. Reducing the level of added supplemental fat from 3.0 to 1.1% impaired egg production (79.3 vs. 77.0%; p < 0.05), egg weight (66.3 vs. 64.9 g; p < 0.001), egg mass (52.5 vs. 49.8 g; p < 0.001), and feed conversion ratio (FCR) (2.26 vs. 2.36 kg/kg of eggs; p < 0.001) (Safaa et al., 2008). Summers et al. (1991) have shown that the supplementation of a low protein (10% CP) diet with 0.32% MET resulted in a 10% increase in egg mass. Sell and Rogler 83); ), Chung et al. 98); ), Ravikiran and Devegowda (1998) also found that supplementing MET to a low protein diet resulted in an improvement of egg production similar to the higher protein diet. Moreover, increasing dietary MET intake significantly increased egg weight (Harm & Russell, 1993). Many studies have shown that a decrease in dietary fat significantly decreases egg size (Keshavarz & Nakajima, 1995; Bohnsack et al., 2002; Sohail et al., 2003). Supplemental fat increased both yolk and albumen weights (Safaa et al., 2008), but in some study, the improvement was proportionally greater
for the albumen than for the yolk (Grobas et al., 1999b). The results of many studies have shown that the requirement of LIN for hen productivity and egg size ranged from 1% to 2% of the diet (Scragg et al., 1987). Hence, this study was aimed at investigating the effects of dietary levels of MET, PRO and tallow (TAL) or the combination of these nutrient at a constant level of LIN (1.12%) on the performance and eggshell quality in aged laying hens.
MATERIAL AND METHODS
All experimental procedures used in this experiment were approved by the Animal Care Committee of the Ferdowsi University of Mashhad. A completely randomized experimental design was applied in a 3×2×2 factorial arrangement, with three dietary MET levels (0.35, 0.31 and 0.27%), two dietary PRO levels (14.3 and 12.87%) and two dietary TAL levels (3 and 1%), with a constant level of linoleic acid (1.55 ± 0.02%). One hundred forty-four of 70-wk-old hens layers (Hi-line W36) with initial body weight (BW) of 1,687 ± 15.8 g and similar egg production, egg weight, and egg specific gravity, were used in the experiment. The hens were randomly divided in to 12 combinations of MET, PRO and TAL (4 replicates of 3 hens per treatment). Each three hens were housed in a battery cage (40.6 × 45.7 cm) in a house with temperature maintained as close to 21°C as possible and a 16L: 8D lighting program. All hens were fed an experimental diet from 70 to 76 wk of age. They were supplied with feed and water ad libitum. The experimental diets were formulated to have simila AMEs and minerals levels, according to the nutritional requirements suggested in the Hi-line W36 Commercial Managemnt Gguide (Hy-Line International, 2009-2011). Ingredients and the nutrient composition of the experimental diets are shown in Table 1.
Specific gravity = weight in air (g)/ [weight in air (g) - weight in water (g)]
A random sample of total eggs per replicate was taken from the collection of last 3 d of each 14 d interval. The eggs used for specific gravity were weighed and broken. The yolks were separated from the albumen. Before determining yolk weight, the chalaza was removed by using a forceps. Each yolk was rolled on a blotting paper towel to remove adhering albumen. The shells were cleaned of any adhering albumen and dried for 5 d. Albumen weight was calculated by subtracting the yolk and shell weights from the whole egg weight. Subsequently, specific gravity measurement was savedt
of determining shell weight. Shell weight per unit of surface area (SWUSA) was calculated via by dividing
the shell weight (mg) the egg surface area (cm2). Egg
surface area was determined according to Carter (1975), applying the equation: 3.9782 × egg weight
(g) 0.7056. Shell thickness the average of measurements
made at three part regions of the egg (air cell, equator, and sharp end) using a shell-thickness measuring gauge (Seri 500, Mitutoyo, Tokyo, Japan). Yolk color and Haugh units were measured (in 4 eggs from each replicate) at the end of the experiment using an egg multi-tester (EMT-5200, Robotmation Co. Ltd., Tokyo, Japan). Haugh units were calculated based on albumen
Table 1 - Ingredient composition and nutrient content of laying hen diets.
0.34% MET1 0.31% MET 0.27% MET
Ingredient (%) 14.3 % PRO2 12.87 % PRO 14.3 % PRO 12.87 % PRO 14.3 % PRO 12.87 % PRO
3% TAL3
1% TAL
3% TAL
1% TAL
3% TAL
1% TAL
3% TAL
1% TAL
3% TAL
1% TAL
3% TAL
1% TAL
Corn 59.13 66.47 58.00 65.20 59.11 66.55 58.00 65.20 59.10 66.61 58.00 65.20
Soybean meal 18.94 19.26 13.90 14.43 19.00 19.31 13.95 14.46 19.04 19.40 13.99 14.53
Barley 3.15 0.50 8.00 6.42 3.15 0.40 8.00 6.42 3.16 0.30 8.00 6.39
Wheat bran 3 0 4.15 0 3 0 4.13 0 3 0 4.13 0
Salt 0.38 0.38 0.38 0.38 0.38 0.38 0.38 0.38 0.38 0.38 0.38 0.38
Tallow 3.00 1.00 3.00 1.00 3.00 1.00 3.00 1.00 3.00 1.00 3.00 1.00
Limestone 10.30 10.30 10.30 10.30 10.30 10.30 10.30 10.30 10.30 10.30 10.30 10.30
Dicalcium phosphate 1.44 1.44 1.46 1.48 1.44 1.44 1.46 1.48 1.44 1.44 1.46 1.48
Methionine 0.11 0.10 0.13 0.12 0.08 0.07 0.10 0.09 0.03 0.03 0.06 0.05
Lysine 0.05 0.05 0.18 0.17 0.04 0.05 0.18 0.17 0.05 0.04 0.18 0.17
Mineral premix4 0.25 0.25 0.25 0.25 0.25 0.25 0.25 0.25 0.25 0.25 0.25 0.25
Vitamin premix5 0.25 0.25 0.25 0.25 0.25 0.25 0.25 0.25 0.25 0.25 0.25 0.25
Calculated analysis
Energy (kcal ME/kg) 2756 2754 2756 2762 2755 2750 2755 2762 2755 2754 2755 2761
Protein (%) 14.3 14.3 12.87 12.87 14.3 14.3 12.87 12.87 14.3 14.3 12.87 12.87
Methionine (%) 0.34 0.34 0.34 0.34 0.31 0.31 0.31 0.31 0.27 0.27 0.27 0.27
Linoleic acid (%) 1.53 1.57 1.54 1.57 1.53 1.57 1.54 1.57 1.53 1.57 1.54 1.57
Calcium (%) 4.29 4.29 4.29 4.29 4.29 4.29 4.29 4.29 4.29 4.29 4.29 4.29
Non-phytate P (%) 0.38 0.38 0.38 0.38 0.38 0.38 0.38 0.38 0.38 0.38 0.38 0.38
1MET= methionine
2PRO= protein 3TAL= Tallow
4Vitamin premix provided per kilogram of diet: vitamin A (retinyl acetate), 8,800 IU; cholecalciferol, 2,200 IU; DL-α-tocopheryl acetate, 11 IU;
menadione sodium bisulfite, 2.2 mg; riboflavin, 4.4 mg; D-calcium pantothenate, 8.8 mg; nicotinic acid, 44 mg; pyridoxine hydrochloride, 2.2 mg; d-biotin, 0.11 mg; thiamine hydrochloride, 2.5 mg; ethoxyquin, 125 mg.
5Mineral premix provided per kilogram of diet: MnSO4: H2O, 185 mg; ZnO, 62 mg; FeSO47H2O, 149 mg; CuSO4: 5H2O, 19.6 mg; KI, 1.4 mg;
height and egg weight using the formula: HU = 100
log10 (H − 1.7 W 0.37 + 7.56), where HU = Haugh unit,
H = height of the albumen (mm) and W = egg weight (g). Moreover, shell strength was measured using an egg force gauge (Sanovoeng Co. Ltd., Tokyo, Japan).
The experiment was conducted as a completely randomized design with 12 treatments arranged in a factorial arrangement. Data were analyzed by means of GLM (SAS Institute, 2003). Significant differences of means among treatments were tested by Duncan’s
Table 2 - The effect of methionine (MET, %), protein (PRO, %), and tallow (TAL, %) levels on egg production, egg weight and egg mass.
Treatment Egg production (%) Egg weight(g) Egg mass(g/day)
MET (%)
PRO (%)
TAL (%)
70 to 72 wk
72 to74 wk
74 to76 wk
70 to76 wk
70 to 72 wk
72 to74 wk
74 to76 wk
70 to76 wk
70 to 72 wk
72 to74 wk
74 to76 wk
70 to 76 wk
0.34 14.7 3 78.3 77.3ab 76.7 77.5 69.1ab 68.9ab 70.1 69.4a 54.0 53.4 53.8 53.7
0.34 14.7 1 78.8 81.5a 78.5 79.6 69.9a 69.1a 67.3 68.7ab 55.0 56.3 52.8 54.7
0.34 12.8 3 75.0 67.8b 78.5 73.8 69.6a 69.5a 68.3 69.1a 52.1 47.1 67.8 51.0
0.34 12.8 1 80.5 79.1ab 79.1 79.6 66.9ab 68.0bc 67.6 67.5ab 53.9 53.9 53.6 53.8
0.31 14.7 3 82.2 81.5a 72.0 78.5 66.1b 67.4bc 66.7 66.7b 54.4 55.0 48.0 52.4
0.31 14.7 1 77.2 77.3ab 73.8 76.1 68.1ab 68.4bc 68.3 68.3ab 52.6 52.9 50.4 52.0
0.31 12.8 3 76.6 75.0ab 73.8 75.1 68.6ab 69.3a 68.7 68.9ab 52.5 51.8 50.6 51.7
0.31 12.8 1 79.4 79.7a 77.3 78.8 67.0ab 66.5b 67.7 67.1ab 53.3 53.0 52.4 52.9
0.27 14.7 3 76.1 73.2ab 75.0 74.7 67.1ab 68.0bc 67.7 67.6ab 51.0 49.7 50.7 50.5
0.27 14.7 1 76.6 70.8ab 75.0 74.1 67.7ab 67.9bc 67.8 67.8ab 52.0 48.1 50.7 50.2
0.27 12.8 3 76.1 72.6ab 72.0 73.5 68.1ab 68.9ab 68.8 68.6ab 51.9 50.0 49.6 50.5
0.27 12.8 1 81.1 79.1ab 79.1 79.8 67.6ab 67.1b 65.3 66.7b 54.8 53.2 51.8 53.3
SEM 3.13 3.50 3.68 2.98 0.903 0.894 1.05 0.747 2.15 2.44 2.55 1.84
Main effect
MET (%) 0.34 78.1 76.4 78.2 77.6 68.9 68.9 72.6 70.1 53.8 52.7 57.0 54.5
0.31 78.8 78.4 74.2 77.1 67.5 67.9 67.89 67.7 53.2 53.2 50.4 52.2
0.27 77.5 73.9 75.2 75.5 67.6 68.0 67.4 67.7 52.4 50.2 50.7 51.1
PRO (%) 14.7 78.2 76.9 75.1 76.8 68.0 68.3 68.0 68.1 53.1 52.5 51.1 52.3
12.8 78.1 75.5 76.6 76.8 68.0 68.2 70.6 68.9 53.1 51.5 54.3 53.0
TAL (%) 3 77.4 74.6 77.1 75.5 68.1 68.7 71.2 69.3 52.7 51.2 53.4 52.4
1 78.9 77.9 74.7 78.0 67.9 67.8 67.3 67.7 53.6 52.9 51.9 52.8
P
MET 0.719 0.210 0.290 0.548 0.067 0.248 0.513 0.117 0.883 0.202 0.187 0.263
PRO 0.977 0.492 0.488 0.998 0.961 0.898 0.684 0.793 0.786 0.462 0.564 0.934
TAL
0.458 0.104 0.251 0.130 0.657 0.115 0.097 0.112 0.566 0.231 0.555 0.276
PRO × TAL 0.084 0.046 0.548 0.091 0.014 0.024 0.292 0.017 0.480 0.166 0.777 0.309
MET× PRO 0.867 0.151 0.918 0.577 0.283 0.959 0.699 0.755 0.843 0.140 0.894 0.704
MET× TAL 0.515 0.305 0.899 0.686 0.649 0.982 0.230 0.323 0.690 0.292 0.801 0.951
MET× TAL × PRO 0.809 0.978 0.722 0.912 0.594 0.603 0.401 0.746 0.864 0.973 0.920 0.900
multiple range tests. Variation within each treatment was expressed as the P value and SEM (standard error of the mean) at 5% probability level.
RESULTS AND DISCUSSION
The effects of different dietary treatments on egg production, egg weight and egg mass are shown in Table 2. The interaction between dietary treatments was not significant for egg production, egg weight and egg mass with exception of PRO × TAL; therefore only the main effects are presented. The Significant interactions were observed between PRO and TAL for
egg production (72 to 74 wk) and egg weight (70 to 72, 72 to 74 and 70 to 76 wk). A protein level by TAL interaction (p< 0.05) was observed for the entire experimental period, indicating that the impact of 1% TAL on egg weight reduction was more pronounced in hens fed 12.8% PRO than in hens fed 14.7% PRO. Egg production can be affected by protein (36 weeks of age) (Liu et al., 2005), lysine (85 weeks of age) (Wu et al., 2005a), and supplemental fat (65 weeks of age) (Grobas, 1999b). There have been contradictory results about the effect of supplemental fat on egg production. Jackson et al. (1987) observed that egg weight decreased by reducing dietary MET. Likewise,
Petersen et al. (1983) reported that reducing dietary
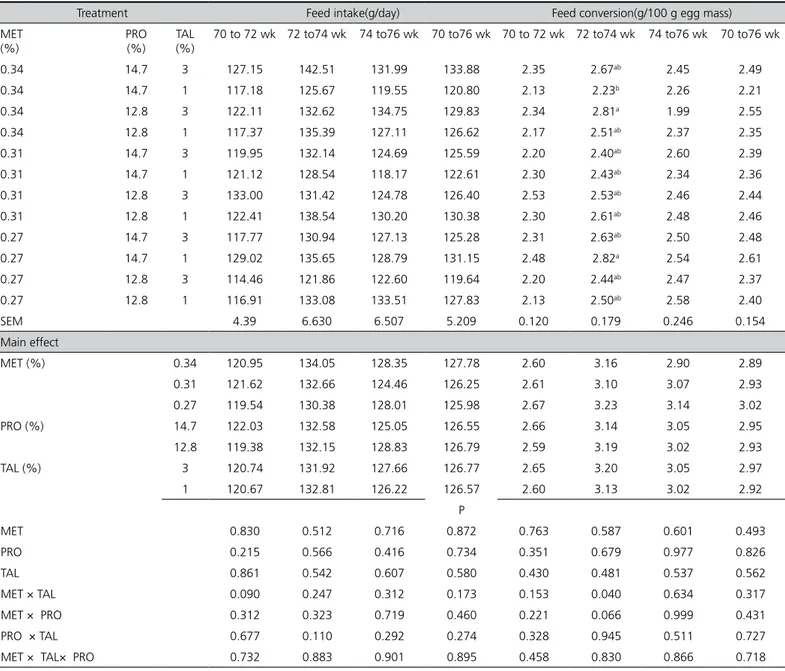
Table 3 - The effect of methionine (MET, %), protein (PRO, %), and tallow (TAL, %) levels on feed intake and feed conversion.
Treatment Feed intake(g/day) Feed conversion(g/100 g egg mass)
MET (%)
PRO (%)
TAL (%)
70 to 72 wk 72 to74 wk 74 to76 wk 70 to76 wk 70 to 72 wk 72 to74 wk 74 to76 wk 70 to76 wk
0.34 14.7 3 127.15 142.51 131.99 133.88 2.35 2.67ab 2.45 2.49
0.34 14.7 1 117.18 125.67 119.55 120.80 2.13 2.23b 2.26 2.21
0.34 12.8 3 122.11 132.62 134.75 129.83 2.34 2.81a 1.99 2.55
0.34 12.8 1 117.37 135.39 127.11 126.62 2.17 2.51ab 2.37 2.35
0.31 14.7 3 119.95 132.14 124.69 125.59 2.20 2.40ab 2.60 2.39
0.31 14.7 1 121.12 128.54 118.17 122.61 2.30 2.43ab 2.34 2.36
0.31 12.8 3 133.00 131.42 124.78 126.40 2.53 2.53ab 2.46 2.44
0.31 12.8 1 122.41 138.54 130.20 130.38 2.30 2.61ab 2.48 2.46
0.27 14.7 3 117.77 130.94 127.13 125.28 2.31 2.63ab 2.50 2.48
0.27 14.7 1 129.02 135.65 128.79 131.15 2.48 2.82a 2.54 2.61
0.27 12.8 3 114.46 121.86 122.60 119.64 2.20 2.44ab 2.47 2.37
0.27 12.8 1 116.91 133.08 133.51 127.83 2.13 2.50ab 2.58 2.40
SEM 4.39 6.630 6.507 5.209 0.120 0.179 0.246 0.154
Main effect
MET (%) 0.34 120.95 134.05 128.35 127.78 2.60 3.16 2.90 2.89
0.31 121.62 132.66 124.46 126.25 2.61 3.10 3.07 2.93
0.27 119.54 130.38 128.01 125.98 2.67 3.23 3.14 3.02
PRO (%) 14.7 122.03 132.58 125.05 126.55 2.66 3.14 3.05 2.95
12.8 119.38 132.15 128.83 126.79 2.59 3.19 3.02 2.93
TAL (%) 3 120.74 131.92 127.66 126.77 2.65 3.20 3.05 2.97
1 120.67 132.81 126.22 126.57 2.60 3.13 3.02 2.92
P
MET 0.830 0.512 0.716 0.872 0.763 0.587 0.601 0.493
PRO 0.215 0.566 0.416 0.734 0.351 0.679 0.977 0.826
TAL 0.861 0.542 0.607 0.580 0.430 0.481 0.537 0.562
MET × TAL 0.090 0.247 0.312 0.173 0.153 0.040 0.634 0.317
MET × PRO 0.312 0.323 0.719 0.460 0.221 0.066 0.999 0.431
PRO × TAL 0.677 0.110 0.292 0.274 0.328 0.945 0.511 0.727
MET × TAL× PRO 0.732 0.883 0.901 0.895 0.458 0.830 0.866 0.718
MET declined egg weight without affecting egg production. In one study, Keshavarz (2003) found that, after reducing dietary level of protein from 15 to 13% and omitting supplemental MET, egg production, egg weight, egg mass, feed consumption, body weight gain and extra large-sized eggs were reduced and FCR was increased. Similarly, Harms & Russell (2003) reported that a reduction in MET from 0.36 to30% of in the diet of laying hens from 45 to 54 wk of age did not affect body weight, egg production, egg weight, and feed intake. In fact, the authors reported that, when MET content was greater than 0.30%, egg production and egg weight were numerically rduced, indicating that MET was not limiting performance. Shafer et al.
(1996) found that egg production was not significantly different due to MET treatments when laying hens were fed diets containing MET from 0.283 to 0.4%. Egg weight can be increase by increasing dietary protein (Liu et al., 2005 & Wu et al., 2005a), MET (Keshavarz, 1995), lysine (Novak et al., 2004 and Liu et al., 2005), supplemental fat (Grobas, 1999a, 1999b; Sohail et al., 2003) and energy (Bryant et al., 2005).
The impacts of protein and amino acids have been well understood. However, there are discrepant reports about the impact of supplemental fat or dietary energy on egg weight. In our experiment, a significant interaction was obtained between PRO × TAL on egg weight. This outcome was similar to that of Sohail et
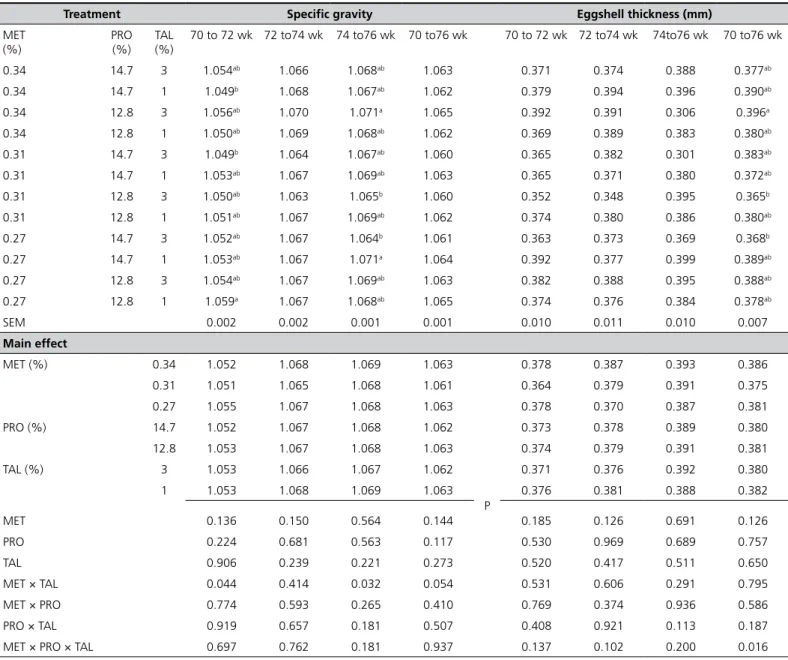
Table 4 - The effect of methionine (MET, %), protein (PRO, %), and tallow (TAL, %) levels on specific gravity and eggshell thickness.
Treatment Specific gravity Eggshell thickness (mm)
MET (%)
PRO (%)
TAL (%)
70 to 72 wk 72 to74 wk 74 to76 wk 70 to76 wk 70 to 72 wk 72 to74 wk 74to76 wk 70 to76 wk
0.34 14.7 3 1.054ab 1.066 1.068ab 1.063 0.371 0.374 0.388 0.377ab
0.34 14.7 1 1.049b 1.068 1.067ab 1.062 0.379 0.394 0.396 0.390ab
0.34 12.8 3 1.056ab 1.070 1.071a 1.065 0.392 0.391 0.306 0.396a
0.34 12.8 1 1.050ab 1.069 1.068ab 1.062 0.369 0.389 0.383 0.380ab
0.31 14.7 3 1.049b 1.064 1.067ab 1.060 0.365 0.382 0.301 0.383ab
0.31 14.7 1 1.053ab 1.067 1.069ab 1.063 0.365 0.371 0.380 0.372ab
0.31 12.8 3 1.050ab 1.063 1.065b 1.060 0.352 0.348 0.395 0.365b
0.31 12.8 1 1.051ab 1.067 1.069ab 1.062 0.374 0.380 0.386 0.380ab
0.27 14.7 3 1.052ab 1.067 1.064b 1.061 0.363 0.373 0.369 0.368b
0.27 14.7 1 1.053ab 1.067 1.071a 1.064 0.392 0.377 0.399 0.389ab
0.27 12.8 3 1.054ab 1.067 1.069ab 1.063 0.382 0.388 0.395 0.388ab
0.27 12.8 1 1.059a 1.067 1.068ab 1.065 0.374 0.376 0.384 0.378ab
SEM 0.002 0.002 0.001 0.001 0.010 0.011 0.010 0.007
Main effect
MET (%) 0.34 1.052 1.068 1.069 1.063 0.378 0.387 0.393 0.386
0.31 1.051 1.065 1.068 1.061 0.364 0.379 0.391 0.375
0.27 1.055 1.067 1.068 1.063 0.378 0.370 0.387 0.381
PRO (%) 14.7 1.052 1.067 1.068 1.062 0.373 0.378 0.389 0.380
12.8 1.053 1.067 1.068 1.063 0.374 0.379 0.391 0.381
TAL (%) 3 1.053 1.066 1.067 1.062 0.371 0.376 0.392 0.380
1 1.053 1.068 1.069 1.063 0.376 0.381 0.388 0.382
P
MET 0.136 0.150 0.564 0.144 0.185 0.126 0.691 0.126
PRO 0.224 0.681 0.563 0.117 0.530 0.969 0.689 0.757
TAL 0.906 0.239 0.221 0.273 0.520 0.417 0.511 0.650
MET × TAL 0.044 0.414 0.032 0.054 0.531 0.606 0.291 0.795
MET × PRO 0.774 0.593 0.265 0.410 0.769 0.374 0.936 0.586
PRO × TAL 0.919 0.657 0.181 0.507 0.408 0.921 0.113 0.187
MET × PRO × TAL 0.697 0.762 0.181 0.937 0.137 0.102 0.200 0.016
al. (2003), who reported that increasing fat affected egg weight. In contrast, Zou & Wu (2005) reported that increasing supplemental fat had no significant effect on egg weight. The differences among results in literatures may be due to differences in bird strain, body weight, age and fat composition. Significant interactions were observed between the levels of MET and TAL for FCR from 72 to 74 wk of age. Other dietary treatments did not have a noteworthy influence on FCR. An increase in MET content of the diet from 0.27 to 0.34% with constant level of 1%TAL resulted to best FCR (2.82 vs. 2.23) (Table 3). Safaa et al. (2008) reported that egg production and FCR per a dozen eggs were impaired at low levels of MET (0.31%) and supplemental fat (SFAT) (1.1%) in the diet. Soheil et al. (2003) indicated that SFAT enhanced
feed efficiency and egg weight in laying hens. Some researchers showed that increased dietary MET intake significantly improved egg production, egg mass, egg weight and FCR (Bunchasak & Silapasorn, 2005), which also agrees with our results. Indeed, increasing fat content has the influence of slowing passage rate, allowing more time for the contact between enzymes and dietary components, which may lead to added digestibility of the nutrients such as protein and amino acids (Ewan, 1991). There was an interaction of MET × TAL for specific gravity in during the periods of 70 to 72 and 74 to 76 wk. Specific gravity dropped from 1.059 to 1.049 when hens were fed additional MET (0.34 vs.27%) at the level of 1%TAL. Keshavarz (2003) indicated that a reduction in MET content in the diet of laying hens from 0.32 to 0.27% did not
Table 5 - The effect of methionine (MET, %), protein (PRO, %), and tallow (TAL, %) levels on shell weight and SWUSA.
Treatment Shell weight(g) SWUSA(mg/cm2)
MET (%)
PRO (%)
TAL (%)
70 to 72 wk 72 to74 wk 74 to76 wk 70 to76 wk 70 to 72 wk 72 to74 wk 74 to76 wk 70 to76 wk
0.34 14.7 3 5.40 5.54 5.66 5.53 68.5 70.3 70.9 69.8
0.34 14.7 1 5.82 5.76 5.84 5.81 72.9 72.9 75.5 73.7
0.34 12.8 3 5.86 5.50 5.62 5.66 73.8 69.4 64.8 68.5
0.34 12.8 1 5.57 5.63 5.59 5.60 72.1 72.1 71.8 72.0
0.31 14.7 3 5.35 5.57 5.76 5.56 69.8 71.7 74.7 72.1
0.31 14.7 1 5.44 5.43 5.65 5.51 69.6 69.1 72.1 70.3
0.31 12.8 3 5.56 5.16 5.66 5.46 70.7 65.3 71.9 69.3
0.31 12.8 1 5.58 5.67 5.54 5.60 72.2 73.8 71.1 72.3
0.27 14.7 3 5.66 5.55 5.18 5.46 73.1 71.0 66.3 70.1
0.27 14.7 1 6.04 5.54 5.57 5.71 77.4 70.9 71.4 73.2
0.27 12.8 3 5.55 5.67 5.58 5.60 70.9 71.9 70.9 71.3
0.27 12.8 1 5.37 5.46 5.37 5.40 69.1 70.6 70.6 70.1
SEM 0.219 0.179 0.204 0.153 2.69 2.25 3.21 2.13
Main effect
MET (%) 0.34 5.66 5.61 5.68 5.65 71.8 71.2 70.8 71.0
0.31 5.56 5.46 5.65 5.53 70.6 70.0 72.4 71.0
0.27 5.48 5.56 5.42 5.54 72.6 71.1 69.8 71.2
PRO (%) 14.7 5.62 5.56 5.61 5.60 71.9 71.0 71.8 71.6
12.8 5.58 5.52 5.56 5.55 71.5 70.5 70.2 70.6
TAL (%) 3 5.56 5.50 5.58 5.55 71.1 69.9 69.9 70.2
1 5.64 5.58 5.59 5.60 72.2 71.6 72.1 71.9
P
MET 0.423 0.486 0.237 0.803 0.554 0.705 0.510 0.989
PRO 0.780 0.654 0.732 0.660 0.787 0.701 0.380 0.430
TAL 0.568 0.435 0.485 0.242 0.491 0.214 0.250 0.163
MET × PRO 0.154 0.889 0.494 0.920 0.102 0.905 0.329 0.926
MET × TAL 0.991 0.432 0.407 0.821 0.976 0.447 0.261 0.537
PRO × TAL 0.091 0.555 0.358 0.648 0.261 0.212 0.919 0.966
influence the percentage of large eggs or the specific gravity of the eggshell from 56 to and 68 wk of age. However, in a second experiment, this author observed that a further reduction of MET to 0.23% decreased the percentage of large eggs from 37.6 to 22.2% and increased eggshell specific gravity from 1.0749 to 1.0788 in laying hens from 54 to 72 wk of age, which is almost identical to our experiment. Novak et al. (2006) showed that by feeding low-protein diets, specific gravity was linearly reduced, indicating that
shell quality was being reduced. Increasing the total sulfur amino acids (TSAA): lysine rate increased shell quality, indicating that, in order to optimize shell quality, the sulfur amino acid requirements for the synthesis of shell synthesis of shell protein matrix needs to be considered. Simkiss & Taylor (1957) reported that the shell protein matrix is comprised of 70% protein. Also, increasing the sulfate groups present in the shell matrix significantly increases the Ca binding ability, which in turn, may increase both shell percentage and specific
Table 6 - The effect of methionine (MET, %), protein (PRO, %), and tallow (TAL, %) levels on yolk weight and albumen weight.
Treatment Yolk weight(g) Albumen weight(g)
MET (%)
PRO (%)
TAL (%)
70 to 72 wk
72 to74 wk
74 to76 wk
70 to76 wk
70 to 72 wk
72 to74 wk
74to76 wk
70 to76 wk
Haugh unit
Yolk color
Shell strength (kg force)
Large eggs
(%)
0.34 14.7 3 20.0ab 20.3 19.9 20.0 40.8ab 42.6 44.9 42.8 51.0 7.000 2.465abc 87.1
0.34 14.7 1 19.9b 20.1 20.4 20.1 43.3ab 43.2 44.6 43.7 41.9 7.375 2.123abc 84.7
0.34 12.8 3 20.8a 19.4 19.1 19.8 43.1ab 40.7 40.3 41.4 51.9 7.625 2.679a 66.1
0.34 12.8 1 19.5ab 20.3 20.5 20.1 42.0ab 42.2 43.9 42.7 55.5 7.375 2.350abc 72.0
0.31 14.7 3 19.6ab 20.1 20.1 19.9 40.7ab 43.1 43.9 42.6 38.1 6.750 2.185abc 75.5
0.31 14.7 1 20.1ab 19.8 20.8 20.2 42.1ab 41.1 43.9 42.4 50.4 7.875 2.452abc 79.5
0.31 12.8 3 20.8a 21.3 19.7 20.6 45.3a 44.0 44.6 44.7 50.4 7.375 2.197abc 73.3
0.31 12.8 1 20.1ab 20.1 20.2 20.1 42.0ab 42.7 41.9 42.2 47.8 8.000 2.523ab 71.5
0.27 14.7 3 21.0a 20.5 20.2 20.6 43.7ab 41.6 41.9 42.4 49.5 7.125 1.947c 73.0
0.27 14.7 1 20.7a 20.2 19.8 20.3 42.5ab 41.6 41.5 41.9 56.4 7.000 2.323abc 74.1
0.27 12.8 3 19.5ab 19.7 19.8 19.6 39.6b 42.3 41.3 41.0 57.3 7.125 2.455abc 69.3
0.27 12.8 1 18.8ab 19.6 20.0 19.5 44.6ab 42.4 41.6 42.9 57.4 7.250 2.055bc 66.1
SEM 0.462 0.422 0.525 0.389 1.506 1.012 1.207 0.858 5.716 0.254 0.167 7.86
Main effect
MET (%) 0.34 20.0 20.0 20.0 20.0 42.3 42.2 43.5 42.7 50.1 7.34 2.40 76.7
0.31 20.1 20.3 20.2 20.2 42.5 42.7 43.6 43.0 46.7 7.50 2.33 75.0
0.27 20.0 20.0 20.0 20.0 42.6 42.0 41.6 42.1 55.2 7.12 2.19 68.1
PRO (%) 14.7 20.2 20.2 20.2 20.2 42.8 42.2 43.5a 42.6 47.9 7.18b 2.24 76.8
12.8 19.9 20.1 19.9 20.0 42.2 42.4 42.3b 42.5 53.4 7.45a 2.37 69.7
TAL (%) 3 20.3 20.2 19.8 20.1 42.2 42.4 42.8 42.5 49.7 7.16b 2.32 74.6
1 19.8 20.0 20.3 20.1 42.8 42.2 42.9 42.6 51.6 7.47a 2.30 71.92
p
MET 0.895 0.477 0.828 0.669 0.960 0.553 0.069 0.325 0.121 0.127 0.210 0.444
PRO 0.270 0.708 0.299 0.299 0.510 0.808 0.045 0.768 0.104 0.033 0.197 0.060
TAL 0.121 0.526 0.119 0.888 0.529 0.728 0.950 0.777 0.573 0.030 0.860 0.706
MET × PRO 0.002 0.053 0.870 0.129 0.324 0.152 0.378 0.221 0.928 0.497 0.753 0.546
MET × TAL 0.669 0.201 0.386 0.717 0.412 0.173 0.224 0.115 0.607 0.047 0.039 0.764
PRO × TAL 0.074 0.713 0.454 0.801 0.679 0.643 0.411 0.863 0.656 0.588 0.234 0.675
MET × PRO × TAL 0.813 0.239 0.794 0.632 0.027 0.965 0.104 0.174 0.226 0.369 0.156 0.487
gravity, as well as overall shell quality. Other researchers have also indicated that decreasing dietary protein will decrease shell quality (Keshavarz & Nakajima, 1995; Keshavarz & Jackson, 1992). Eggshell thickness was reduced due to decreasing the MET content of the diet from 0.34% to 0.31% when the dietary TAL was 3% (p<0.05), independently of PRO level. Eggshell thickness decreased significantly due to the reduction of dietary Met content from 0.34 to 0.27% (p<0.05). The eggshell is formed during the passage of the egg through the oviduct, where the various layers of the eggshell are assembled sequentially (Novak et a004). Same Consistent with our experiment, Bunchasak & Silapasorn (2005) reported that eggshell thickness was significantly improved when MET was added at 0.3 or 0.38% to low crude protein diets. Similarly, Carey et al. (1991) observed increasing eggshell weight when increasing Met level from 330 to 450 mg/hen/day. However, Shafer et al. (1996) reported that increasing TSAA intake from 624 to 822 mg/hen/day had no effect on eggshell weight or eggshell percentage at 52 wk of age. Thus, it is suggested that MET intake higher than 620 mg/hen/dayd would not have any benefit on eggshell quality. Another reason is that, in general, the foundation of a shell consists of a protein matrix, and it may be possible that increasing the total sulfur amino acid intake may influence the protein synthesis of the shell membranes (Novak et al., 2004).
Yolk weight (Table 6) was affected by different levels of MET × PRO from 70 to 72 wk. The hens fed the highest level of MET and PRO had the lowest yolk weight. There was interaction (p<0.05) among MET, PRO and TAL for albumen weight in the first 2-wk period. Albumen weight diminished as the level of MET (0.31 to 0.27) decreased at a constant level of PRO (12.87%) and TAL (3%) in the diet (45.38 vs. 39.66 g). Albumen weight was significantly (p<0.05) affected by dietary PRO level from 74 to 76 wk (Table 6). Hens receiving the diet with 14.7% PRO produced heavier albumen than those receiving diet with 12.8% PRO. At the level of 3% TAL and 12.8% protein of diet, albumen weight was reduced when the MET level was reduced from 0.31 to 0.27% (p<0.05). Novak et al. (2006) indicated that, as protein intake declined, dry albumen and yolk weights linearly decreased and increased, respectively. On the other hand, protein intake influenced yolk components. As protein intake was decreased from 16.3 to 13.8 g/day, there was a linear rise in percentage of yolk from 27 to 27.4%, respectively. According to Table 6, yolk color was more intense at the end of experimental for layers fed 12.8% PRO than those fed 14.7%. Contrary to the results
obtained by Gunawardana et al. (2008), increasing TAL levels from 1 to 3% in the diet significantly weakened egg yolk color (Table 6). Corn, corn gluten meal, and alfalfa meal are the main xanthophyll sources used in poultry feeds. In laying hens,the muscles and skin xanthophyll supplies are transferred to the ovaries at the onset of sexual maturity, and part of them are excreted in the egg yolk (Gouveia et al. 1996). It is likely that reduction of corn level in diet contained 3%, compared with 1% TAL, resulted to paler yolk color.
Gunawardana et al. (2008) reported that yolk color
depends on fat soluble carotenoids present in dietary fats. There are contradictory results relative to the effect of added fat on yolk color. Madiedo & Sunde (1964) reported that added dietary fat had no effect on egg yolk color. In contrast, Mackay et al. (1963) found that supplemental fat had a significant effect on egg yolk color. A significant interaction of MET × TAL was observed for yolk color (Tabl 6). The supplementation of 3% TAL significantly depressed yolk color compared to with 1% TAL. Omara & Romeilah (2009) found that egg color did was not statistically different between 0.35 and 0.40% MET levels. Differences in egg yolk color were significant considering the energy × MET × folic acid interaction. These discrepancies may be due to the xanthophyll content of the main feed ingredients rather than to the actual energy levels, for the xanthophyll levels were not controlled within the diets. This could be due to high carotenoid content of corn (Ciftci et al, 2003). Significant MET × TAL interaction was also observed for shell strength (Table 6). The highest shell strength value was obtained in hens fed diets with high levels of MET and TAL plus 12.8% protein. In contrast to this experiment, Novak et al. (2006) reported that dietary treatments varying in the total sulfur amino acids and protein had no effect on eggshell breaking strength. Egg size was not influenced by dietary treatments. In conclusion, the results of the present experiment showed that decreasing the levels of MET and PRO to lower levels than the recommended values can decrease egg weighgt with no negative effects on the productive performance and egg quality of laying hens in the late phase of production.
REFERENCES
Abdallah AG, Harms RH, Russell GB. Effect of age and resting on hens laying eggs with heavy or light shell weight. Journal of Applied Poultry Research 1995; 4:131–137.
L-Saffar AA, Rose SP. The response of laying hens to dietary amino acids. World’s Poultry Science 2002; 58:209-234.
Bohnsack CR, Harms RH, Merkel WD, Russell GB. Performance of commercial layers when fed diets with four contents of corn oil or poultry fat. Journal of Applied Poultry Research 2002; 11: 68–76. Bryant M, Wu G, Roland DR. Optimizing dietary energy for profits and
performance of two strains of White Leghorns. Proceedings of the International Poultry Scientific Forum Abstracts; 2005; Atlanta, GA. p.23.
Bunchasak C, Silapasorn T. Effects of adding methionine in low-protein diet on production performance, reproductive organs and chemical liver composition of laying hens under tropical conditions. International Journal of Poultry Science 2005;4:301-308.
Carey JB, Asher RK, Angel JF, Lowder LS. The influence of methionine intake on egg composition. Poultry Science 1991;70(Suppl. 1):151.
Carter TC. The hen’s egg: Estimation of shell superficial area and egg volume, using measurements of fresh egg weight and shell length and breadth alone or in combination. British Poultry Science 1975;16: 541-543.
Chung HJ, Chung-Yi L, Wen-Shyg Chiou P. Effects of ambient temperature and methionine supplementation of a low protein diet on the performance of laying hens. Animal Feed Science Technology 1998;74: 289-299.
Ciftci I, Yenice E, Gokceyrek D Ozturk E. Effects of energy level and enzyme supplementation in wheat based layer diets on hen performance and egg quality. Acta Agriculture Scandinavica, Section-A Animal Science 2003;53: 113-119.
European Council Directive. Certain marketing standards for eggs. In: Grades of eggs: grading of grade A eggs of regulation (EC); 2006 No. 2295/2003.
Ewan RC. Energy utilization in swine nutrition. In: Miller R, Ullrey DE, Lewis AJ, editors. Swine nutrition. Boston, MA: Butterworth-Heinemann; 1991. p.134-135.
Gouveia L, Veloso V, Reis A, Fernandes H, Novais J, Empis J. Chlorella vulgaris used to colour egg yolk. Journal of Science Food and Agricculture 1996; 10: 167–172.
Grobas S, Mendez J, Blas C de, Mateos GG. Influence of dietary energy, supplemental fat and linoleic acid concentration on performance of laying hens at two ages. British Poultry Science 1999a; 40: 681–687. Grobas S, Mendez J, De Blas C, Mateos GG. Laying hen productivity as
affected by energy, supplemental fat, and linoleic acid concentration of the diet. Poultry Science 1999b; 78: 1542–1551.
Grobas S, Mateos GG, Mendez J. Influence of dietary linoleic acid on production and weight of eggs and egg components in young brown hens. Journal of Applied Poultry Research 1999c; 8: 177–184. Gunawardana P, Roland Sr DA, Bryant MM. Effect of energy and protein on
performance, egg components, egg solids, egg quality, and profits in molted Hy-Line W-36 hens. Journal of Applied Poultry Research 2008; 17: 432–439.
Harm RH, Russell GB. Optimizing egg mass with amino acid supplementation of a low protein diet. Poultry Science 1993;72: 1892-1896.
Harms RH, Russell GB. Performance of commercial laying hens when fed diets with various levels of methionine. Journal of Applied Poultry Research 2003;12: 449–455.
Harms RH, Russell GB. Performance of commercial laying hens when fed diets with various sources of energy. Journal of Applied Poultry Research 2004;13: 365–369.
Hempe JM, Laukxen RC, Savage JE. Rapid determination of egg weight and specific gravity using a computerized data collection system. Poultry Science 1988; 67: 902–907.
Hy-Line International. Iowa: West Des Moines; 2009-2011.
Jackson ME, Hellwig HM, Waldroup WP. Shell quality: Potential for improvement by dietary means and relationship with egg size. Poultry Science 1987; 66: 1702–1713.
Keshavarz K. Effects of reducing dietary protein, methionine, choline, folic acid, and vitamin B12 during the late stages of the egg production cycle on performance and eggshell quality. Poultry Science 2003; 82:1407-1414.
Keshavarz K. Further investigations on the effect of dietary manipulations of nutrients on early egg weight. Poultry Science 1995; 74: 62-74. Keshavarz K, Jackson ME. Performance of growing pullets and laying
hens fed low-protein, amino acid-supplemented diets. Poultry Science 1992;71: 905–918.
Keshavarz K, Nakajima S. Re-evaluation of calcium and phosphorus requirement of laying hens for optimum performance and eggshell quality. Poultry Science 1993; 72: 144–153.
Keshavarz K, Nakajima S. The effect of dietary manipulations of energy, protein, and fat during the growing and laying periods on early egg weight and egg components. Poultry Science 1995;74: 50–61. Liu Z, Wu G, Bryant MM, Roland Sr DA. Influence of added synthetic lysine
in low-protein diets with the methionine plus cysteine to lysine ratio maintained at 0.75 Journal of Applied Poultry Research 2005;14:174-182.
Mackay E, Mountney GL, Naber EC. Yolk color resulting from different levels of paprika extract in the ration. Poultry Science 1963;42: 32–36. Madiedo G, Sunde ML. The effect of algae dried Lake Weed, alfalfa and
ethoxyquin on yolk color. Poultry Science 1964; 43:1056–1060. Novak CL, Yakout H, Scheideler SE. The combined effects of dietary lysine
and total sulfur amino acid level on egg production parameters and egg components in Dekalb Delta laying hens. Poultry Science 2004; 83: 977-984.
Novak CL, Yakout H, Scheideler SE. The effect of dietary protein level and total sulfur amino acid: lysine ratio on egg production parameters and egg yield in Hy-Line W-98 hens. Poultry Science 2006;85: 2195–2206. Omara II, Romeilah RM. Energy and methionine utilization in laying hen
diets supplementation with folic acid. Research Journal Agriculture Biology Science 2009;5(4): 428-444.
Petersen CF, Sauter EA, Steele EE, Parkinson JF. Use of methionine intake restriction to improve egg shell quality by control of egg weight. Poultry Science 1983; 62:2044–2047.
Ravikiran D, Devegowda G. Effects of DL- methionine supplementation in the ration of commercial layers during summer. International Journal of Poultry Science 1998;33:279-283.
Roland DA Sr. Research note: Egg shell problem: Estimate of incidence and economic impact. Poultry Science 1998;67:1801–1803.
Roland DA Sr, Sloan DR, Harms RH. The ability of hens to maintain calcium deposition in egg shell and egg yolk as the hen ages. Poultry 1975; 54:1720–1723.
Safaa HM, Serrano MP, Valencia DG, Arbe X, Jime´nez-Moreno E, La´zaro R, Mateos, GG. Effects of the levels of methionine, linoleic acid, and added fat in the diet on productive performance and egg quality of brown laying hens in the late phase of production. Poultry Science 2008; 87:1595–1602.
SAS Institute. SAS user’s guide: statistics. Cary; 2003.
Scragg RH, Logan NB, Geddes N. Response of egg weight to the inclusion of various fats in layer diets. British Poultry Science 1987;28: 15–21. Sell DR, Rogler JC. The effect of sorghum tannin and methionine on
the performance of laying hens maintained in two temperature environments. Poultry Science 1983;63: 109-116.
Shafer DJ, Carey JB, Prochaska JF. Effect of dietary methionine intake on egg component yield and composition. Poultry Science 1996;75:1080-1085.
Simkiss K, Taylor C. A histochemical study of the organic matrix of hen egg-shells. Quarterly Journal of Microscopical Science 1957; 98: 19–28. Sohail SS, Bryant MM, Roland Sr DA. Influence of supplemental lysine,
isoleucine, threonine, tryptophan, and total sulphur amino acids on egg weight of Hy-Line W-36 hens. Poultry Science 2002; 81:1038– 1044.
Sohail SS, Bryant MM, Roland Sr DA. Influence of dietary fat on economic returns of commercial Leghorns. Journal of Applied Poultry Research 2003; 12: 356–361.
Summers, J. D., J. L. Atkinson and D. Spratt. Supplementation of a low protein diet in an attempt to optimize egg mass output. Canadian Journal Of Animal Science 1991;71: 211-220.
Wu G, Bryant MM, Roland Sr DA. Effect of synthetic lysine on performance of commercial Leghorns in phase II and III (second cycle) while maintaining the methionine+cysteine/lysine ratio at 0.75. Proceedings of the International Poultry Scientific Forum Abstracts; 2005a; Atlanta. USA. p.43.
Wu G, Liu Z, Bryant MM, Roland Sr DA. Performance comparison and nutritional requirements of five commercial layers strains in phase IV. International Journal of Poultry Science 2005b; 4:182-186.