ISSN: 0975-766X
Available Online through
Research Article
www.ijptonline.com
ASSESSMENT OF DISSOLUTION PROFILES OF BRAND AND GENERIC
VALPROIC ACID FORMULATIONS BASED ON AN EXPERIMENTAL CLEAN
AUTOMATIC APPROACH
A. R. Pires 1, A. N. Araújo1 *, C. M. Barbosa 2, M. C. B. S. M. Montenegro 1
1
REQUIMTE, Serv. Química-Física, Fac. Farmácia (U.P). Rua Aníbal Cunha 164, 4099-030 Porto, Portugal. 2
CTMUP- Serv. Tecnologia Farmacêutica, Fac. Farmácia (U.P).
Email: [email protected]
Received on 08-10-2010 Accepted on 25-10-2010
ABSTRACT
Several commercial brand and generic formulations containing sodium valproate (NaVA) alone or in different combinations of this with valproic acid (VAac) were assayed using a clean automatic approach. To accomplish it, a sequential injection analysis based system coupled to potentiometric detection was exploited. The dissolution tests were performed at pH 6.8 where valproic acid (VAac) is quantitatively converted to its anionic form. Valproate ion selective electrode (VA-ISE) plus reference electrode or the VA-ISE plus a sodium ion selective electrode (Na+-ISE) were integrated as detectors in the system, to respectively obtain single global dissolution profiles of valproate (VA-) or simultaneous dissolution profiles of Na+ and VA- ions. The system harvested 300 µL of the dissolution medium to process measurements within a time window of approximately 2 min in the intervals of 1-8.0x10⁻³ mol/L concerning VA-, and 3-8x10⁻³ mol/L in Na+ ion. The proposed flow setup was able to efficiently discriminate profiles of generics and brand formulations, and also between forms containing different VAac/NaVA relative proportions, only with the spent of a pH/ionic strength adjusting buffer solution used as carrier in the system.
Introduction
Drug absorption depends on the release profile from its solid dosage form, dissolution under physiological conditions, and from its permeability across the gastrointestinal tract. Due to the critical nature of the first two steps, in vitro dissolution tests are used as significant and simple procedures to forecast in vivo response to the active substance1. During the development of a medicinal product, dissolution tests are of overwhelm importance in identifying factors that can affect the intended bioavailability of the drug, such as the granulation process (wet or dry), the tablet compression force, the formulation composition, and the physicochemical properties of both active and inactive ingredients. As sooner the composition and manufacturing process are defined, the same tests keep still useful to ensure both batch-to-batch consistency of scale-up and production, and to demonstrate similarity to those of pivotal clinical trial batches. For immediate release formulations, single-point dissolution tests complemented with several specifications have been employed2,3. However, additional sampling times are required for these forms approval and at least data corresponding to three test times if characterization of modified release formulations is aimed. Regarding the last, an increased awareness of the potential relevance of dissolution tests can be deduced from recent FDA guidances4,5. What was formerly a test to differentiate a good batch product is now looked as bioavailability predicting tool even replacing clinical studies to determine bioequivalence. Therefore, scientists are challenged to design appropriate tests based on the objectives to be accomplished, e.g., quality control, in vivo-in vitro correlations, bioequivalence between modified release forms, etc6.
Recent guidelines7 suggest that manual sampling studies should be avoided due to sensitivity lack to establish differences between generics and brand medicines. Thus, the alternative adoption of automatic procedures should be designed in order to fulfill two objectives: to provide real time information about the dissolution process and to deal with a dramatic increase of samples to be analyzed in a robust and environmental clean fashion. Presently, determination of drugs concentration in the dissolution medium is routinely performed with UV spectroscopy or HPLC-UV8-12. Most often, harmful reagents are needed and also severe problems emerge from turbidity caused by suspensions and colloids formed in the dissolution medium. The presence of air
bubbles in the light path lead to large artifacts in the dissolution profiles enabled by both on- and off-line UV-HPLC systems which yield discontinuous profiles and requires sample redrawn and preparation. Also UV active excipients, the limited sensitivity for lower strength active principles and the narrow dynamic range can be additional cumbersome issues. Alternatively, potentiometric transduction are less prone to be disturbed by colloidal systems and suspensions, almost dispense prior sample treatment, is inexpensive to implement and can be modulated concerning selectivity to the target drug13. Previous studies resort to the use of potentiometric detectors for dissolution tests and with its robust coupling to automatic sample handling instruments14-16. More recently, in situ dissolution testing with potentiometric detection has shown to enable results in good agreement with other currently used techniques17. Potentiometric sensors performance can be enhanced when attached to continuous flow systems and among those, the outstanding merits of using sequential injection (SI) technique in drug dissolution monitoring systems have been referred into reviews18,19.
Valproic acid (2- propylpentanoic acid) is an anticonvulsivant drug used in the treatment of bipolar disorder. In terms of its biopharmaceutics classification1, valproic acid is a class II drug characterized by low solubility and high intestinal permeability. On contrary its sodium salt presents the high solubility of 50 mg/ml20. Hence, it is clinically available in several forms, namely: sodium valproate (NaVA) alone, valproic acid (VAac) alone, and combinations of both in different dosages and respective proportions (2:1 and 1:1), either as brand or as generic formulations. Consequently, distinct dissolution profiles should be expected considering the dosage form under test. In this work, a sequential injection (SI) system is exploited to allow in full automatic fashion the dissolution profiles of solid modified release dosage forms available in the Portuguese market. Its flexibility allows simple change between the one or two detectors use and can be easily programmed to harvest samples from dissolution medium in specific time intervals, accordingly to the objective of dissolution studies. The system was exploited to obtain either the single global dissolution profiles of valproate or the simultaneous dissolution profiles of sodium and valproate ions, in brand and generic commercial tablets and capsules.
Experimental
Reagents and solutions
All solutions were prepared with distilled and double deionised water, with conductivity < 0.1µS.cm-1. Analytical grade chemicals without additional purification were used.
Response characteristics of valproate tubular electrodes were assessed using either phosphate buffer solution (0.1 mol L-1) or a MES buffer solution (0.01 mol L-1), both with pH settled to 6.8. Phosphate buffer solution was prepared using the potassium dihydrogen orthophosphate (Fluka) and potassium hydrogen orthophosphate (Fluka). A solution 0.01 mol L-1 of MES (2-morpholinoethanesulphonic acid) (Sigma) was prepared by simple dissolution in water and adjusting the final pH by means of a concentrated KOH solution.
A stock solution containing 0.1 mol L-1 of sodium valproate (Merck) were obtained by weighting and dissolving the amount of pure powder in phosphate buffer or MES, accordingly to the carrier used in the SI- system. Whenever necessary, these solutions were appropriately diluted with the respective buffer. To evaluate the quality of the results provided by the automatic procedure, HPLC chromatographic analysis was chosen as reference procedure (BP, 1999). A methanol (Merck) /phosphate buffer solution (pH 3) in the proportions 70:30 (v/v) was used as eluent. The buffer was prepared with a 0.32 % w/v solution of potassium dihydrogen orthophosphate (Fluka). After methanol addition, the mixture was adjusted to pH 3 with orthophosphoric acid (Merck).
Valproate dosage forms
The dissolution profiles of nine modified-release solid dosage forms (tablets and capsules) containing NaVA either isolated or in association with VAac were examined (Table 1). Studied products correspond to reference brands and generics commercially available in the Portuguese market. Their contents were labeled in terms of NaVA (500 mg or 300 mg), except for one product (Diplexil®-R) in which the content was expressed in VAac (500 mg). Brand product A denoted Diplexil® 500 mg film-coated gastro-resistant tablets (Tecnifar SA, Lisbon, Portugal, batch nº 08EQ151). Brand B was Depakine® Chrono 500 film-coated tablets (Sanofi-Aventis SA, Porto Salvo, Portugal, batch nº 04326). Generic B1 referred to Ácido Valpróico Ratiopharm 500 mg film-coated
tablets (Ratiopharm Lda, Carnaxide, Portugal, batch nº H40958). Generic B2 was Ácido Valpróico Sandoz® 500 mg film-coated tablets (Sandoz Farmacêutica Lda, Sintra, Portugal, batch nº 8A5060). Brand C was Diplexil® - R 500 mg film-coated tablets (Tecnifar SA, Lisbon, Portugal, batch nº 08LQ133). Brand D denoted Diplexil® 300 capsules containing prolonged-release pellets (Tecnifar SA, Lisbon, Portugal, batch nº 06005961). Brand E was Depakine® Chrono 300 film-coated tablets (Sanofi-Aventis SA, Porto Salvo, Portugal, batch nº CH355). Generics E1 and E2 were respectively Ácido Valpróico Ratiopharm 300 (Ratiopharm Lda, Carnaxide, Portugal, batch nº H33611) and Ácido Valpróico Sandoz® 300 mg film-coated tablets (Sandoz Farmacêutica Lda, Sintra, Portugal, batch nº 8M9588).
Table 1. Studied products organized into groups, according to the formulation type, content and nature of the
active ingredient (only sodium valproate or association sodium valproate/ valproic acid). NaVA – sodium valproate; VAac – valproic acid.
Group Formulation type Content
(in mg of NaVA) VAac : NaVA relative proportion NaVA (mg) VAac (mg) Brand / Generic A delayed-release tablets (gastro-resistant) 500 0:1 500 ─ Brand A
B prolonged-release tablets 500 2:1 333 145 Brand B
prolonged-release tablets 500 2:1 333 145 Generic B1
prolonged-release tablets 500 2:1 333 145 Generic B2
C prolonged-release tablets 570a 1:1 285 250 Brand C
D prolonged-release capsules 300 0:1 300 ─ Brand D
E prolonged-release tablets 300 2:1 200 87 Brand E
prolonged-release tablets 300 2:1 200 87 Generic E1
prolonged-release tablets 300 2:1 200 87 Generic E2
a
The active substance is sodium divalproate (532.8 mg), which is an association of NaVA and VAac (1:1)
a
The active substance is sodium divalproate (532.8 mg), which is an association of NaVA and VAac (1:1)
Apparatus
The SI-system proposed is depicted in Fig.1, having two transmission lines for the determination of VA- alone and for the sequential determinations of Na+ and VA-, respectively. It comprised a Minipuls 3 Gilson
(Villiers-le-Bell, France) peristaltic pump equipped with a PVC propulsion tube (1.65 mm i.d.) of the same brand, an eight-port rotary valve (RV) from Valco Instruments, model C25-3118, (Huston, USA), a NResearch 161 T031 (Stow, USA) three-way solenoid valve, (SV), and a Crison MicropH-2002 potentiometer (mV). A 90-02-00 Orion AgCl/Ag reference electrode (RE) containing the MES buffer solution in the outer compartment was also connected in the transmission line containing only the detector for VA-. The potentiometer reference entrance was connected to the detector of VA-, when dissolution profiles of both ions were aimed. All components of the manifold were interconnected with PTFE tubing of 0.8 mm i.d. and home-made devices such as acrylic supports for tubular and reference electrodes. Two 006BT Omnifit bubble trap devices equipped with 006BTM PTFE membranes were also placed in transmission lines before the detectors.
Fig.1. Schematic view of the flow system used. P: peristaltic pump, SV: solenoid valve, HC1: 400 cm long (0.8 mm i.d.) holding coil 1, RV: multi-port injection valve, DV: dissolution vessel, SP: 15 cm PTFE (0.5 mm i.d.) sampling probe, CS- calibration solution, BT – bubble traps, VA-ISE : valproate ion selective electrode, Na-ISE: sodium ion selective electrode, RE: reference electrode, mV: potentiometer and C2: 200 cm PTFE coil. The system was controlled by a microcomputer through an Advantech PCL 711B interface card. Software for control of the system and data acquisition was written in Microsoft QuickBasic 4.5. For data treatment, Origin version 6.1 was used.
The Ph. Eur. paddle apparatus was adopted for carrying out the dissolution tests. For this purpose a single unit apparatus Erweka DT (Germany) equipped with a paddle and a peak vessel (Vankel, USA) was used. The
paddle rotational speed and the temperature of the dissolution medium were kept at 50 rpm and 37.0 ± 0.5 ºC, respectively. The dissolution tests were performed in triplicate using the MES buffer solution (pH 6.8) as the dissolution medium.
HPLC measurements were performed in a JASCO LC- Net II /Adc system comprising a model JASCO PV-2080 Plus pump, a Rheodyne 7725i injector (50µL loop) and a 5 µm C18 Kromasil column (250 mm x 4.6 mm). A diode array system, model JASCO MD- 2015 Plus was used as detector and the data processed by means of software package brand ChromNav. In the determinations of sodium concentration a Jenway (East Norwalk, USA) flame emission photometer was used for the reference procedure.
Electrodes preparation
Ion selective electrodes without internal reference solution and of tubular configuration were constructed and used as potentiometric detectors. A polymeric membrane with the composition described in (Santos et al. 2006), was prepared concerning valproate electrode (VA-ISE). It was the final mixture containing 1% (w/w) of the ionophore manganese(III) tetraphenylporphirine (Merck) with 10% relatively to the ionophore amount of anionic additive sodium tetraphenylborate (NaTPB- Fluka), 66% (w/w) of the plasticizer o-nitrophenyloctyl ether (o-NFOE- Fluka), and 33% (w/w) of poly(vinyl chloride) (Fluka) previously dissolved in 6 mL of tetrahydrofuran (Merck). Sodium ion selective electrodes (Na-ISE) were prepared accordingly to (Kimura et al. 1996), by using a mixture of 3% (w/v) of sodium ionophore VIII (Fluka), 0.6% (w/v) of sodium tetrakis [3, 5- bis (trifluoromethyl) phenyl]borate (Fluka) as additive, in 69% of o-nitrophenyloctyl ether and 27.4% (w/v) of poly(vinyl chloride) previously dissolved in tetrahydrofuran (Merck). The electrodes were obtained by dropwising previous mixtures over the inner wall of a central hole (1mm i.d.) drilled along a tubular shaped graphite/epoxy resin working as conductive support21. Conventionally shaped electrodes for sodium, without internal reference solution were also prepared as in22. After complete drying of membranes, the tubular electrodes were attached to the manifold and then hydrated with the carrier stream for a few minutes before being used.
Procedures
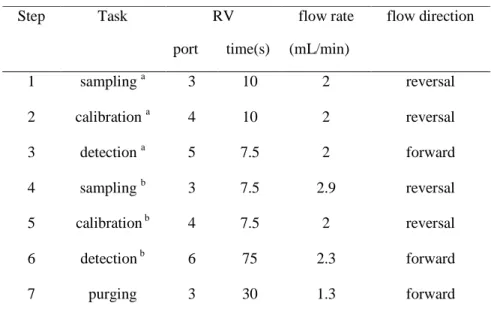
The automatic procedure started by filling the holding coil (HC1) and transmission lines connected to the rotary valve (RV) with carrier solution until the achievement of detector stable signals (Fig.1). This was accomplished by selecting ports 5 or 6 of the RV and positioning the peristaltic pump in the forward pumping mode. The protocols required to carry out the analytical procedures are defined in Table 2. Steps 1-3 or 2-3 were applied when using transmission line 5 to respectively sample dissolution medium aliquots or NaVA standard solutions and propelling them through the VA-ISE and RE electrodes. Calibration curves were established considering peak height averages of transient signals obtained after the successive injections of the calibrating solutions. The hydrodynamic conditions to accomplish the determinations were settled after noticing invariant calibration slopes for injection volumes in the range 100-400 µl aspirated through port 4, at flow-rates between 0.7 and 2.0 ml/min and propelled through transmission lines at flow-rates from 0.3 to 2.9 ml/min. The steps 4 to 6 were used when sequential determinations of VA- and Na+ were intended. They resulted of the application of a simplex optimization algorithm to the injection volumes, aspiration and propelling flow rates and C2 coil length. A response function considering minimum analytical signals carryover and VA-ISEsignals maximization was considered for this ending.
Table 2. System control parameters.
Step Task RV flow rate flow direction
port time(s) (mL/min)
1 sampling a 3 10 2 reversal 2 calibration a 4 10 2 reversal 3 detection a 5 7.5 2 forward 4 sampling b 3 7.5 2.9 reversal 5 calibration b 4 7.5 2 reversal 6 detection b 6 75 2.3 forward 7 purging 3 30 1.3 forward a
Dissolution tests with the immersion of one tablet or capsule in 900 ml of MES at 37ºC ± 0.5, the rotation paddle set at 50 rpm, and steps 1 and 3 or 4 and 6 (table 2) followed. Approximately 300 µL of dissolution medium were aspirated into HC1 and complete processing lasted less than 2 minutes. Signals were acquire over time and computer stored for further process. The dissolution end was considered when at least a 30 minutes stable plateau was reached. Finally, a calibration was performed, using four NaVA standard solutions that cover the overall range of VA concentrations released from the medicine. Using this calibration curve, molar concentrations at dissolution time points were determined and converted to the corresponding released drug percentages versus time. For all formulations three dissolution tests, with three different tablets of the same lot were performed. An additional step (7, table 2) was included before and after the dissolution tests performance, to purge the sampling tube, ensuring aspiration of a new portion of the dissolution liquid or standard solution and cleaning the remaining of standard solutions or dissolution medium.
In order assess the accuracy of results an HPLC external comparison method was selected (BP 1999). However, the mobile phase composition (70:30 (v/v) methanol and phosphate buffer (pH3)) and chromatographic conditions were slightly changed due to acetonitrille worldwide scarceness. During the dissolution tests, 5 ml aliquots were manually drawn from the dissolution vessel at predetermined periods of time (5, 10, 15, 20, 45 60 and 90 minutes) and injected respectively in the SI-system and in the HPLC equipment after filtration, the last with the eluent flow rate of 1 ml per minuteand a detection wavelength of 220 nm. In HPLC measurements, a five point calibration was performed using NaVA standards ranging from 7x10⁻⁵ to 1.5x 10⁻³ mol. L-1 and the respective dissolution medium samples diluted whenever necessary to fit the linear interval.
Flame photometry was considered to determine Na+ in samples drawn from the dissolution medium. For that reason, dissolution tests were done in solvent MES pH 6.8 adjusted with concentrated ammonia solution, instead of KOH. In this way, interference of potassium ion in flame photometer measurements was avoided. During the dissolution tests, 20 ml aliquots were manually drawn from the dissolution vessel (at 10, 30, 60, 120 and 150 minutes) and introduced in the SI-system and in the flame photometer. Due to large sampled volumes,
the total volume of dissolution liquid was every time reestablished with fresh MES solution. The flame photometer was previously calibrated using five NaVA standard solutions ranging from 4.3x10⁻⁵ mol.L-1 to 3x10⁻⁴ mol.L-1. Whenever necessary, dissolution medium samples were diluted in order to fit the linear interval.
Results and discussion
Optimization and electrodes evaluation
The selected valproate sensor mixture was preferred above others previously reported (Santos et al. 2006) due to the favourable slopes and pH working range which allow determinations at the recommended pH of 6.8. However, the calibration slopes obtained for this valproate sensor solution when using phosphate buffer (0.01 mol l-1) both as pH and ionic strength adjuster were slightly inferior compared with the ones described in literature (Santos et al. 2006), and for that reason the more hydrophilic MES buffer (0.01 mol l-1) was tested, aiming to achieve the reported values. Calibrations performed with valproic acid standard solutions from 5x10⁻⁵ to 1x10⁻¹ mol L-1 (with half a decade increments, (n=189)) enabled slopes of -44.5 and -66.5 mV. decade -1, in phosphate and MES buffers, respectively, with similar relative standard deviations (3.3 and 3.7 %) and linear responses ranging from 5.0x10⁻⁵ to 1.0x10⁻¹ mol L-1. Additionally, an amount corresponding to approximately 50 mg of VA of a pulverised random sample tablets was dissolved either with phosphate or MES buffers and tested. The respective average relative error (n=16) to the declared amount content was lower for MES (3.5%) relatively to phosphate (6.5%) due to the observed electrode sensitivity difference.
Concerning Na-ISE, the membrane composition was selected as in (Kimura et al. 1996) due to both its appropriate analytical response range and to the relatively low interference of K+, the counter anion used in MES buffer pH adjustment. This electrode was firstly evaluated in batch conditions, using NaVA solutions ranging from 5x10⁻⁴ to 3x10⁻³ mol. L-1, in MES buffer. The calibration slope value of 49.7 mV.dec -1 with a relative standard deviation of 5% was obtained. Then, electrodes with tubular shaped configuration were assayed in the system using the hydrodynamic conditions stated before for VA-ISE. An average slope of 49.3 ± 4 mV.dec-1 (n=40) with the lower limit of detection of 3x10⁻⁴ mol. L-1 was achieved, underlying a response
behaviour independent of the electrode shape and of the adopted procedure (i.e. batch or flow) However, the electrode response of Na+ electrode was much faster then that observed for the VA-ISE electrode. Thus simultaneous determination of both substances required the placement of the Na-ISE upstream relatively to VA-ISE in order to avoid overlapping response. Both hydrodynamic conditions as well the coil C2 length were optimised by means of a simplex optimisation algorithm. The outcome is stated in Table 2, steps 4 and 6, for a minimum coil length of 2m. In these conditions independent analytical signals were obtained in the time widows of 5-30 and 32-75 seconds for Na+ and VA-, respectively. When used together, these sensors showed appropriate linear results in the analytical ranges of 1x10⁻⁴- 8x10⁻³ mol L-1 for valproate and 3x10⁻³- 8x10⁻³ mol L-1 for sodium. With the proposed system ISEs were used in consecutive days (six to eight hours per day) to perform dissolution tests over a period of two months without lost of response characteristics. When compared to reference methods a spent of approximately 3.5 mL of MES buffer per assay was necessary.
Assessment of dissolution profiles using VA-ISE
The dissolution profiles of medicines commercially available in the Portuguese market (Table 1) were first evaluated on a VA- determinations basis. The mean dissolution profiles of tested products obtained are illustrated in Figure 2 (A to E). In Figure 2.E, a typical record obtained with the automatic SI-system is also presented. Table 3 shows for every group (A to E) several dissolved percentages of valproate ion in the dissolution medium (Qx%) relatively to the labelled amounts, the respective times in minutes, and the coefficients of variation (CV). The dissolved VA drug percentages include various representative points along the entire average dissolution profile, as for example Q30%, Q50%, Q80%, Q95%. Accordingly to the guidelines
“The dissolution procedure: Development and Validation”, a properly designed dissolution test should result in data that is not highly variable2. Dissolution results may be considered highly variable if the coefficient of variation (CV) is greater than 20% at time points of ten minutes or less, and greater than 10% CV at later time points. From the analysis of this table it is possible to verify that the method is reproducible, since all CV values are much lower than 20% in the first ten minutes after starting the system, and almost all values a lot less than 10% CV, at later time points. Exception is in generic E1, at Q30% that presents a small deviation from this value
(CV of 12%), at minute 28. In the presented profiles, it can be generally noticed that the first CV value is the highest and a decrement tendency occurs. When reaching 95% of VA release, all CV are lower than 6%. One hour after the initiation of the system, all tablets and capsules except generic 1 in groups B and C, and the formulation of group D, release at least 80% of the declared content of VA ion. When comparing the results obtained by the proposed system with HPLC for valproate determination in aliquots drawn at different dissolution times, the resulting errors are inferior to 5%, which corroborates the accuracy of the proposed method.
Table-3: Mean dissolution profiles of tablets groups (n=3) obtained with valproate detector. Q% - percentage relatively to the labelled amount of valproate ion dissolved, in time (min) at which it occurs; CV – coefficient of variation (%).
Group Q% released (min); CV(%)
Q 15 Q30 Q 50 Q 60 Q 80 Q 85 Q 95 A -- 7; 12.0 9; 7.3 -- 20; 6.2 -- 78; 4.4 B -- 4; 10.2 7; 10.8 -- 30; 3.2 -- 270; 1.5 B1 -- 45; 2.0 60; 3.5 -- 115; 1.5 -- 310; 0.3 B2 -- 5; 9.6 14; 3.0 -- 60; 5.4 -- 205; 4.4 C -- -- -- 43; 2.4 75; 9.5 75; 9.5 -- D 22; 8.7 29; 4.9 46; 7.9 -- 102; 6.6 -- 179; 5.6 E 2; 10.1 4; 1.9 7; 2.7 -- 16; 2.3 -- 52; 1.1 E1 20; 9.2 28;12.2 37;7.3 -- 72; 3.3 -- 170; 0.02 E2 2; 14.9 4; 9.4 9; 12.6 -- 31; 3.6 -- 84; 3.1
Fig.2. Average dissolution profiles (n=3) obtained with valproate tubular detector (A to E). Charts divided in A,
B, C, D, E, accordingly to groups in table 1. I: brand formularion; II: generic 2 and III: generic 1. Figure E shows a typical SI-system record of the dissolution profile for Generic E1.
Assessment of dissolution profiles using both ISEs
Some combination formulations containing NaVA and VAac (group B) were selected to test the system integrating two detectors, one selective to valproate and other to sodium ions. In this system, simultaneously to VA determination, the amount of Na dissolved at different times was also estimated. The results obtained are presented in Table 4, showing percentages of dissolved VA- or Na+ substances (Q%) relatively to the labelled amounts, the respective times at which the dissolution occurred in minutes, and the coefficients of variation (CV). The dissolved VA and Na drug percentages include various representative points along the entire average dissolution profile, for example Q15%, Q60%, Q80%, Q95%. Figure 3 (A to C) shows the average sodium and
valproate profiles obtained with three dissolution tests for brand and generic 1 and 2 respectively, using valproate and sodium tubular detectors. In fig 3.C, a typical SI-system record obtained from the dissolution of a generic tablet can be observed. The results depicted in Table 4 using the two detectors are as reproducible as those obtained with VA-ISE only, since CV values found for both ions dissolution accomplish the limits established2. However, for sodium, a CV of 14.6% is found in brand formulation at 15 minutes after starting the system. This is not considered so important once the first sodium dissolution values occur approximately at minute 13, as can be observed in fig. 3 A. In fig. 3 B, it is possible to notice that no sodium dissolved values are depicted until 60 minutes after test start-up, for generic 1. Results enabled by flame photometry were determined for aliquots manually drawn at 10 and 30 minutes and compared with potentiometric ones. At ten
minutes, no sodium release occurred, and at 30 minutes, the percentage of sodium dissolved in the dissolution medium was below the pratical limit of detection of Na tubular detector. It is furthermore possible to observe for formulations in group B (fig. 3), that dissolution profiles of sodium ions follows nearly the same evolution than valproate ones.
Table-4: Mean dissolution profiles of group B (n=3) obtained with sodium and valproate tubular detectors,
Na-ISE and VA-Na-ISE respectively. Q% - percentage relatively to the labelled amount of valproate ion dissolved, in time (min) at which it occurs; CV – coefficient of variation (%).
Group B Detector Q% released (min); CV(%)
Q15 Q 35 Q 50 Q 60 Q 80 Q 95 Brand Na-ISE 15; 14.6 -- -- 24; 0.3 48; 6.2 -- VA-ISE -- 5; 9.9 7; 16.8 -- 30; 5.2 70; 4.9 B1 Na-ISE -- -- -- 115; 6.1 164; 1.4 -- VA-ISE -- 30; 8.5 40; 1.5 -- 72; 1.9 150; 5.6 B2 Na-ISE -- -- -- 26; 8.3 61; 3.4 97; 5.1 VA-ISE -- 7; 6.4 10; 4.2 -- 58; 2.1 190; 4.5
Comparison of brand and generic formulations
Groups B and E are constituted by brand and generic formulations, equivalent to 500 and 300 mg in NaVA, respectively (table 1). For both groups, obvious differences are noticed between the brand formulation and generics 1 and 2, particularly in the first 60 minutes and with respect to generic 1. In fact, despite of the dosage strength, this generic presents a similar dissolution profile with a considerable lag time without releasing VA ion (figs. 2.B, 2.E and 3.B), while brand formulation releases drug in the first two minutes. Differences in profiles of brand relatively to generic 2 are less dramatic. In spite of that, after 150 minutes, the three profiles inside the respective groups are practically identical.
In groups B and E, VAac/ NaVA proportion is the same (2:1), in spite of the different dosage (500 versus 300 mg). The drug proportion seems to greatly influence the respective profiles (figures 2.B and 2.E), once they are very similar. On the other hand, different proportions of VAac/ NaVA (2:1 versus 1:1), showed accentuated
differences in profiles (figures 2.B and 2.C), in spite of the similar dosage (equivalent to 500 and 570 mg in NaVA, respectively). This is probably due to formulation differences and also the proportion itself, as the two forms (valproic acid and valproate sodium salt), have very distinct intrinsic solubilities. In determinations using valproate and sodium detectors, the comparison of the brand formulation with generics (group B), show distinct release profiles, not only for valproate, but also for sodium ions (figure 3). These differences are once more accentuated in generic 1 relatively to generic 2. Several quantitative methods are described for comparison of dissolution profiles and among those similarity factor (f2) plays a main role23, being officialised both by FDA
and EMEA as: f2 = 50 x log {[1 + (1/n)∑ |Rj - Tj|2]-0.5 x 100}, where Rj e Tj are the percent dissolved of the
reference and test products, respectively, at each time point j.This factor can assume values between 0 and 100, and the profiles are considered similar when f2 falls into the interval 50-100. The obtained results for valproate
profiles of group B are: f2 (Brand and Generic B1) = 28 and f2 (Brand and Generic B2) = 51. For formulations of group C are: f2 (Brand and Generic C1) = 25 and f2 (Brand and Generic C2) = 57. For sodium profiles are: f2 (Brand and Generic B1) = 27 and f2 (Brand and Generic B2) = 62. For the calculations, at least four time points representative of the entire dissolution range
were used. Corroborating visual observations of the profiles, brand and generic 2 are similar and brand and generic 1 are not.
Fig.3. Average sodium (dashed line) and valproate (full line) dissolution profiles (n=3) obtained for
formulations of group B with sodium and valproate tubular detectors. A- Brand; B- Generic B1; C- Generic B2. Figure C shows a typical SI-system record of the dissolution profile for generic B2.
Conclusions
A sequential injection system was exploited concerning automatic testing of dissolution characteristics of valproic acid solid forms. The proposed procedure evidenced adequate robustness concerning the hydrodynamic conditions adopted, use of potentiometric detection and large scale analysis ability. Several modified release tablets and capsules were analysed including single and combination formulations. In this last ones, valproic acid and its sodium salt are present in different proportions and dosages. At pH 6.8, all valproic acid is converted to anionic form, so it was possible to follow the global release profile of the active principle. When two detectors were used, it was also feasible the simultaneous accomplishment of sodium ion dissolution (that arises from valproic acid sodium salt solubilisation) and global valproate dissolution. The proposed system proved to automatically generate reproducible, accurate and sensible dissolution profiles using either one or the two detectors, in a large range of concentrations since the first minutes of the dissolution test. A lot of dynamic processes take place prior to disintegration and dissolution initiation as the capacity of tablets to wet, and this system shows phenomena as lag times of tablets, rendering profiles much more informative for comparison purposes. Its flexibility allows changing easily from one to two detectors, accordingly to the goals of the operator and the kind of dissolution studies demanded. Moreover, the proposed sequential injection setup shows the capability of adequately discriminating differences between brand and generics drugs, demonstrated either for valproate, as for sodium profiles. This analytical procedure can be adapted to studies on development of new formulations incorporating sodium valproate alone or mixtures of valproic acid and its sodium salt, to identify active principles mixtures proportions and formulation characteristics that might influence or have a crucial effect on the bioavailability of the drug. It is our conviction that the approach used in this work can easily be extended to other combined drugs formulations. In the present case, we can foresee immediate application in formulation development research, at industrial laboratories.
Acknowledgments
Ana Rita Pires thanks FCT and FCE for a PhD grant (25995/2005).
REFERENCES
1. US Department of Health and Human Services, Guidance for Industry, Dissolution testing of Immediate Release Solid Oral Dosage Forms. CDER, FDA, Office of Training and Communications, Rockville MD20855 1997.
2. United States Pharmacopeial Convention, The United States Pharmacopoeia (USP) 30th ed. The National Formulary (NF) 25th ed., Rockville MD20855 2007.
3. British Pharmacopoeia Commission, British Pharmacopeia (BP). The Stationery Office on behalf of the Medicines and Healthcare Products Regulatory Agency (MHRA), London 1999.
4. CDER, Div. Of Bioequivalence, Guidance, Oral Extended (Controlled) Release Dosage Forms, In vivo Bioequivalence and In vitro Dissolution Testing. ODG, Rockville MD20855 1996.
5. CDER, Div. Of Bioequivalence, Guidance for Industry, SUPAC-MR: Modified Release Solid Oral Dosage Forms. ODG, Rockville MD20855 1997.
6. Crison, J. R., Diss Technol 1999; 6: 6-11.
7. Committee for Medicinal Products for Human use (CHMP), Guideline on the Investigation of Bioequivalence. European Medicines Agency, London 2008.
8. Johansson, J., Cauchi, M., Sundgren, M., J Pharm Biomed Anal 2002; 29: 469-472. 9. Nir, I., Johansson , J., Johnson B.D., Schatz, C., Pharm Technol 2001; 25: 33-40. 10. Tomsu, D., Icardo, M. C., Calatayud, J. M., J Pharm Biomed Anal 2004; 36: 549-557. 11. Vranic, E., Icardo, M. C., Calatayud J. M., J Pharm Biomed Anal 2003; 33:1039-1048. 12. Wang, Q. M. D., Higgins, J., Diss Technol 2006; 13:16-19.
13. Pires, A.R., Araújo, A.N., Lopes, J.A., Montenegro, M.C.B.S.M., Anal Lett 2009; 42:1923-1939.
14. Bohets, H., Vanhoutte, K., Maesschalck, R., Cockaerts, P., Vissers, B., Nagels, L., Anal Chim Acta 2007; 581: 181-191.
15. Paseková, H., Sales, M.G., Montenegro, M.C.B.S.M., Araújo, A.N., Polásek, M., J Pharm Biomed Anal 2001; 24:1027-1036.
16. Sales, M.G., Montenegro, M.C.B.S.M., J Pharm Sci 2001; 90:1125-1133.
17. Peeters, K., Maesschalck, R., Bohets, H., Vanhoutte, K., Nagels, L., Eur J Pharm Sci 2008; 34:243-249. 18. Fang, Z., Fang, Q., Liu, X., Chen, H., Liu, C., TrAC -Trends Anal Chem 1999; 18:261-271.
19. Pimenta, A., Montenegro, M.C.B.S.M., Araújo, A.N., Calatayud, J.M., J Pharm Biomed Anal 2006; 40:16-34.
20. Merck & Co., The Merck Index: An encyclopedia of Chemicals, Drugs and Biologicals, 14th ed. Whitehouse Station, N.J., USA 2006.
21. Lima, J.L.F.C., Montenegro, M.C.B.S.M., Roque da Silva, A.M., J Flow Injection Anal 1990; 7:19–33.
22. Lapa, R.A.S, Costa Lima, J.L.F.C., Silva, A.M.R., Il Farmaco 1990; 45:901-913. 23. Moore J.W., Flanner H.H., Pharm Tecnol 1996; 20: 64-74.
Corresponding Author: A. N. Araújo1 *,
REQUIMTE, Serv. Química-Física, Fac. Farmácia (U.P). Rua Aníbal Cunha 164, 4099-030 Porto, Portugal.