ACE 33
CULTURAL HERITAGE 3D MODELLING AND
VISUALISATION WITHIN AN AUGMENTED
REALITY ENVIRONMENT, BASED ON
GEOGRAPHIC INFORMATION TECHNOLOGIES
AND MOBILE PLATFORMS
Luís Marques, José António Tenedório, Malcolm Burns, Teresa Româo,
Fernando Birra, João Marques & Antero Pires
Cómo citar este artículo: Marques, L. et al. Cultural Heritage 3D Modelling and visualisation
within an Augmented Reality Environment, based on Geographic Information Technologies and mobile platforms [en línea] Fecha de consulta: dd-mm-aa. En: ACE: Architecture, City and
Environment = Arquitectura, Ciudad y Entorno, 11 (33): 117-136, 2017. DOI: 10.5821/ace.11.33.4686. ISSN: 1886-4805.
CULTURAL HERITAGE 3D MODELLING AND VISUALISATION WITHIN AN
AUGMENTED REALITY ENVIRONMENT, BASED ON GEOGRAPHIC
INFORMATION TECHNOLOGIES AND MOBILE PLATFORMS
MARQUES, Luís1
TENEDÓRIO, José António2 BURNS, Malcolm3
ROMÂO, Teresa4 BIRRA, Fernando5 MARQUES, João6 PIRES, Antero7
Initial remission: 25-10-2015
Final remission: 18-01-2017
Key words: Digital representations; GIS; AR; Lisbon; aqueduct
Structured abstract
This article applies Geographic Information Technologies (GIT) to the field of Cultural Heritage (CH), aiming to analyse patrimonial valuation through Digital Representations (DR). It seeks to briefly introduce the importance of DR through the concepts of the individual’s spatial cognition (mental) and physical (external) perceptions. It approaches the main topics of 3D data acquisition, modelling and visualisation, as well as cultural heritage applications, and presents 3D and Augmented Reality (AR) trials, together with their main results and discussion. The methodology consists of exploratory data acquisition using terrestrial and Unmanned Aerial Vehicles (UAV), 3D modelling procedures, and the integration between 3D-Geographical Information Systems (GIS) and AR environments (mobile platforms) applied to patrimonial systems and elements in urban areas.
The results consist of several Trials and products of 3D acquisition and modelling processes to be visualised in an AR environment. These allow for adjusting the core solutions for further mobile application development. Taking the ancient Lisbon (Aqueduct) water supply system (classified as a national monument) as a case study, the fact that most of it is imperceptible, owing to the large extent of the undergrown galleries, enables the onsite visualisation of the relation between the system and the city elements within a mixed reality environment. The
1
Centre de Política de Sòl i Valoracions (CPSV), Universitat Politècnica de Catalunya | BarcelonaTECH (Spain) Centro Interdisciplinar de Ciências Sociais CICS.NOVA - Faculdade de Ciências Sociais e Humanas - Universidade Nova de Lisboa (CICS.NOVA.FCSH/UNL), Portugal. E-mail: [email protected]
2
Centro Interdisciplinar de Ciências Sociais CICS.NOVA - Faculdade de Ciências Sociais e Humanas - Universidade Nova de Lisboa (CICS.NOVA.FCSH/UNL), Portugal. E-mail: [email protected]
3
Oficina de Projectes Europeus (CTT SP) UPC. España. E-mail: [email protected]
4
Departamento de Informática da Faculdade de Ciências e Tecnologia da Universidade Nova de Lisboa (FCT -UNL) Portugal. E-mail: [email protected]
5
Departamento de Informática da Faculdade de Ciências e Tecnologia da Universidade Nova de Lisboa (FCT -UNL) Portugal. E-mail: [email protected]
6
Geodrone (Portugal). E-mail: [email protected]
7
Departamento de Informática da Faculdade de Ciências e Tecnologia da Universidade Nova de Lisboa (FCT -UNL) Portugal. E-mail: [email protected]
methods used aimed to strengthen the idea of the potential application of this technology for heritage valuation, associating the use of geographic information to fields commonly related to a strong visual perception of space, providing essential data not only for occasional users (public), but also for specialised technicians, opinion/decision makers, promoters and other stakeholders.
1. Introduction
The comprehension of an individual’s mental images of the urban systems and their elements (which may change if the circumstances of observation are different); the level of those images and their quality; and the development and inter-relations, all contribute to build a wider satisfactory physical environment for everyone. Modelling, or remodelling, should be accompanied by a definition of a “Visual Plan” for the city or metropolitan area: embracing a set of recommendations and controls that would be concerned with the visual scale in urban form, illustrating the relevant public images, basic visual problems, opportunities, critical elements of the images, interrelationships of elements with their detailed qualities and possibilities for transformation(Lynch, 1960).
Chown (Golledge, 1999) indicates that landmarks are unique objects that are worth learning about because they are not easily confused with other elements of the environment. Landmarks are so important in navigation and for spatial cognition that humans have developed a highly efficient object recognition system that comprises visual pathways. Distinguishing a familiar landmark is sufficient to make the difference between being lost and knowing where we are.
Familiar landmarks that are associated with specific places are most appropriate for helping the subject to return to particular locations, constituting an important component of spatial wayfinding (Etienne in Golledge, 1999).
According to Golledge (1997) if we are aware of people’s preferences, perceptions and attitudes, better matches can be made between planning and policy making, addressing the population’s needs (for whom plans are made). Knowing something about people’s perceptions, preferences and images, provides fundamental information that complements planners’ and managers’ intuition guidelines and legal restrictions (Gärling and Golledge in Golledge, 1997).
The effectiveness of external representation is influenced by how it supports cognitive perceptions (Hahn and Kim, 1999 in Khatri et al., 2006). Perceptions capture an extensive range of sensory variation having a huge epistemological importance, being at the very source of all human empirical knowledge. From a cognitive point of view, the structure of geographic information and cartography can provide auspicious premises to approach how humans perceive, represent and interact with their spatial environment, regarding the valuable evidence to the properties of the underlying mental structures and processes for spatial cognition (Berendt et al., 1998).
Zhang (1997, 2001) in Khatri et al., (2006) argues that “Most work in cognition assumes that the mind has mental representations analogous to computer data structures”. As in cognitive mapping, in GIS, physical objects are usually associated with geometry and position.
Computers allow us to conduct reproducible experiments, introduce or modify variables and change conditions in a way that is not possible in the physical world itself.
Technological advances, especially regarding the ability to extend (represent) the physical world and computer modelling capabilities, have led to the creation of an increasing number of models of objects and environments (Koller et al., 2009). The use of Digital Representations (DR) in research offers a number of advantages, especially the ability to create detailed models of possible pasts and futures. By modelling a number of different variables, we can test and change them to explore different hypothetical situations. This is, of course, impossible in the real world, as circumstances on site are unpredictable and constantly changing (Eve, 2012).
2. 3D data acquisition
Three-dimension (3D) DR are generating innovative forms of visualisation and conceptualisation in the field of territorial and urban management enabling the observation of objects and structures at different distances, angles and scales (space/time – 4D). The concept of Augmented Reality (AR) is often referred to as the enrichment of the existing world through the virtual environment, expanding it without requiring the observer to change the sense of presence in reality, as opposed to total virtual immersion. This (mixed) environment is often generated on site using mobile platforms. The AR environment, based on GIT and Mobile Platforms, contributes to the construction of external representations. The following sections seek to demonstrate the methodological procedures followed in this process.
Progress in geographic information acquisition and development (hardware and software), allows innovative perspectives for territorial management using third dimension, enabling advanced possibilities of visualisation and analysis in virtual, immersive, or mixed environments (Valencia et al., 2015). The association of 3D modelling and cultural heritage has been growing in interest, partly due to the broader use of LiDAR (laser scanning) and photogrammetry. These technologies allow to record objects remotely, efficiently and accurately, often difficult to perform with previous survey methods (Dore and Murphy, 2012).
There are obvious advantages in conventional airborne remote sensing and the very high-resolution satellite imagery. However, Unmanned Aerial Vehicles8 (UAV) photogrammetry introduces a flexible, low-cost and rapid response alternative to other traditional methods such as the ground acquisitions and manned vehicles, producing large-scale topography or detailed 3D models, as a main or complementary solution. The rapid and high frequency of data acquisition, and the spread of low-cost platforms combined with SRL cameras and GNSS systems (e.g. GPS, GLONASS, BeiDou for navigation, point cloud coordinates and possibly geopositioning) constitutes some of the main characteristics for the success of this technology (Nex and Remondino, 2014).
3D point cloud data automatically generates 3D models, including: Digital Terrain Models (DTM - plain terrain), Digital Surface Models (DSM - including the elevations of objects above the ground), and 3D models (from isolated or collective objects). 3D point clouds are mostly
8
generated directly from a laser scan or through stereo image matching, processing imagery algorithms by overlapping (terrestrial or airborne). This means that it is possible to acquire relevant urban parameters at low-cost, from 3D point cloud data acquisition to the extraction of parameters (Tenedório et al., 2014).
Presently, there are enormous varieties of tools able to acquire 3D information and at the same time; the solutions for rendering and displaying are at an advanced stage of development (Valencia et al., 2015).
3. 3D modelling and visualisation
The most prominent manifestation of humans’ pattern recognition capabilities concerns visualisation, revolutionising our behaviour and way of communicating, travelling, organizing and even managing space (Portugali, 2010).
Many authors have demonstrated the importance of using conventional two-dimensional (2D) GIS technologies applied to urban scenarios, comprehending the territory by visualising and analysing fundamental geospatial data and then contributing to decision making processes (Hanzl 2007, Batty 1998 in St-Aubin and Mustafavi, 2010). Most GIS users have been operating with 2D GIS datasets, representing urban characteristics in the form of points, lines or polygons, challenging the human capacity to visualise (the complex) built environment. However, urban planning is intimately connoted with spatial relationships between objects, buildings, blocks, streets, neighbourhoods and cities, and often 2D representations are considered insufficient to address real 3D planning problems, especially at the scale (in area and height) of the modern city (Hernandez and Hernandez, 1997; Evans and Hudson-Smith, 2001 in Yin, 2010). 3D representations generate more intuitive methods of interaction between the user and the represented data. Considering that the general public do not possess GIS skills, 3D environments can increase the engagement of the user, making it much easier to understand, interact and participate by visualizing interactively, for example, volumes, textures, shadows, sights and their relation. This principally occurs because of its high level of similarity to reality, congregating detailed information (Level of Detail - LoD) and volume property, stimulating more enthusiasm and simplifying creative solutions for detected problems after a walk-drive-fly-through re-presentation (embodying the user in that environment or presence), improving comprehension and communication (adapted from Geertman, 2002; Crampton, 2001; Neves and Camara, 1999; Jacobson, 1992 in Zhang, 2004). Thus, 3D representations and analysis tools are more adequate for volume variation and enrich the spatial representations (Zhang, 2004).
While 3D modelling has a strong visual representational capability and corresponds to a faithful exemplification of reality, GIS has a powerful capacity for querying and analysis (Yin, 2010). Li
et al. (2004) in St-Aubin and Mustafavi (2010), expressed the necessity for 3D GIS for urban
environments in order to understand the territory at 3D, concerning especially form, components and texture. Coors (2003) in St-Aubin and Mustafavi (2010) stated that there is a strong need for a 3D GIS to manage 3D geometry and topology, integrating semantic information to analyse both spatial and topological relationships, and visualise the data in a suitable form. Therefore, it is not difficult to assume that 3D modelling will be gradually become more common, especially concerning hardware and software developments. However, the interoperability between 3D
and GIS systems is still difficult to perform, considering the multiplicity of formats (Valencia et
al., 2015).
The growing demand for the main integrated capabilities of 3D visualisation and GIS analytic capacity can be perceived, especially, in the confluence, convergence and congregation of the most important 3D and GIS development industries. This idea is especially visible in the most recent launching of GIS products aimed to offer a wide range of interoperability tools and solutions for their users, and for also being the most discussed topics in leading technological events.
Regarding 3D modelling and GIS (3D GIS), the user can acquire, manage and observe different data configurations, creating Virtual Environments (Virtual, Augmented and Mixed Reality), within which individuals can virtually walk, drive, fly and see the world in real, past or future time (Virtual Time Travel) and/or even communicate, meet and work (creating new forms of human interaction and locational settlements, reducing the needs of transportation, being represented in the virtual environment). 3D GIS representations can also be linked with attributes of a database, allowing, for example, to query the spatial data infrastructure and visualise the results also in a 3D form, or conducting spatial analysis, such as visibility analysis enabling a fully interactive 3D environment that allows users to navigate in the built VE. The integration of data acquisition, 3D modelling and 3D GIS data in an AR environment through mobile platforms provides the opportunity for DR, interaction and dissemination, enabling dynamic 3D contents to be built, visualized and interacted with, supporting attributes and spatial analytical features, being more powerful than traditional methods (Yin, 2010).
4. Virtual or Augmented 3D Heritage
Virtual or Augmented Heritage or 3D GIS Cultural Heritage are relatively new branches of knowledge that use information technology to digitally capture or represent the data studied by several domains. This data includes 3D objects such as works of art, buildings and even entire villages, cities or cultural landscapes. Whereas the cultural heritage community previously used static 2D forms of documentation (plans, sections, elevations, reconstructions) created on paper and published, it is now increasingly using 3D interactive digital tools, adding also the time dimension (4D). The transformation of the expression and publication of heritage representations may disclose that virtual heritage spread rapidly through a large, well-established field, which has generally embraced the new technologies in recognition of their obvious superiority to what they have replaced (Eve, 2012)
The technical-scientific advances of measuring the physical world and computer modelling capabilities, have led to the creation of an increasing number of high quality 3D models of existing cultural heritage objects and environments. These are often supplemented by additional metadata information, as well as synthetic reconstructions of missing data. This growing collection of models provides new opportunities for the academic community and the public alike. Heritage representations depend on efficient access, interoperability and scientific endorsement of the 3D models. A long-term objective, then, should be the creation of centralised, open repositories of cultural heritage virtual environments, with high technical-scientific value, underlying design documents and metadata, published along with the model. Uncertainties in the 3D data and hypotheses in the reconstructions must be clearly documented
and communicated to users. The creation of 3D cultural heritage archives also requires new solutions for interoperability of these models with each other in the archive, as well as with external sources. (Koller et al., 2009).
AR applications are currently being used at some heritage sites. These are mostly aimed at enriching the tourist experience, adding information to the real environment merged and over the device display (e.g. Virtual Time Travel) or through audio (e.g. museum audio guides). Nevertheless, on a daily basis new forms of DR are becoming available, consisting basically of 3D models (reconstitutions) used to explore the present, past or future experiences, or approach research questions. (Eve, 2012)
There are several methods to combine GIS and Virtual Reality (VR)/Mixed Reality (MR), even if it is still difficult to achieve full integration, considering technical limitations, which restrict the distribution and display of 3D representations on personal computers and mobile tools. However, hardware developments (especially graphic capabilities, related with rendering 3D models) along with the broadband networks, have created the conditions towards making it possible to advance in the field of 3D GIS and the consequential production of DR within VE/MR systems over the Internet, including portable devices (adapted from Zhang, 2004). Efforts have been made to model the built environment and planning scenarios using 3D GIS and VE/MR platforms to envision, for example, the protection of buildings, sites, urban settlements and landscapes (e.g. changing use), as well as to explore and understand the potential impacts and interplay between adjacent structures or adulterations (adapted from Bosselman, 1998; Kwartler and Bernard, 2001; Al-Kodmany, 2001; Arefi and Triantafillou, 2005; Steinicke et al., 2006 in Yin, 2010).
3D visualisation requires appropriate resources to visualise 3D spatial analysis as tools to effortlessly explore and navigate through large models in real time (Zlatanova et al., 2002 in Milosavljevic and Mostafavi, 2010). 3D GIS digital representations can provide information on heritage, which is extremely valuable for several agents in the territory (e.g. decision-opinion makers, technicians, public and promoters) in different domains (e.g. political-administrative, social-economic, technical-scientific and ideological-symbolic-religious). One example of that is the value added to planning at different scales in real-time (through web services/broadband networks) in their past, present and future (fourth dimension), producing unprecedented opportunities for communication and collaboration in different fields of knowledge. 4D GIS digital representations can be built to reflect the past, existing and possible future conditions of cultural heritage with the actual or proposed appearance, facade, style, material and size, applied to buildings, urban settlements, sites and landscapes (Yin, 2010).
DR bring the agents from different domains closer to a virtual/mixed/real site and (re)present, for example, the impacts/consequences of a heritage intervention, regarding for instance the relations between objects or use, function, proportion, texture, volume, light and colour of a proposed development from any perspective or navigation form that the stakeholder might select/decide.
According with Roussou and Drettakis (2003), “The area of virtual heritage has long been concentrated on generating digital reconstructions (…) to be truly accurate representations of their real-world counterparts”. For Le et al., 2005 “Recently, virtual heritage has emerged as a
promising technology for conservation, preservation, and interpretation of our culture and natural history”. According to Andrés and Pozuelo (2009) “Discrete and subjective techniques to acquire information led to other massive data acquisition techniques, including space and theme-related” in the article with the suggestive title “Evolution of the Architectural and Heritage Representation”. Those technologies reproduce faithfully the real world, going far beyond geometry or spatial position (Andrés and Pozuelo, 2009). Muñoz and Garcia-Almirall (2010) reproduced a virtual 3D model of Barcelona for the year 1714, creating a database with a wide variety of information from ancient cartographic plans, drawings and other documents up until the present. The Rome Reborn (Frischer, 2010) project uses 3D digital technology to represent the evolution from the late Bronze Age (~BC 1000) to the Middle Ages (~ 552 AC), with the peak of its development in 320 AC. The Rome Reborn project has several versions available through Google Earth software (without cost) and it has over 650 million polygons. The project PATRAC2 made for the Barcelona Museum developed a 3D model creation and incorporation of virtual and augmented reality to improve accessibility and user experience of a museum in a wheelchair (Marambio Castillo et al., 2010).
5. Trials of 3D modelling and visualisation in an Augmented Reality
environment
The present research regards: acquisition of information using terrestrial and UAV point cloud meshes; 3D Modelling; and their representation in an AR environment using mobile platforms. The application of this technology has different phases of implementation for the objects used, considering urban cultural heritage and spatial locations. The trials presented below are related to the theme of water distribution in Lisbon, more specifically the Águas Livres Aqueduct system.
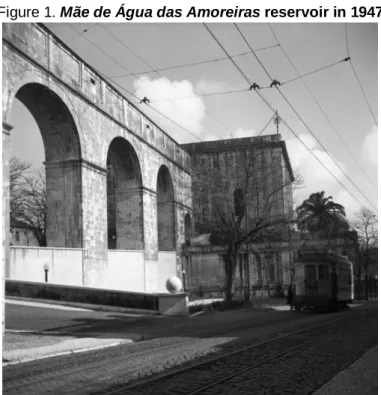
Figure 1. Mãe de Água das Amoreiras reservoir in 1947
This system which collected, transported, accumulated and distributed water by gravity (with a descent of ~3 mm per metre), comprises the general aqueduct (14 km), the subsidiary extensions, reservoirs, underground galleries and fountains, which in total extend a length of approximately 58 km. The highest point of the system is the “Águas Livres” main spring, located in the municipality of Sintra, at a height of ~172 metres, and the main reservoir, Mãe de Água (Fig. 1) is located in the centre of Lisbon, at a height of 94 metres. Works on the construction of this complex system commenced in the 18th Century (1731) and resisted the famous earthquake that destroyed a large part of the city (1755). The system was extended repeatedly throughout the 19th Century, until being totally deactivated in the 20th Century (in 1968)9.
Figure 2. Lisbon Aqueduct in Alcântara valley in 1912
Source: Arquivo Municipal de Lisboa, doc.PT/AMLSB/PAG/000402, 2015
The aqueduct was classified as a National Monument in 1910 and its most remarkable section is located in the Alcântara Valley (Fig. 2). It is also registered in the Guinness book of records as the largest ogive-formed stone arch in the world (65 m high and 29 m wide). This system was built to overcome the growing need for water at that time, especially in the occidental part of the city, contributing to the definition of the Lisbon’s urban morphology, although it has subsequently became insufficient to satisfy the city’s water demand.
5.1
3D modelling using available data, software and market apps
In view of the importance of the Águas Livres Aqueduct monument, research was undertaken for the elaboration of a mobile device App (Android) that enables the visualisation of GIS information and 3D modelling in the AR environment on site.
9
This project had several authors, such as: Architects - António Canevari (1730-1732); Carlos Mardel (1735); João Frederico Ludovice (1744); Reinaldo Manuel dos Santos (1770) / Engineers - Borges de Sousa (1905); Manuel da Maia (1730-1736) / Masons - Domingos da Silva Lobo (1731); José da Costa Negreiros (1731).
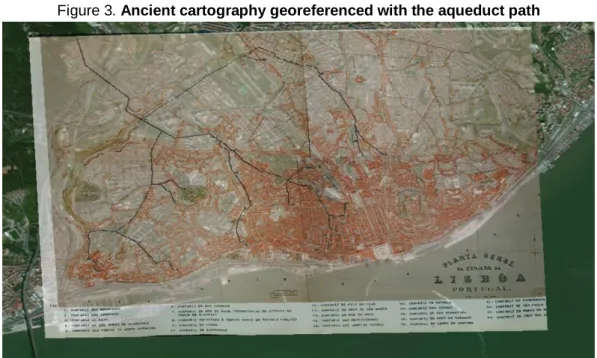
The first trial was conducted to develop a dataset (location) of segments and elements of the aqueduct system within GIS, consisting mainly of lines and dots (X, Y). The identification of the aqueduct system was obtained through several collections of ancient cartography10 (built mosaics) georeferenced using the ESRI ArcGIS 10.0 software (Fig. 3). The identification of the aqueduct system (path and elements) was vectored (lines and dots) having the support of ancient cartography and current satellite imagery (from ESRI Web Services and Google Earth Pro, as complementary data sources)11. Official institutional12 alphanumeric information about each aqueduct element and gallery was added to the final dataset (e.g. identification of the element, author, description, chronology and a link to an online institutional file).
Figure 3. Ancient cartography georeferenced with the aqueduct path
Source: image from the authors. Cartography: Planta Geral da Cidade de Lisboa (1868), Câmara Municipal de Lisboa.
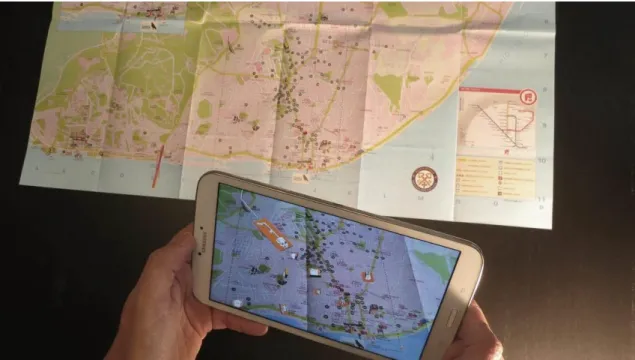
After integrating this dataset within the markets available for mobile apps (e.g. Google Play, IOS), individuals can use the device’s GPS/GLONASS, gyroscope/compass, acceleration sensors and camera, for the on-site visualisation of the elements of the aqueduct location, not only over ground but also underground (therefore not visible). This trial used the Locus Map App within the Android mobile operating system, revealing an enormous potential to recognise on-site the configuration of the very complex aqueduct structure, having dynamic information, such as the distance and azimuth or (when installed) the possibility to use a common navigation application (e.g. CoPilot, MeoDrive, NDrive, Sygic)
As with many other applications available on the market, it is possible to visualise the dataset in an online/offline map and with the availability of GNSS, identify one’s relative position to the
10
Such as: Planta Geral da Cidade de Lisboa (1868), CML; Planta Geral do Aqueduto das Água Livres (1856), SIPA; Carta Topográfica de Lisboa de Filipe Folque (1858), CML/SIPA.
11
With the support of the former team: Architectural Heritage Information System (SIPA) integrated in: Housing and Urban Rehabilitation Institute, nowadays: Directorate-General for Cultural Heritage.
12
elements on site. This trial was particularly relevant considering the use of the App’s augmented feature, especially because the main elements are located under the city and the system can be recognised while the user is walking over ground. Thus, the objects can be identified by visualizing the designation and location through the mobile device camera while walking (Fig. 4). Additionally the radius can be enlarged, adapting the amount of data displayed (in the area around the current position) and finally access to several relevant datasets associated to that element (including an internet link to additional institutional online information) by pressing the displayed identification dot.
Figure 4. Sequence of examples using GIS data in an Augmented Reality environment
(Janelas Verdes Fontain)
Source: images from the authors. 04-04-2015.
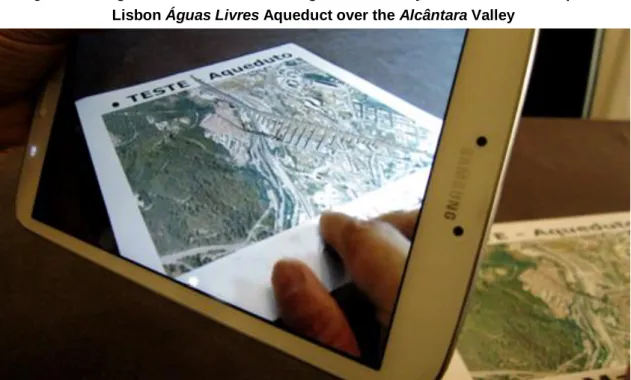
The second trial consisted of carrying out research for the existence of 3D models in the internet catalogues with a relevant LoD visualised in the Augment mobile App. The procedures involved the adaptation and conversion formats, compatible with the AR application to be used in the mobile device. Once imported, an AR marker (e.g. satellite imagery as in the example used in the Fig. 5) can be defined or visualised over a determinate chosen surface. However, in the case of not using AR markers, the visualisation in the field may be associated with real coordinates (a georeferenced 3D model) and eventually enabling the possibility to access more information about the object. This application is extremely useful, especially when the available data is of a high quality. It therefore, enables the visualisation of 3D models in an AR environment, allowing to augment the information in a 2D format regarding the advantages explained previously. However, this application can prove to be unsatisfactory, considering the general LoD of the 3D models available in the general catalogues.
Figure 5. Using a built 3D model in an Augmented Reality environment. Example of
Lisbon Águas Livres Aqueduct over the Alcântara Valley
Source: PT3D in 3D warehouse, Sketchup. 12-09-2014.
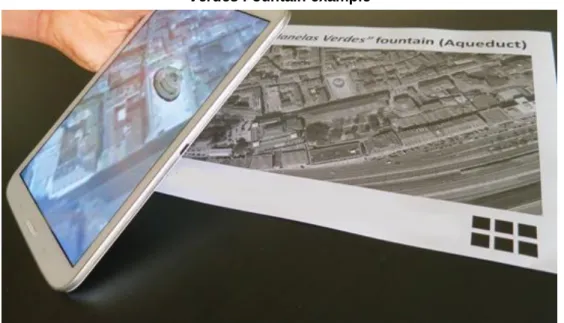
The creation of 3D models could be carried out with common software (e.g. 3D Studio Max, Blender, Sketchup or City Engine), with a high LoD and without losing performance while inserted in the augmented reality application. However, the use of a survey point cloud based on a collection of fieldwork photographs, revealed to be surprising, taking into account the rapid acquisition and processing, having the advantage of being authentic (Fig. 6 and 7).
Figure 6. 3D model generation (workflow process using the software Agisoft). Example of
Terras fountain through fieldwork image collection
Figure 7. Using a 3D developed model in an Augmented Reality environment. The Janelas
Verdes Fountain example
Source: images from the authors. 10-06-2015.
The Agisoft – Photoscan software is a smart automated processing system, allowing for the creation of rapid and authentic 3D models with the simple use of pictures (with a pre-determinate capturing method) carried out on field. The processing stages of the workflow, besides being very organised and intuitive for the user, allows for the adjustment of several specific tasks and adequate different types and sources of data (multiple scales, objects, environments and/or using different devices and techniques). The software generates 3D models extremely quickly, with regard to the procedures of inserting and aligning photos, and building dense clouds, meshes and textures (with a numerous variety of output formats). However, the technical challenge is to simplify these 3D models (with the elimination of faces for example) without losing the realism of urban elements.
5.2
Collecting data using UAV, 3D modelling and the integration of 3D GIS
production and mobile visualisation in an Augmented Reality environment
The Águas Lives aqueduct system has several elements that permit the collection of data by using simply terrestrial images (on site) and creating point cloud meshes, as shown in the examples referred in the previous section. Otherwise, considering the dimension and volume of objects such as “Mãe de Água das Amoreiras”13, it is very problematic to conduct a survey,
without using high or aerial platforms. In this way, the use of a UAV very much simplifies the assignment of collecting data and processing, although the data is authentic with an impressive LoD. However this survey required a number of preparation aspects (Fig. 8): gaining the authorised permits to use the object space, weather and safety circumstances, light conditions, radio frequency and signal interference tests, GPS and compass calibration, and flight path determination (considering flight height and surrounding objects).
13
Built between 1746 and 1834, by Carlos Mardel and Reinaldo dos Santos, the reservoir has a parallelepiped form measuring 37m x 33m, with a height of 17m.
Figure 8. UAV data acquisition in Mãe de Água Reservoir
Source: images from the authors. 11-09-2015.
To conduct the UAV survey, the following steps needed to be taken: data acquisition; data processing and model construction:
A) Flight plan parameters (height, overlapping, time, focal distance, camera data, spatial resolution) and collecting data survey (regarding preparation aspects such as safety, interferences and calibration);
B) Loading photos; inspecting loaded images and removing unnecessary images; C) Aligning photos;
D) Building dense point cloud;
E) Building mesh; 3D polygonal model; F) Texturing the 3D model;
G) Calculating DEM and DTM; H) Ortho image;
I) Exporting results.
In this trial, the 3D model did not stand out in the AR environment. Therefore a bright coloured 3D base (under or behind) was added, in order for the models to stand out, when associated with the AR marker (Fig. 9).
Figure 9. Mãe de Água Reservoir 3D model (UAV) and graphic improvement
Figure 10. Mãe de Água reservoir 3D model and AR environments using the city map as a
marker
Source: images from the authors. 17-10-2015.
The visualisation of 3D models in an AR environment can be achieved by recognising features of an image such as a city map which is free and available (Fig. 10 and 11).
Figure 11. 3D models (terrestrial, UAV) from the main structures elements of the Lisbon
Águas Livres Aqueduct
This procedure is carried out with the digitalisation of the city map and the definition of samples of image targets, which will then be detected by the AR software development kit14 allowing for the 3D objects rendering on top of it, by the recognition of key elements in the image target. This way, users are able to simply open the application (App), point the camera at the paper city map and visualise the 3D models that represent the different elements of the aqueduct system (e.g. main aqueduct, reservoirs and fountains) and access additional multimedia information related with each one of these elements (e.g. description, photos, historic cartography), as well as manipulate the 3D model (e.g. 3D rotation, zoom).
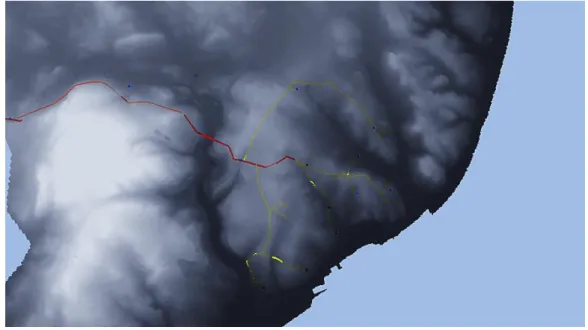
Besides the visualisation of the 3D models of the aqueduct elements, the importance of identifying the heritage corridor and its configuration led to the use of the dataset with the representation of the entire system path, identifying sections which are both over and underground, and the ones which can be visited. Therefore, AR techniques were also used to overlay the Lisbon Digital Terrain Model (DTM) on the city map (distributed freely in paper) to evaluate the earth surface and recognise the parts which were over (+) and under (-) the ground. The DTM was built using the contours (lines) and heights (dots) for the Lisbon municipality terrain dataset and the results can be viewed interactively using a fly through tool (3D Scene from ESRI ArcGIS 10 software). The general aqueduct was drawn in orange and the distributing galleries (mostly underground) in yellow. The reservoirs were represented with red squares and the fountains with circles, with different symbols to denote their actual condition: existing, demolished, moved or projected (and not built). Considering that the demonstration of this 3D scene has a higher impact when visualised in an interactive digital form (3D GIS software), to visualise this representation in a static image, the content was simplified showing the terrain surface (DTM) with 50% transparency, permitting to see the extent of the infrastructure and existing fountains (Fig. 12).
Figure 12. Detail of the 3D representation of the Lisbon Digital Terrain and the plan of the
Lisbon Águas Livres Aqueduct
Source: images from the authors. 17-10-2015.
14
This 3D Scene enables the users to have an impressive overview of the entire structure and better understand the aqueduct system throughout the city and the base terrain (permitting water distribution through gravity), and of pertinent associated information (e.g. author, description or chronology) and operating principles (e.g. elements that can or cannot be visited). This experience gives the user a faithful correspondence of the reality and in some cases, where the path or elements were interrupted or vanished (demolished or changed), provides them with a perspective from the past, understanding the complex linkages and transport/distribution of water in the 18th, 19th and 20th Centuries.
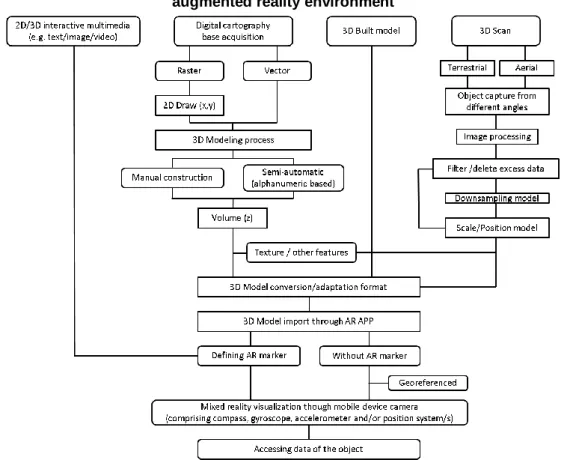
6. Synthesis of the Results
The Águas Livres Aqueduct System, deactivated for 50 years, is presently an important historical and cultural heritage landmark in Lisbon. The existence of this structure in the city is not obvious, especially because it is not visible (mostly underground), even if having contributed to define in part the evolution of the territory (with regard to water supply, but especially considering the impact of the implementation of the aqueduct system). The use of technology applied to cultural heritage has enormous advantages to better visualise and comprehend the importance of such elements, and recognise the connection between the structural elements (visible) and areas (known by its path). Figure 13 schematically synthesises the methodology, procedures and fluxes of data carried out for the trials developed and previously discussed.
Figure 13. Final approach to model and represent 3D models, and their visualisation in an
augmented reality environment
Based on digital cartography, in the case of the 2D vector, the volume associated with alphanumerical “z” values can been created (in the case of a building having, for example, the number of floors, the user can assign a medium height and multiply to calculate an estimation of the building’s volume), while on raster documents (e.g. satellite imagery or ancient cartography) the process requires 2D/3D drawing and eventually adding texture (e.g. building façades) or other features (e.g. audio or video). In the case of a built 3D model (e.g. internet catalogues), it may be necessary to convert or adapt to other formats, compatible with the AR application to be used in the mobile device. A 3D scan can be carried out using several techniques, geomatics, sensors and terrestrial or aerial platforms, taking into consideration scale and object availability. The UAV point cloud extraction by image-matching overlapped images produces rapid data acquisition and processing results. In view of the high LoD and the large amounts of data retrieved in the models produced, it is frequently necessary to filter and down sample to further improve the performance of the model, especially in mobile platforms (considering the graphics and processor capacity). The models produced required some adjustments regarding graphic correction, scale and positioning. Once the 3D model has been imported to the AR application, a marker can be defined (e.g. satellite imagery, ancient map or a touristic map, as in previously to examples) or visualised over a certain chosen surface. However, in the case of not using AR markers, the visualisation in the field may be associated with real coordinates (a georeferenced 3D model) and eventually enable the possibility to access more information about the object. The trials developed constitute some rehearsals to verify the potential of this technology as parts of an ongoing mobile application development. It is intended to integrate the most adequate solutions for the mobile application implementation and therefore reach an understanding of this technologies potential application for heritage valuation. It is planned to direct specific interviews to verify these assumptions not only to common users but also specialised technicians, opinion/decision makers, promoters and other stakeholders.
7. Discussion
The Geographic Information Technology advances are placing the world on a fast track to having knowledge of where all physical objects are located on the earth not only in present (and real) time, but also in the past or the future, especially regarding the interaction of web-based and mobile technologies (Sui and Goodchild, 2011).
The advantages of using 3D point cloud meshes and UAV systems consist of the ability to rapidly collect higher temporal and spatial resolution information, practically on demand (high frequency). In addition, the user can collect and process, very rapidly, authentic 3D data at a low cost, especially when compared with traditional methods. However, 3D scan technics cannot be applied to digitally recreate and represent past (disappeared) or future (planned) objects. The integration of 3D modelling with GIS permits the association between the high capacity of human perception and visualisation (3D) with the strong capability of spatial query and analysis of GIS. AR environments allow the user to combine the virtual data to the real world (in place), using mobile platforms. In this way they allow for a better understanding of the elements of visible and non-visible cultural heritage, not only in the present, but also in the past and future (re-present).
The DR of cultural heritage has implications, perhaps stimulating more travel (e.g. tourism) as a result of initial available interaction (thus potentially damaging the heritage) or maybe helping to collect information and contribute to better planning (Human as Sensors concept), management and coordination of human activities and conservation (in a 4D real-time monitoring and assessment situation). These emerging representations of the physical (regarding external affordances at different moments) and even the mental world (through internal minds or imagined/simulated/synthetized) are also creating the opportunities for the development of virtual and real environments (mixing DR with the real world), not only on desktop computers, but growing also to people’s daily using mobile devices (with the potential of being mobile and gradual increase in use).
Uncertainty remains to understand people’s overall perceived added value attributed to cultural heritage, through technology resources and digital representations. The interaction between the human/device/mixed environments can be applied for the majority of users. However, this interaction is dissimilar and inapplicable, presently, to all devices (regarding their characteristics) and should be available to everyone as part of the democratic access to technology and information. Nevertheless, technology is in a constant state of change and this means becoming reachable in a geometric progression. These are the main topics currently under debate within the principal scientific events, which allow for the prediction of a nearly revolutionary combination between the real and VE, especially applied to cultural heritage using projected holograms (Tenedório et al., 2014).
References
ANDRÉS, M. and POZUELO, F. Evolution of the architectural and heritage representation In: Journal Landscape and Urban Planning, Elsevier [Online] 2009. 105-112. [Date of consultation: January 2012] Available at: <http://linkinghub.elsevier.com/retrieve/pii/S0169204608002326>.
BERENDT, B.; BARKOWSKY, T.; FREKSA, C.; and KELTER, S. Spatial representation with
aspect maps. [online] Date of consultation: October 2012. In FRESKA C., HABEL C. and
WENDER K. F. eds. Spatial Cognition and Interdisciplinary Approach to Representing and Processing Spatial Knowledge. Berlin: Springer, 1998. 313-336. Available at: <http://linkinghub.elsevier.com/retrieve/pii/S0169204608002326> ISSN: 01692046.
DORE, C. and MURPHY M. Integration of HBIM and 3D GIS for Digital Heritage Modelling In: Virtual Systems and Multimedia (VSMM), 2012 18th International Conference [Online] Edinburg, Scotland, 2012. 22-23 [Date of consultation: October 2015] Available at: <http://ieeexplore.ieee.org/xpls/abs_all.jsp?arnumber=6365947>.
EVE, S. Augmenting Phenomenology: Using Augmented Reality to Aid Archaeological
Phenomenology in the Landscape. In: Journal of Archaeological Method and Theory. [Online]
July 2012. 19, 4 (6): 582-600. [Date of consultation: October 2015] Available at: <http://www.springerlink.com/index/10.1007/s10816-012-9142-7> Doi: 10.1007/s10816-012-9142-7.
FRISCHER, B. Beyond Illustration: 2nd and 3d Digital Technologies as Tools for Discovery in
Archaeology. Oxford [u.a.]: Archaeopress, 2008. 181 p.
GOLLEDGE, R.G. Spatial Behavoir: A Geographical Perspective. Guilford Press. 1997. 619 p. GOLLEDGE, R.G. Wayfinding Behavior: Cognitive Mapping and Other Spatial Processes. Baltimore: Johns Hopkins University Press, 1999. 428 p.
KHATRI, V.; RAM S. and SNODGRASS R.T. On Augmenting Database Design-support
Environments to Capture the Geo-spatio-temporal Data Semantics. In: Information Systems
[Online] 31 (2) 2006. pp. 98-13. [Date of consultation: January 2012] Available at: <http://www.sciencedirect.com/science/article/pii/S0306437904000961>
KOLLER, D.; FRISCHER B.; HUMPHREYS G. Research Challenges for Digital Archives of 3D
Cultural Heritage Models. In: Journal on Computing and Cultural Heritage [Online] 2009,
December 1: 1-17. [Date of consultation: January 2012] Available at: <http://portal.acm.org/citation.cfm?doid=1658346.1658347>. Doi:10.1145/1658346.1658347 LE, M.; KIM H. and KWON Y. 3D Modeling and Adaptation for Virtual Heritage System. In: Advances in Visual Computing. [online] Springer, 2005. 579-586. [Date of consultation: January 2012] Available at: <http://link.springer.com/chapter/10.1007/11595755_70>.
LYNCH, K. The Image of the City. MIT Press. 1960. 205 p.
NEX, F. and REMONDINO, F. UAV for 3D Mapping Applications: A Review. In: Applied Geomatics. [Online] 6, 2013: 1-15 [Date of consultation: October 2015] Available at: <http://dx.doi.org/10.1007/s12518-013-0120-x>.
PORTUGALI, J. Complex Artificail Environments, Simulation, Cognition and VR in the Study
and Planning of Cities. Springer-Verlag. 2010. Berlin.
ROUSSOU, M.; DRETTAKIS, G. Photorealism and Non-Photorealism in Virtual Heritage
Representation. In: First Eurographics Workshop on Graphics and Cultural Heritage [Online]
Brighton, United Kingdom, 2003. 10. Proceedings of the International Symposium on Virtual Reality, Archaeology and Cultural Heritage. [Date of consultation: July 2013] Available at: <https://hal.inria.fr/inria-00606745/document>.
MARAMBIO Castillo, A., CORSO Sarmiento, J. M., LUCENA Salas, J., & ROCA Cladera, J.
Nuevas Formas de Accesibilidad a través de Aplicaciones con Realidad Virtual y Aumentada en el Museo Marítimo de Barcelona: proyecto PATRAC. In: ACE: Architecture, City and
Environment [Online] June 2010, 5 (13): 145-160 [Date of consultation: July 2103] Available at: <http://upcommons.upc.edu/handle/2099/2081>
MUÑOZ, F. and GARCIA-ALMIRALL, P. Methodology to Reconstruct Virtual Cities From the
Past. In: ACE: Architecture, City and Environment [Online] June 2010, 5 (13): 223-236 [Date of
ST-AUBIN, M. MOSTAFAVI A. A 3d Collaborative Geospatial Augmented Reality System for
Urban Design and Planning Purposes. In: Canadian Geomatics Conference. [Online] 2010.
[Date of consultation: July 2013] Available at: <http://en.zl50.com/2012081117819666.html>.
SUI D. and GOODCHILD M. The convergence of GIS and social media: challenges for
GIScience. In: International Journal of Geographical Information Science. [Online] 2011. 25
(11): 1737-1748. [Date of consultation: July 2013] Available at: <http://www.geog.ucsb.edu/~good/papers/516.pdf>.
TENEDÓRIO, J. A.; REBELO, C.; ESTANQUEIRO, R.; HENRIQUES, C.; MARQUES, L.; GONÇALVES, J. A. Geographical Information Technologies in Urban and Spatial Planning:
Process: methods and tools. In: PINTO, N.; TENEDÓRIO, J.A.; ANTUNES, A.P.; ROCA, J., Eds. Technologies in Urban and Spatial Planning: Virtual Cities and Territories. Hershey/Pennsylvania, IGI Global, 2014. pp. 342. DOI: 10.4018/978-1-4666-4349-9.
VALENCIA, J.; MUÑOZ-NIETO A. and RODRÍGUEZ-GONZÁLVEZ , P. Virtual modeling for
cities of the future. State-of-the art and virtual modeling for cities of the future. State-of-the art an. In: ISPRS - International Archives of the Photogrammetry, Remote Sensing and Spatial
Information Sciences [Online] February, 2015. XL–5/W4. 18: 179-85. [Date of consultation: October 2015] Available at: < http://www.int-arch-photogramm-remote-sens-spatial-inf-sci.net/XL-5-W4/179/2015/> ISSN: 2194-9034.
YIN, L. Integrating 3D Visualization and GIS in Planning Education. In: Journal of Geography in
Higher Education [online] August 2010, 34 (3): 419-438. [Date of consultation: October 2015]
Available at: <http://www.tandfonline.com/doi/abs/10.1080/03098260903556030> DOI: 10.1080/03098260903556030.
ZHANG, X. Designing a Geographic Visual Information System (GVIS) to Support Participation
in Urban Planning. [online] Phd, University of Salford, UK. 2004. [Date of consultation: July