FACULDADE DE MOTRICIDADE HUMANA
Tiago Jorge Laires Fraga Morais de Pina
2017
Dissertação elaborada com vista à obtenção do Grau de Mestre em Treino Desportivo
Successful team synergies. A Social Network
Analysis on high performing soccer teams in
the UEFA Champions League.
Orientador: Professor Doutor Duarte Fernando da Rosa Belo Patronilho Araújo
Júri:
Presidente: Professor Doutor Francisco José Bessone Ferreira Alves
Vogais: Professor Doutor Duarte Fernando da Rosa Belo Patronilho de Araújo
Professor Doutor Ricardo Filipe Lima Duarte
Agradecimentos
Ao professor Duarte Araújo, pela orientação ímpar, por todos os ensinamentos, pela imensa sabedoria, dedicação e motivação, pela inspiração, pelo facto de não ter sido apenas orientador, mas sim mentor de todo o trabalho desenvolvido.
Ao professor Rui Lopes, professor auxiliar do Departamento de Ciências e Tecnologias da Informação do ISCTE - Instituto Universitário de Lisboa pela paciência para me ouvir, por tê-lo feito com tanta consideração e interesse, pelos sábios conselhos que tanto contribuíram para o desenvolvimento da investigação.
À Ana Paulo por toda a dedicação a esta investigação, pelo cuidado e minucioso olhar que colocou em todos os pormenores e pelas propostas metodológicas valiosas que em tanto melhoraram este estudo.
Ao José Pedro Silva pela disponibilidade que demonstrou para dar comigo os primeiros passos do estudo, pela paciência em me ouvir e me tirar todas as dúvidas, pela participação pronta sempre que precisei de conselhos.
Ao Micael Couceiro pelo interesse demonstrado no projecto, pela receptividade incrível, pelo árduo trabalho e pelos ensinamentos em novas abordagens que me passou e que muito valorizo para o presente e futuro.
Resumo
A interacção sinergética entre colegas de uma equipa de futebol tem propriedades susceptíveis de serem estudadas através da Social Network Analysis (SNA). A análise de redes formadas pelos passes de colegas de equipa tem demonstrado que o sucesso colectivo está correlacionado com alta densidade de rede e coeficientes de clustering, bem como com centralização de rede reduzida. Apesar disso é importante evitar uma simplificação excessiva no estudo deste fenómeno, nomeadamente a consideração por igual na obtenção das métricas de rede dos eventos que estão na origem quer da performance colectiva de sucesso quer de insucesso. No presente estudo, investigamos se a densidade, o coeficiente de clustering e a centralização das redes podem prever o sucesso ou o insucesso da performance de uma equipa no futebol. Analisámos 12 jogos do Grupo C da UEFA Champions League 2015/2016, utilizando registos públicos das transmissões de TV. Realizaram-se análises de notação para categorizar as sequências ofensivas como bem-sucedidas ou mal-sucedidas e para recolher os dados das redes de passe e subsequentes métricas. Utilizou-se um modelo de regressão logística hierárquica para prever o sucesso das sequências ofensivas a partir da densidade, do coeficiente de clustering e da centralização das redes, utilizando a variável total de passes como variável moderadora. Os resultados confirmaram o efeito independente das métricas de rede. A densidade, ao contrário do coeficiente de clustering e a centralização, foi um preditor significativo do sucesso das sequências ofensivas, tendo-se registado uma relação negativa entre densidade e sucesso de sequências ofensivas. Para além disso, densidades reduzidas foram associadas a um número superior de sequências ofensivas, embora maioritariamente mal-sucedidas. Por outro lado, altas densidades foram associadas a um número inferior de sequências ofensivas bem-sucedidas, mas também a um menor número total de sequências e de "perdas de posse de bola" sem que a equipa atacante tivesse conseguido entrar na zona de finalização. Uma análise individual por equipa indicou que a relação entre a performance da equipa e a densidade é dependente da equipa. A aplicação de SNA aos desempenhos de sucesso e insucesso, de forma independente, de uma equipa de futebol é importante para minimizar uma possível simplificação excessiva das sinergias efectivas de uma equipa.
Abstract
The synergistic interaction between teammates in soccer has properties that can be captured by Social Network Analysis (SNA). The analysis of networks formed by team players passing a ball in a match shows that team success is correlated with high network density and clustering coefficient, as well as with reduced network centralization. However, oversimplification needs to be avoided, as network metrics events associated with success should not be considered equally to those that are not. In the present study, we investigated whether network density, clustering coefficient and centralization can predict successful or unsuccessful team performance. We analyzed 12 games of the Group Stage of UEFA Champions League 2015/2016 Group C by using public records from TV broadcasts. Notational analyses were performed to categorize attacking sequences as successful or unsuccessful, and to collect data on the ball-passing networks. The network metrics were then computed. A hierarchical logistic-regression model was used to predict the successfulness of the offensive plays from network density, clustering coefficient and centralization, by using the number of total passes as a moderator variable. Results confirmed the independent effect of network metrics. Density, but not clustering coefficient or centralization, was a significant predictor of the successfulness of offensive plays. We found a negative relation between density and successfulness of offensive plays. However, reduced density was associated with a higher number of offensive plays, albeit mostly unsuccessful. Conversely, high density was associated with a lower number of successful offensive plays, but also with overall fewer offensive plays and “ball possession losses” before the attacking team entered the finishing zone. An individual team analysis indicated that a relationship between team performance and density is team dependent. Independent SNA of team performance is important to minimize the limitations of oversimplifying effective team synergies.
Contents
Agradecimentos ... ii
Resumo ... iii
Abstract ... iv
Contents ... v
List of Figures ... vi
List of Tables ... vii
Introduction ... 1
Team Sports Analysis Literature Review ... 1
Individual / collective indices and composed variables ... 2
Data Mining ... 6
Information Visualization ... 8
Visual Analytics ... 9
Match Analysis on Soccer Literature Review ... 9
Social Network Analysis in Soccer ... 10
Aim ... 12
Method ... 13
Sample ... 13
Procedures ... 13
Predictor Variables ... 15
Density ... 15
Clustering Coefficient ... 16
Centralization ... 17
Analysis ... 17
Results ... 18
Discussion ... 24
References ... 29
List of Figures
Figure 1. Longitudinal division of soccer field for definition of finishing zone. ... 21 Figure 2. Process of creation of adjacency matrices. ... 22 Figure 3. ROC curve of regression model of offensive plays’ successfulness ... 27 Figure 4. Frequencies of SOP and UOP cases according: density (A), clustering coefficient
(B) and centralization values (C). ... 28 Figure 5. Relation between values of mean predicted probability and density (A),
clustering coefficient (B) and centralization values (C), colored by frequencies. 28 Figure 6. Team-by-team relation between values of mean predicted probability and density
(A), clustering coefficient (B) and centralization values (C), colored by
frequencies. ... 29 Figure 7. Relation between total passes values and density (A), clustering coefficient (B)
and centralization values (C) for SOP and UOP cases. ... 30
List of Tables
Introduction
In today’s society it is widely recognized the importance of teams in many areas of our daily lives (Duch, Waitzman, & Amaral, 2010). The team, rather than the individual, has become the basic work unit in many activities and organizations (Balkundi & Harrison, 2006), and team sports are excellent examples revealing the importance of team dynamics for success (Duch et al., 2010).
A team is a group of individuals working cooperatively and in a coordinated way to achieve a common goal (Zaccaroa, Rittmana, & Marks, 2001). Team performance is more than the sum of the interdependent individual performances, as individuals strive to coordinate between different roles and tasks (Anderson & Franks, 2001). In team sports performance individual players in a successful team act as a coherent unit, thus creating a team synergy (Araújo & Davids, 2016).
Individual and collective behavior has been intensively studied in team sports performance analysis. The behavior of an individual player affects the team’s behavioral pattern (Vilar, Araújo, Davids, & Button, 2012), and conversely, teammates may influence the behavior of each individual player.
Team Sports Analysis Literature Review
The great diversity of existing techniques is, in our view, the consequence of three main aspects. The first is the way information is captured, with technological advance and increasing influence of engineering on issues such as the placement of sensors or the use of drones in the capture of images. Secondly, this kind of data allows innumerable possibilities of study, always guided by theories and approaches of sports science. Such studies resulted in the expression of the phenomena through several indices and composite variables linked to individual and collective performance. These methods and variables are described in the next sub-section (Individual / collective indices and composed variables). Finally, and more recently, the proliferation of contributions and interactions between this area of knowledge and others, such as biology or computational science, combined with the increasing ability to capture and store large amounts of data, has originated new methodologies and perspectives on how to compute and analyze team sport data (data mining, information visualization and visual analytics), This issue will be discussed in subsequent sub-sections.
Individual / collective indices and composed variables
According to Araújo et al. (2015), individual behavior in a team is constrained by several factors, such as the player’s position in the field (in relation to the other teammates and opponents), strategic and tactical intents, playing phases (i.e., attacking and defending), game rules, etc. This perspective is corroborated by Stein et al. (2017), for whom the restriction of movement by a pitch and rules, driven by the predetermined objective, and influenced by the movement of own and opposing team players, is a big challenge when team data is analyzed. Consequently there are several techniques for capturing individual behavior that meet spatial criteria. One of the earliest works was done by Grehaigne (1988), who defined the playing area of each player, by recording their positions in the field every 30 seconds, according to a previous subdivision of the field into 40 equal squares. This work was a predecessor of many studies, and the division of playing area has been reported as a useful first step for a diversity of methods in behavior analysis in sport. About this topic, Gudmundsson and Horton (2016), in a survey on spatio-temporal analysis on team-sports, highlighted the intensity matrices and dominant regions.
Jonsson, & Magnusson, 2002; Lucey, Bialkowski, Carr, Foote, & Matthews, 2012; Shortridge, Goldsberry, & Adams, 2014; Takuma, Yamamoto, & Yamazaki, 2014). However, the truth is that individual athletes' behavior is not subordinated to any symmetrical geometric logic, but rather to the relationships between players and their teammates, opponents, game objects (e.g. ball positioning) and game targets (e.g., goal, basket). Taking this into account, researchers have established spatial discretization from predefined assumptions of the players behavior, such as subdivisions into areas aligned with the penalty box in soccer (Camerino, Chaverri, Anguera, & Jonsson, 2012) or considering the relative position of the players to the three-point line and the basket, as well as the expert intuition about shooting in basketball (Goldsberry & Weiss, 2013; Maheswaran et al., 2014). Another approach regarding the subdivision of the playing area is the polarization of the playing area, assuming that the behavior of the athletes is similar in locations equidistant to the goal or basket (Maheswaran, Chang, Henehan, & Danesis, 2012; Reich, Hodges, Carlin, & Reich, 2006; Yue, Lucey, Carr, Bialkowski, & Matthews, 2014). All these spatial discretization techniques allow producing intensity matrices by counting events that occur in each region previously created. Maheswaran et al. (2014) studied the regions visited by the players by extracting the location points from the trajectories of the players, while Bialkowski, Lucey, Carr, Yue, and Matthews (2014) performed a similar investigation on soccer, registering passes and touches made by the players in each region. Other authors went beyond the discrete spatial distribution of players location during the match, and obtained matrices of intensity for the shots (Franks, Miller, Bornn, & Goldsberry, 2015; Goldsberry & Weiss, 2013; Maheswaran et al., 2012; Reich et al., 2006; Shortridge et al., 2014) and passes (Borrie et al., 2002; Camerino et al., 2012; Cervone, D'Amour, Bornn, & Goldsberry, 2014; Takuma et al., 2014) performed in each region.
(2014) compared the team-area (the smallest enclosing orthogonal box containing all the field players of the defending team) with the dominant region, during the two phases of the game: attack and defense. The dominant regions of successful attacks were thinner than those of unsuccessful attacks. It was concluded that the dominant region is closely linked to offensive performance, so it may be possible to evaluate the performance of a group of players using the dominant region. In this respect it is very important to refer the motion model developed by Taki and Hasegawa (2000), who attempted to overcome research limitations already reported by Gréhaigne, Bouthier, and David (1997), in particular as regarding the validity of the assumption that all space inside a Voronoi cell is reachable in a shorter time by its designated player. Gréhaigne et al. (1997) considered that in order to accurately define points in space where a player could arrive before anyone else, it would be important to take into account the position, speed, acceleration and movement direction of the players.
The collective coordination of a team has been captured by specific group-based measures, too. One of the most studied aspects is the team's center or centroid that is obtained by computing the mean lateral and longitudinal positional coordinates of each player in a team (Araújo, Silva, & Davids, 2015) and represents the relative positioning of both teams in forward-backward and side-to-side movement displacement. Frencken, Lemmink, Delleman and Visscher (2011) in a study of inter-team coordination in small-sided games observed that in many plays that ended in goal there was a cross between the centroid of the attacking team and the defending one. On the other hand Bartlett, Button, Robins, Dutt-Mazumder, and Kennedy (2012) have reported that in 11 versus 11 soccer a clear convergence of the centroids of the teams in the plays that resulted in goal was not observed. Thus, the relationship between the cross of team's centroids and the creation of goal opportunities remains to be confirmed. Still in the analysis of team's centroid, Clemente, Couceiro, Martins, Mendes, and Figueiredo (2013) considered the centroid of the team according to the distance of each player to the ball, in the attempt to determine its influence in the plays. The authors reported large lateral oscillations of the team's weighted centroids, which were interpreted as a result of the effort of the attacking teams to destabilize the opposing defensive organizations by varying the attack corridor.
Another dispersion measure that was reported by Moura, Martins, Anido, Barros, and Cunha (2012) is team spread, which is calculated as the square root of sums of the squares of the distances between all pairs of players not considering the goalkeeper. Authors observed a counter-phase relationship between expansion and contraction in defense, as well as greater dispersion values when teams were attacking.
The effective playing space, which in the study of Ueda et al. (2014) was compared to the dominant region in both phases of the game - offensive and defensive, provides information on how the teams are stretched across the field. This information has been used by the authors, in a similar way to the studies of the last two mentioned metrics, to differentiate the moments in which the teams have the possession of the ball from the moments in which it does not (Frencken & Lemink, 2008). However Bartlett et al. (2012) state that the relation between measures of team dispersion and the defensive and offensive phases of the game is uncertain.
Finally, as team behavior is a collective organization that emerges from the cooperation between teammates (Gréhaigne, Bouthier, & David, 1997; Peña & Touchette, 2012), the emergence of such collective behaviors can be assessed and understood through the measurement of key synergistic properties such as degeneracy, i.e., the structurally different components that perform a similar (but not necessarily identical) function in a given context (Araújo & Davids, 2016). The degeneracy of team behavior as a social relationship property can be captured by Social Network Analysis (SNA) (Grund, 2012; Peña & Touchette, 2012). SNA has been applied to soccer (Clemente, Martins, Couceiro, Mendes, & Figueiredo, 2014b), in particular to analyze ball-passing networks in a team. Later, in the section about SNA on soccer, this issue will be resumed.
Data Mining
a variety of data mining techniques used to analyze large and complex datasets, with possible application to team sports data (Gudmundsson & Horton, 2016; Stein et al., 2017). Clustering is the grouping of objects that are more similar to each other than to those in other clusters, regardless of the definition of similar that may be established. According to Gudmundsson and Horton (2016) it’s possible to apply one of the clustering algorithms created by Lee, Han, and Whang (2007) to identify common movement patterns of individual or groups. More specifically this technique has been used to find common behavioral patterns of individual players in soccer (Janetzko et al., 2014).
Another data mining technique is classification, which according to Fayyad et al. (1996) is the process of “learning a function that classifies a data item into one of several predefined classes”. This technique was successfully applied to detect dangerous situations in soccer, defined by the “shot on goal” criteria (Stein et al., 2015). Classifiers were firstly trained with several features that occurred shortly before the shot on goal and then they were applied on the data, which allowed to detect potentially dangerous situations, as well as periods where did not occur any shot on goal but whose feature values were similar to previously trained data.
Regression is used when one intends to estimate the relationship between dependent and independent variables. This relationship is expressed in a function that can predict, with greater or less accuracy, future observations. Lucey, Bialkowski, Monfort, Carr, and Matthews (2014) have studied the offensive performance in soccer, having proposed a model, based on logistic regression, to estimate the probability of shooting succeed. This model determined that factors such as the game phase in which the shot has occurred, the defender proximity to shooter, the interaction of surrounding players, the speed of play and the shot location have a relevant effect in determining the likelihood of a successful shot. In another example, studying defensive performance in basketball, more specifically rebounding, Maheswaran et al. (2014) used linear regression to compute metrics for player's hustle and conversion, two of the three components (positioning was the other one) of authors' decomposition of rebound. The results have reported that the top-ranked players in these metrics were those who were also considered by experts as the best performers.
more complex summarization techniques include, for example, clustering and the determination of centroids as representative elements of clusters, a technique widely used in team sports analysis and discussed earlier. Another relevant example is the work of Perin, Vuillemot, and Fekete (2013), which offers compact yet expressive standard visualizations of soccer phases.
Change and deviation detection and dependency modeling, respectively used in the detection of outliers and in the identification of significant relationships between variables, can also be interesting methods to team sport analysis. According to Stein et al. (2017) change and deviation detection can be used to identify players whose performance distinguishes, positively or negatively, from that of other players, while dependency modeling can be applied to identify events that occur in the condition of other relevant events take place, such as a goal scored or conceded.
Information Visualization
passing network, time line and sidebars for various detailed information, allowing multiple comparisons between players, teams and further examination of the phases of a game.
Visual Analytics
Visual analytics methods, characterized by their interdisciplinary, can combine several research areas such as data mining and visualization, among others, thus consisting on the combination of automated analysis techniques with interactive visualizations for an effective understanding, reasoning and decision making from the study of large and complex data sets (Keim et al., 2008). This integrative character of visual analytics allows researchers of different research areas, such as team sport, to contribute with their specific knowledge during the analysis process (data mining) to obtain immediate specialized visual feedback of the results (visualization) (Stein, 2017).
Match Analysis on Soccer Literature Review
The unique nature of soccer, with the constant flow of the ball and few scores, especially when compared with other sports, makes simple statistics such as the number of assists or scored goals being inadequate as collective or individual performance measures. Fortunately this situation has changed and in recent times, especially since the UEFA Euro Cup 2008, a number of unprecedented statistical information in soccer has been made available for analysis. Obtaining and publishing a significantly higher amount of statistical data allows a more detailed analysis of the phenomenon, as testifies the proliferation of match analysis applied to soccer in last decades (Peña & Touchette, 2012).
2011; Lago & Martín, 2007; Lago-Peñas & Dellal, 2010; Taylor, Mellalieu, James, & Shearer, 2008). For many years match analysis research has focused on kinematic analysis or notational analysis (Clemente, Martins, Kalamaras, Wong, & Mendes, 2015), enabling the general description of technical, tactical and physical variables as an attempt to quantify the activity of players.
Despite of the importance of descriptive and comparative research, by the beginning of this century one of the main critics in literature used to be the need to move beyond the description of behaviors and progress towards prediction of performance (Sarmento et al., 2014; Gréhaigne, Mahut, & Fernandez, 2001). Another frequently pointed research limitation has been the fact that studies were being done disregarding situational and interactional contexts in which such performances had happen (Sarmento et al., 2014). Subsequently, over the last few decades there has been increasing interest in identifying and classifying teams and their properties (Araújo, Silva, & Davids, 2015; Clemente, et al, 2015). Having this on mind some researchers on match analyses have tried to find associations of cause/effect in different interactional situations, having the aim to determine the most effective ways of playing. The relevance of this kind of studies is generally recognized, since match analysis has played a relevant role in improvement of sports (Clemente, Martins, Couceiro, Mendes, & Figueiredo, 2014) and has allowed the development of new methods to analyze the team’s behavior, in order to measure the tactical and collective performance (Duarte et al., 2012). Thus, research on match analysis has evolved from studies that considered athletes as independent and autonomous units to studies in which the main focus is the relationship between individuals in a given context (Lusher, Robins, & Kremer, 2010).
Social Network Analysis in Soccer
These studies demonstrated that some metrics are useful to characterize styles of play and cooperation among teammates (Cotta, Mora, Merelo-Molina, & Merelo, 2011), as well as the relation between individual actions and team tactical behavior (Passos et al., 2011). Centrality metrics have been used to identify the most influential tactical positions within a team. For example, by analyzing the in-degree and out-degree centrality of the Portugal national soccer team players, Mendes, Clemente and Martins (2015) found that during the FIFA World Cup 2014 the central midfielders were the key players in the attacking-building process. A similar study examining degree centrality and degree prestige of Switzerland national team players during the same competition showed that the key players receiving the ball were also the midfielders, suggesting this team has a style of play based on attacking building (Clemente, Martins, Kalamaras, Oliveira, Oliveira, & Mendes, 2015b). Thus, network metrics such as density, heterogeneity and centralization are effective for characterizing the cooperation between players (Clemente, Couceiro, Martins, & Mendes, 2015a). More recently it was compared the importance of each tactical position to build the offensive process of national teams participating in the 2014 FIFA World Cup. Similarly, it was found that central midfielders are the most influential players in attacking process of most teams. These results were obtained from an analysis of out-degree, in-degree, closeness and betweenness values of participating players on competition (Clemente, Martins, Wong, Kalamaras, & Mendes, 2015d). Finally, in a study by Duch, Waitzman and Amaral (2010) that characterized the performance of the players at UEFA Euro 2008, it was proposed a measure of individual and collective performance, flow centrality - "the betweenness centrality of the player with regard to the opponent's goal". It has been noted that the metric provides sensible results, in agreement with the subjective views of analysts and spectators.
Mendes, 2015c) revealed significant differences in density, total links and clustering coefficient between teams reaching different stages of the competition. These findings further demonstrate an association between higher density, total links and clustering coefficient with performance variables such as goals scored, overall shots, and shots on goal (Clemente et al., 2015c).
Aim
Method
Sample
The choice of the sample for the study was based on some important assumptions. Firstly it was a central concern that the collective processes express, as far as possible, the training stimuli. Taking this into account, this study deliberately focused on club-teams rather than on national teams because club-teams train and compete together for longer consecutive periods of time. We analyzed the 12 games of the Group Stage of the UEFA Champions League Group C of 2015/2016 season. The four teams analyzed were Club Atlético de Madrid (CAM); Football Club Astana - Астана Футбол клубы (FCA); Galatasaray Spor Kulübü (GSK) and Sport Lisboa e Benfica (SLB).
Procedures
Our analysis focused on collective offensive processes. Offensive play is a set of attacking actions performed by a team between recovering and losing ball possession. According to Garganta (1997) a team is in possession of the ball, and therefore in attacking process, when any of its players respect, at least, one of the following conditions: i) holds at least two consecutive contacts with ball, ii) performs a positive pass (allowing the maintenance of ball possession), and iii) performs a shot (finishing). We considered that a team is in possession of the ball when it performs a positive pass, i.e., it maintains ball possession after the pass.
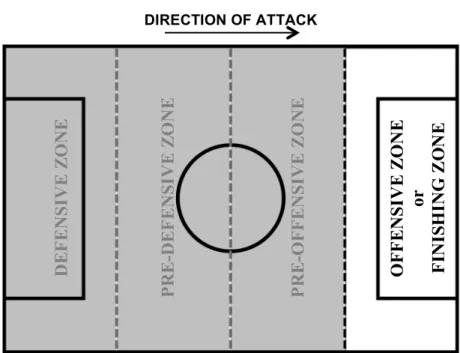
The video footage used in the analysis was obtained from TV broadcasters. We started by categorizing all offensive plays as successful when the attacking team entered the finishing zone, which was previously reported as a proxy variable for scored goals when measuring successfulness in soccer (Tenga, Ronglan, & Bahr , 2010). The concept of finishing zone was based on Gréhaigne et al’s longitudinal division of the soccer field into four equal areas (Gréhaigne et al., 2001). These areas are designated according to the direction of the attack as follows: defensive zone, pre-defensive zone, pre-offensive zone and offensive zone. The offensive zone in elite soccer was defined as the finishing zone (Lago, Lago, Rey, Casáis, & Domínguez, 2012) (see Figure 1).
Unsuccessful offensive plays (UOPs) were all the plays where the team lost ball possession without meeting either of the SOP criteria. Neutral plays were offensive plays where a team did not lose ball possession but also did not meet the SOP criteria. This neutral category included all offensive plays that were initiated: (i) from an offensive corner kick; (ii) in an offensive throw-in; and (iii) from offensive free kicks with a first pass directly into the finishing zone. The neutral offensive plays were not included in the present analysis.
The offensive plays were identified and categorized with Longomatch software from every pass performed in the 12 matches. The players who passed and received the ball were registered for each offensive play. A number from one to 11 was assigned to each player according to his initial position within the team’s tactical system. The same number was assigned to players performing the same tactical position. Taking into account their different stoppage times, each half of the match was divided into three fractions with the same duration. Next, two adjacency matrices of offensive plays (successful and unsuccessful) for each opposing team were created for the six periods of the match, in a total of 24 adjacency matrices per match (see Figure 2). Each of these adjacency matrices was then imported to the software NodeXL to compute the networks and their metrics. All statistical procedures were performed using SPSS Statistics 24.
DE F E NS IVE Z O NE PR E -DE F E NS IVE Z O NE PR E -OF F E N S IV E Z ON E OF F E N S IV E ZO N E or FI N IS H IN G Z O N E
DIRECTION OF ATTACK
Predictor Variables
Density
Density measures the interconnectedness of nodes (players) in a network (team), i.e. it is the ratio of existing ties (passes) between teammates relative to the possible number of such ties (Balkundi & Harrison, 2006). In ordered relations, as in the teammates interactions, the possible directed links in a digraph of n nodes are 𝑛 (𝑛 − 1). The graph’s density Δ is defined as the ratio between the total registered links (ℒ) and the maximum
number of possible connections. It is calculated as:
Δ=
ℒ
𝑛 (𝑛−1)
Match
Team 1
SOPs
Period 1 Adjacency Matrix
Period 2 Adjacency Matrix
Period 3 Adjacency Matrix
Period 4 Adjacency Matrix
Period 5 Adjacency Matrix
Period 6 Adjacency Matrix
UOPs
Team 2
SOPs
UOPs
1st Step
• Cut-off of
offensive plays of each team
2nd Step
• Categorization
of offensive plays
3rd Step
• Fragmentation
of match in six periods of similar duration
4th Step
• Passes Coding
• Creation of
adjacency matrices
Thus, density is a fraction with a minimum of 0 (no lines/arcs present) and a maximum of 1 (all lines/arcs are present) (Wasserman & Faust, 1994). Considering specifically soccer team passing networks, as analyzed in present study, values of density closer to 1 suggest a very intense relationship between teammates, with most players interacting with each other through passing. Such strong relationships increase mutual interdependence between teammates (Sparrowe, Linden, Wayne, & Kraimer, 2001), which promote cooperation and a coordination of efforts.
Clustering Coefficient
Clustering is a measure of the degree to which nodes in a network tend to cluster together (Peña & Touchette, 2012). The clustering coefficient, originally introduced by Watts & Strogatz (1998), quantifies how close a node and its neighbors in a graph are to becoming a complete subgraph.
In directed graphs, the local clustering coefficient of a vertex expresses the ratio of the links between the vertices that are connected to it. Thus, local clustering coefficient (𝐶!) of
a given vertex i is the fraction of the number of connections 𝑎!" between 𝑘! vertices in its
neighborhood, divided by the maximum number 𝑘! 𝑘!−1 of possible links between them:
𝐶! =
𝑎!",𝑎!" ∈𝐸
𝑘! 𝑘! −1
We used a variant of the clustering coefficient - the average local clustering coefficient - to measure the clustering level throughout the network:
𝐶 =1
𝑛 𝐶! !
Centralization
The centrality of a group or network is the degree of inequality of the distribution of positions/ "weights" of different elements within the network. A network is therefore more centralized when one of its elements is clearly more central than all other group members. Conversely, a network is decentralized when all its elements have the same value of centrality (Grund, 2012).
There are several measures of centrality and researchers do not always agree on how “group centrality” or “centralization” should be assessed. We used degree centrality for quantifying the relative influence of each player on the total number of passes within a network. Thus, centralization conveys how central the most central player is when compared to the other players in the network. This metric was originally described by Freeman (1978) and is calculated as the sum of the differences between the vertex with the highest degree centrality and all other vertexes; divided by a value depending only on the size of the network:
𝐶 ! =
deg 𝑣∗ −deg(𝑣)
!
!!!
𝑛!−3𝑛+2
where deg (𝑣∗) is the largest value of centrality degree in the network, deg (𝑣) is the value of each vertex centrality degree, and the denominator is the maximum possible sum of differences in i = 1 vertex centrality for a graph of n vertexes (Freeman, 1978).
In the context of a soccer match, zero centralization indicates that all players have the same level of interaction during the game. Conversely, a centralization value very close to one suggests that a player is the key-player of the team and that other players have a strong tendency to play with him (Clemente et al., 2015a).
Analysis
collinearity problems and outliers. Following the recommendations in Belsley et al. (1980), we diagnosed collinearity when conditioning indexes were greater than 30 for a given dimension and the variance proportions were greater than 0.5 for more than one variable. The latter was true for the pairs of variables “clustering coefficient and centralization” and “total passes and density”, however, both of these dimensions registered conditioning indexes below 30 (12.224 and 22.655, respectively). Thus, it was not necessary to transform or eliminate any predictor-variable. Next, we obtained z-scores and searched for outliers greater than 3.29 (Tabachnick & Fidell, 2013). A single outlier was identified (z-score = 4.378) and removed. Additionally, four SOP cases were removed because they registered “no passes”. After these preliminary procedures, 283 of the initial 288 cases were kept for further analysis, corresponding to 144 cases of UOP and 139 of SOP.
In a logistic regression, Exp (𝛽!) represents the odds-ratio of success versus failure (categories of the model’s dependent variable) when variable 𝑋! increases by one unit with
respect to the odds-ratio of success versus failure, when 𝑋! stays constant. Density, clustering coefficient and centralization vary between zero and one, therefore, we converted these metrics to a scale of zero to ten to adjust adequately model sensitivity. Consequently, the odds ratios presented for these variables refer to a unit change of 0.1.
Results
Characterizing the four potential predictors by team (see Table 1), it can be seen that the GSK and SLB teams are those that, in the four potentially predictor variables, are closer to the mean value. In a different way, we realize that both the CAM and FCA teams move away from these averages, each of which is the team that registers, for the four metrics, the highest and lowest values, respectively.
A two-block hierarchical logistic regression was used to predict the successfulness of offensive plays. In the first block, the total number of passes (hereafter referred to as ‘total passes’) was the only predictor-variable. This model performed significantly better than a constant-only model (𝐺
(!!,!!!"#) =7.484,𝑝 = 0.006), but it did not satisfy goodness-of-fit
second model performed better than a constant-only model (𝐺
(!!,!!!"#) =15.484,𝑝 =
0.004) and satisfied goodness-of-fit criteria (Hosmer and Lemeshow test: 𝜒(!!,!!!"#)=
7.187; p = 0.517), achieving a Nagelkerke r2 of 0.071. The first-block model correctly classified 56.2% of the known cases, 66.7% of the UOP cases, and 45.3% of the SOP cases. The second-block model correctly classified 69.5% of the UOP cases and 47.5% of the SOP cases, with an overall correct classification of 58.7% of the cases. Thus, adding the second block to the model increased the number of correct classifications by 2.5%.
Table 1. Characterization of offensive plays’ successfulness potential predictor variables.
Overall
n = 283
Team CAM
n = 70
FCA
n = 72
GSK
n = 69
SLB
n = 72 Total Passes 24,12 ± 15,16 30,10 ± 15,96 17,72 ± 11,37 24,46 ± 15,91 24,39 ± 14,73 Density 0,17 ± 0,09 0,20 ± 0,09 0,14 ± 0,08 0,18 ± 0,09 0,18 ± 0,08 Clustering
Coefficient 0,21 ± 0,14 0,25 ± 0,14 0,14 ± 0,12 0,21 ± 0,14 0,22 ± 0,12 Centralization 0,32 ± 0,10 0,35 ± 0,09 0,28 ± 0,10 0,32 ± 0,11 0,31 ± 0,09
Data are reported as mean ± SD.
Table 2. Binary Logistic Regression Model of offensive plays' successfulness.
𝛽 (S.E.) Wald p Exp
(𝛽) Exp (𝛽) 95% C.I Lower Upper Total Passes 0.079 (0.034) 5.475 0.019 1.082 1.013 1.156
Density -1.320 (0.591) 4.994 0.025 0.267 0.084 0.850
Clustering Coefficient 0.179 (0.193) 0.858 0.354 1.196 0.819 1.747 Centralization 0.189 (0.143) 1.759 0.185 1.208 0.914 1.597
Constant -0.615 (0.469) 1.719 0.190 0.541
Classification was unimpressive, with 69,5% of the UOP (specificity) and 47,5% of the SOP correctly predicted (sensibility), for an overall success rate of 58,7%. We tested the model's discriminant power (between UOP and SOP) with a ROC curve (see Figure 3), and its classification capacity was confirmed (ROC c = 0,609; p = 0,002; 95% CI [0.544, 0675]).
Total number of passes and density were the significant predictors among the four considered variables. The total number of passes was positively associated with the successfulness of offensive plays. A one-pass-increase augmented the probability of successful offensive plays by 8.2% (Exp (𝛽) = 1.082; see Table 2). More significantly, a 10% decrease in density increased the chances for a successful offensive play by 73.3% (Exp (𝛽) = 0.267; see Table 2).
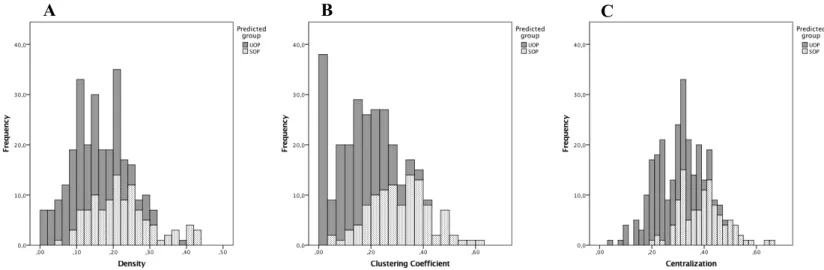
predicted probability of SOPs occurrence grows as offensive plays expressed higher clustering coefficients. Furthermore, it was observed that the centralization of UOPs varied between 0 and 0.45, with greater frequencies for values between 0.2 and 0.4. On the other hand, SOPs conveyed centralizations between 0.2 and 0.65, but mostly between 0.3 and 0.45. As verified for the other metrics, SOPs mean predicted probability accompanied the increasing centralization.
When we look at the results of the model team-by-team we found that the associations observed for the general data remained with respect to clustering coefficient coefficients and centralization. The same was not true in the case of density, since the SLB team presented a more erratic relationship, having registered for values of density higher than
A B C
Figure 5. Relation between values of mean predicted probability and density (A),
clustering coefficient (B) and centralization values (C), colored by frequencies.
A B C
Figure 4. Frequencies of SOP and UOP cases according to: density (A), clustering
0.25, some cases with mean predicted probability of SOPs occurrence either high or low (see Figure 6).
A
B
C
Figure 6. Team-by-team relation between values of mean predicted probability and
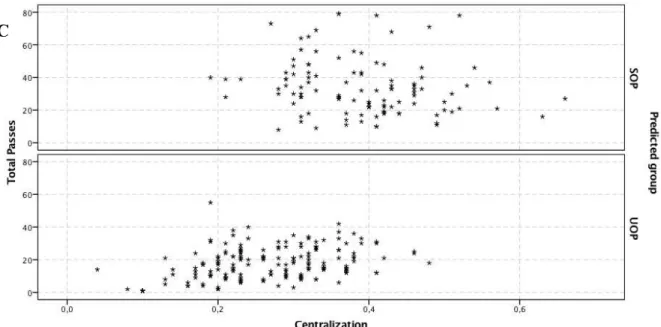
Regarding the relationship between the moderator variable, total passes, and the network metrics, there were some differences between SOPs and UOPs, considering all network metrics (see Figure 7). For density the relation seems similar until the value of 0.25 - as the density increases the number of passes also increases. While this is true also for values greater than 0.25, it’s important to note that offensive plays which combined high densities with high pass numbers were mostly SOPs. In addition, UOPs were characterized by having concomitantly expressed values of clustering coefficient and of total number of passes lower than SOPs, not having, for example, been verified any UOP with clustering coefficient equal or superior to 0.5 or a total number of passes equal to or greater than 60. This tendency for lower combinations between total number of passes and clustering coefficient seems to be maintained in case of centralization, with a great frequency of
A
UOPs for centralizations between 0 and 0.3 combined with total numbers of passes between 0 and 40. Otherwise SOPs registered higher centralizations (between 0.2 and 0.6) combined with also higher number of total passes (between 0 and 80).
Discussion
Network characteristics such as density, clustering coefficient and centralization have been reported as good descriptors of game style in soccer teams, as they can be associated with metrics of success such as goals scored, shots, shots on goal, and competition stage reached by teams. However, since network analysis describes events occurring during entire matches, performance outputs and network properties metrics cannot be measured simultaneously. In this study, we attempted to clarify the association between specific network properties and successful (or unsuccessful) team behavior.
Our model was able to classify 58.7% of the events correctly, however, it performed better at identifying UOPs (69.5%) than SOPs (47.5%). These results suggest that these network metrics (density, clustering coefficient and centralization) can more accurately describe the team behaviors associated with UOPs (i.e. losing ball possession) than the behaviors leading to SOPs (i.e. moving into the finishing zone or shooting on goal). Thus, the model C
can accurately pinpoint the collective behaviors that the teams should avoid in order to ensure success.
The total number of passes and density were the most relevant variables in our model. Total passes was introduced in the study as a moderator variable to assess the independent influence of the network metrics on team performance. The improvement in the model obtained by adding the second block confirmed the metrics’ independent influence. We observed a positive association between total passes and team performance. Each pass increment in a set of offensive plays occurring within a 15 minute-period resulted in the teams being 8.2 % more likely to move into the finishing zone or to shoot on goal. The density of a ball-passing network increases whenever two players who were not yet connected pass the ball between them; in this way, high density is probably associated to high occurrence of these differentiated links. This greater variability of pass patterns, which is expressed in qualitatively distinct connections over a given period, may occur for different reasons. For example, greater collective dynamics and high player mobility can result in passes between players who regularly play in distant areas.
example, these high-density values may result from longer ball-possession times, fewer ball possession losses, or specific losses in advanced zones of the field (finishing zone). This hypothesis is consistent with our observation that qualitatively differentiated links are associated with high densities, which likely reflects a greater unpredictability of passing patterns. Furthermore, it was previously proposed that greater variability of action and less exposure to the opponent could result from decentralized passing patterns (Gréhaigne et al., 1997). Such characteristics of offensive plays associated with high-density values contribute to an offensive process that creates goal-scoring opportunities and are more effective for maintaining ball possession in advanced areas. Interestingly, offensive plays with similar characteristics have been observed in successful teams at the FIFA World Cup 2014 (Clemente et al., 2015c).
When we analyse the results team by team, we confirm what several authors have already stated: teams that reach more advanced stages of competitions have higher average values of density (Clemente et al., 2015c). Thus CAM team, the first classified in the group and finalist of the competition, had the highest mean density (0,20 ± 0.09) and FCA team, fourth in the group, had the lowest value (0,14 ± 0.08).
the global values of density and the success of offensive plays, and seems to suggest that relation between density and successful performance isn’t independent of team effect. We found that the clustering coefficient is not a significant predictor of the successfulness of offensive plays, thus corroborating previous research (Gudmundsson & Horton, 2016; Peña & Touchette, 2012). However, our model indicates that a 10% increase in the clustering coefficient augments by 19.6% the probability of an SOP outcome (see also Clemente et al., 2015c). Furthermore, the association between high values of number of passes and clustering coefficient (see Figure 7) is in line with findings of Yamamoto (2009). High clustering coefficient values express the subgroup formation within the team itself; when these subgroups are created based on passes between teammates, as in the present study, the players performing in close areas tend to be linked together, thereby explaining the high clustering coefficients. This could reflect an offensive style choice based on short combinations between players, as previously observed for the Spain, Germany and Netherlands national teams at the FIFA World Cup 2010 (Cotta, Mora, Merelo-Molina, & Merelo, 2011; Peña & Touchette, 2012). Thus, the modest contribution of the clustering coefficient to the predictive value of our model suggests that different offensive styles may lead to successful team performance, depending, for example, on the players’ individual qualities or on different strategic options. Further investigation is needed to clarify this issue.
Our results demonstrate that centralization is not consistently associated with successfulness of offensive plays, which is in agreement with findings by Fewell, Armbruster, Ingraham, Petersen, and Waters (2012) showing that there is no strong relationship between centralization and team performance. However, we found a positive effect of centralization on successful team performance, as a 10% increase in centralization increases by 20.8 % the chances of an SOP. This result contradicts a previous report showing that higher centralization is associated with worse team performance (goals scored) (Grund, 2012). This discrepancy could, however, be explained by the different methodologies in these studies, as discriminating successful and unsuccessful performances probably influenced the relationship between centralization and successful team performance in our study.
associated with a higher overall number of offensive plays but which were mostly unsuccessful. Second, high density was associated with fewer and/or longer offensive plays, which reduces the possibilities of a team moving into the finishing zone (hence decreasing total SOPs), thus resulting in a negative association between density and SOPs. Finally, we considered that high density may also be associated with fewer ball-possession losses before the teams reach the finishing zone (hence increasing probability of SOPs), thereby supporting the density-performance hypothesis. Analyzing team-by-team it was found that relation between team performance and density seems to depend on style of play.
Some practical implications can be inferred from the present findings. Success of teams that express high densities in their offensive processes is eventually dependent on the creation of numerous lines of pass to the player with the ball. In light with ecological dynamics (Araújo, Davids, & Hristovski, 2006), this might be enhanced in the training sessions by manipulating task constraints, such as: i) using different relationships among depth / width of the field, to facilitate a team entering the finishing zone using different space channels; (ii) performing ball possession games with numerous mini-goals dispersed in the field, so that the player with the ball searches for 360° lines of pass; iii) performing games with varied ratios between the number of players and the area, to induce variability in the distance of the lines of pass and the type of passes required. On the other hand, for teams that express a lower density, some task constraints may be: i) establishment of a time limit for the performance of offensive plays, in order to enhance the entries in the finishing zones with fewer connections; ii) performing small-sided games with few players (1x1, 2x2, 3x3) to promote brief attacking actions with stable connections; iii) improving relationships between specific players, according to preferential links, by placing such players in the same team in small-sided games or in the training of specific collective actions among them.
References
Anderson, C., & Franks, N. R. (2001). Teams in animal societies. Behavioral Ecology, 12
(5), 534–540.
Araújo, D., & Davids, K. (2016). Team Synergies in Sport: Theory and Measures.
Frontiers in Psychology , 1449.
Araújo, D., Silva, P., & Davids, K. (2015). Capturing group tactical behaviors in expert team players. In J. Baker, & D. Farrow, Routledge Handbook of Sport Expertise (pp. 209-220). New York: Routledge.
Balkundi, P., & Harrison, D. A. (2006). Ties, leaders, and time in teams: strong inference about network structure's effects on team viability and performance. Academy of Management Journal , 49-68.
Barros, R. M., Misuta, M. S., Menezes, R. P., Figueroa, P. J., Moura, F. A., Cunha, S. A. et al. (2007). Analysis of the distances covered by first division Brazilian soccer players obtained with an automatic tracking method. Journal of Sports Science and Medicine , 6 (2), 233–242.
Bartlett, R., Button, C., Robins, M., Dutt-Mazumder, A., & Kennedy, G. (2012). Analysing Team Coordination Patterns from Player Movement Trajectories in Soccer: Methodological Considerations. International Journal of Performance Analysis in Sport, 12, 398-424.
Belsley, D. A., Kuh, E., & Welsch, R. E. (1980). Regression diagnostics: Identifying influential data and sources of collinearity. New York: Wiley.
Bialkowski, A., Lucey, P., Carr, G. K., Yue, Y., & Matthews, I. (2014). Win at home and draw away: automatic formation analysis highlighting the differences in home and away team behaviors. 8th Annual MIT Sloan Sports Analytics Conference, (pp. 1-7). Boston.
Bloomfield, J., Polman, R., & O'Donoghue, P. (2007). Physical demands of different positions in FA Premier League soccer. Journal of Sports Science and Medicine , 6
(1), 63–70.
Borrie, A., Jonsson, G. K., & Magnusson, M. S. (2002). Temporal pattern analysis and its applicability in sport: an explanation and exemplar data. Journal of Sports Sciences , 20, 845 - 852.
Bourbousson, J., Sève, C., & McGarry, T. (2010). Space-time coordination dynamics in basketball: Part 2. The interaction between the two teams. Journal of Sports Sciences
, 349-358.
Bradley, P. S., Di Mascio, M., Peart, D., Olsen, P., & Sheldon, B. (2010). High-intensity activity profiles of elite soccer players at different performance levels. Journal of Strength and Conditioning Research, 24 (9), 2343–2351.
Burt, R. S. (1997). The contingent value of social capital. Administrative Science Quarterly , 42, 339–365.
Camerino, O. F., Chaverri, J., Anguera, M. T., & Jonsson, G. K. (2012). Dynamics of the game in soccer: Detection of T-patterns. European Journal of Sport Science , 216 - 224.
Castellano, J., Blanco-Villaseñor, A., & Álvarez, D. (2011). Contextual variables and time-motion analysis in soccer. International Journal of Sports Medicine , 32 (6), 415– 421.
Cervone, D., D'Amour, A., Bornn, L., & Goldsberry, K. (2014). A Multiresolution Stochastic Process Model for Predicting Basketball Possession Outcomes. CoRR , 1-30.
Clemente, F. M., Couceiro, M. S., Martins, F. M., & Korgaokar, A. (2012). Automatic tools of match analysis: Inspecting soccer team’s dispersion. International Journal of Applied Sports Science, 24 (2), 81-88.
Clemente, F. M., Couceiro, M. S., Martins, F. M., & Mendes, R. S. (2015a). Using Network Metrics in Soccer: A Macro-Analysis. Journal of Human Kinetics , 123-134.
half of the match on ball possession. International Journal of Performance Analysis in Sport,, 13 (3), 678-689.
Clemente, F. M., Martins, F. M., & Mendes, R. (2014a). Applying networks and graph theory to match analysis: identifying the general properties of a graph. III Congreso Internacional de la Asociación Española de Ciencias del Deporte.
Clemente, F. M., Martins, F. M., Couceiro, M. S., Mendes, R. S., & Figueiredo, A. J. (2014b). A network approach to characterize the teammates’ interactions on football: A single match analysis. Cuadernos de Psicología del Deporte., 14 (3), 141-148. Clemente, F. M., Martins, F. M., Kalamaras, D., Oliveira, J., Oliveira, P., & Mendes, R. S.
(2015b). The social network analysis of Switzerland football team on FIFA World Cup 2014. Journal of Physical Education and Sport, 15 (1), 136-141.
Clemente, F. M., Martins, F. M., Kalamaras, D., Wong, D. P., & Mendes, R. S. (2015c). General network analysis of national soccer teams in FIFA World Cup 2014.
International Journal of Performance Analysis in Sport , 80-96.
Clemente, F. M., Martins, M. F., Wong, D. P., Kalamaras, D., & Mendes, R. S. (2015d). Midfielder as the prominent participant in the building attack: A network analysis of national teams in FIFA World Cup 2014. International Journal of Performance Analysis in Sport , 704-722.
Cotta, C., Mora, A. M., Merelo-Molina, C., & Merelo, J. J. (2011). FIFA World Cup 2010: A Network Analysis of the Champion Team Play.
Dellal, A., Chamari, K., Wong, D. P., Ahmaidi, S., Keller, D., Barros, R. et al. (2011). Comparison of physical and technical performance in European soccer match-play: FA Premier League and La Liga. European Journal of Sport Science, 11 (1), 51–59. Di Salvo, V., Baron, R., González-Haro, C., Gormasz, C., Pigozzi, F., & Bachl, N. (2010).
Sprinting analysis of elite soccer players during European Champions League and UEFA Cup matches. Journal of Sports Sciences, 28 (14), 1489–1494.
Di Salvo, V., Baron, R., Tschan, H., Calderon Montero, F. J., Bachl, N., & Pigozzi, F. (2007). Performance characteristics according to playing position in elite soccer.
International Journal of Sports Medicine, 28 ((3)), 222–227.
Duch, J., Waitzman, J. S., & Amaral, L. A. (2010). Quantifying the Performance of Individual Players in a Team Activity. PLoS ONE, 5 (6), 1-7.
Fayyad, U., Piatetsky-Shapiro, G., & Smyth, P. (1996). From Data Mining to Knowledge Discovery in Databases. AI Mag., 17 (37).
Fekete, J.-D., van Wijk, J. J., Stasko, J. T., & North, C. (2008). The Value of Information Visualization. In A. Kerren, T. J. Stasko, J.-D. Fekete, & C. Norh (Eds.), Information Visualization (pp. 1-18). New York: Springer.
Fewell, J. H., Armbruster, D., Ingraham, J., Petersen, A., & Waters, J. S. (2012). Basketball Teams as Strategic Networks. PLoS ONE, 7 (11), 1-9.
Fonseca, S., Milho, J., Travassos, B., & Araújo, D. (2012). Spatial dynamics of team sports exposed by Voronoi diagrams. Human Movement Science , 1652-1659.
Fortune, S. (1987). A Sweepline Algorithm for Voronoi Diagrams. Algorithmica , 153-174.
Franks, A., Miller, A., Bornn, L., & Goldsberry , K. (2015, March). Characterizing the spatial structure of defensive skill in professional basket- 36 ball. The Annals of Applied Statistics , pp. 94-121.
Freeman, L. C. (1978). Centrality in Social Networks Conceptual Clarification. Social Networks , 215-239.
Frencken, W., & Lemink, K. (2008). Team kinematics of small-sided soccer games: A systematic approach. In T. Reilly, & F. Korkusuz (Eds.), Science and Football VI: The Proceedings of the Sixth World Congress on Science and Football (pp. 188-193). Oxon: Routledge.
Frencken, W., Lemmink , K., Delleman, N., & Visscher, C. (2011). Oscillations of centroid position and surface area of soccer teams in small-sided games. European Journal of Sport Science, 11 (4), 215-223.
Fujimura, A., & Sugihara, K. (2005). Geometric Analysis and quantitative evaluation of sport teamwork. Systems and Computers in Japan , 49-58.
Goldsberry, K. (2012). CourtVision: New Visual and Spatial Analytics for the NBA. Proc. 6th Annual MIT Sloan Sports Analytics Conference. (pp. 1-7). Boston: MIT.
Goldsberry, K., & Weiss, E. (2013). The Dwight Effect: A New Ensemble of Interior Defense Analytics for the NBA. 7th Annual MIT Sloan Sports Analytics Conference, (pp. 1 - 11). Boston.
Gregson, W., Drust, B., Atkinson, G., & Di Salvo, V. (2010). Match-to-match variability of high-speed activities in Premier League soccer. International Journal of Sports Medicine, 31 (4), 237–242.
Gréhaigne, J. F. (1988). Game systems in soccer from the point of view of coverage of space. In T. Reilly, A. Lees, K. Davids, & J. W. Murphy (Eds.), Science and football
(pp. 316–321 ). London: E. & FN Spon .
Gréhaigne, J. F., Bouthier, D., & David, B. (1997). Dynamic-system analysis of opponent relationships in collective actions in soccer. Journal of Sports Sciences , 137-149. Gréhaigne, J. F., Mahut, B., & Fernandez, A. (2001). Qualitative observation tools to
analyse soccer. International Journal of Performance Analysis in Sport , 1 (1), 52-61.
Grund, T. U. (2012). Network structure and team performance: The case of English Premier League soccer teams . Social Networks , 1-9.
Gudmundsson, J., & Horton, M. (2016). Spatio-Temporal Analysis of Team Sports - A Survey.
Hughes, M., & Franks, I. ( 2005). Analysis of passing sequences, shots and goals in soccer.
Journal of Sports Sciences, 23(5), 509 – 514.
Janetzko, H., Sacha, D., Stein, M., Schreck, T., Keim, D. A., & Deussen, O. (2014). Feature-Driven Visual Analytics of Soccer Data. IEEE Symposium on Visual Analytics Science and Technology 2014 (pp. 13–22). Paris: IEEE.
Keim, D. A., Mansmann, F., Schneidewind, J., Thomas, J., & Ziegler, H. (2008). Visual analytics: Scope and challenges. In J. S. Simoff, M. H. Böhlen, & A. Mazeika (Eds.),
Visual data mining (pp. 76-90). Springer Berlin Heidelberg.
Fekete, & C. North (Eds.), Information visualization (pp. 154-175). Springer Berlin Heidelberg.
Lago, C., & Martín, R. (2007). Determinants of possession of the ball in soccer. Journal of Sports Sciences, 25 (9), 969–974.
Lago, J., Lago, C., Rey, E., Casáis, L., & Domínguez, E. (2012). El exito ofensivo en el fútbol de élite. Influencia de los modelos tácticos empleados y de las variables situacionales. European Journal of Human Movement , 145-170.
Lago-Ballesteros, J., & Lago-Peñas, C. (2010). Performance in team sports: Identifying the keys to success in soccer. Journal of Human Kinetics, 25, 85–91.
Lago-Peñas, C., & Dellal, A. (2010). Ball possession strategies in elite soccer according to the evolution of the match-score: The influence of situational variables. Journal of Human Kinetics, 25, 93–100.
Lee, J.-G., Han, J., & Whang, K.-Y. (2007). Trajectory clustering: A partition-and-group framework. 2007 ACM SIGMOD International Conference on Management of Data, (pp. 593-604). Beijing.
Lucey, P., Bialkowski, A., Carr, P., Foote, E., & Matthews, I. (2012). Characterizing Multi-Agent Team Behavior from Partial Team Tracings: Evidence from the English Premier League. (pp. 1-7). Toronto: AAAI Press.
Lucey, P., Bialkowski, A., Monfort, M., Carr, P., & Matthews, I. (2014). “Quality vs Quantity”: Improved Shot Prediction in Soccer using Strategic Features from Spatiotemporal Data. 8th Annual MIT Sloan Sports Analytics Conference (pp. 1-9). Boston: MIT.
Lusher, D., Robins, G., & Kremer, P. (2010). The Application of Social Network Analysis to Team Sports. Measurement in Physical Education and Exercise Science , 14 (4), 211-224.
Maheswaran, R., Chang, Y.-H., Henehan, A., & Danesis, S. (2012). Deconstructing the rebound with optical tracking data. 6th Annual MIT Sloan Sports Analytics Conference, (pp. 1 - 7). Boston.
Mendes, R. S., Clemente, F. M., & Martins, F. M. (2015). Network analysis of portuguese team on FIFA World Cup 2014. E-balonmano. com: Revista de Ciencias del Deporte , 11 (5), 225-226.
Molm, L. D. (1994). Dependence and Risk: Transforming the Structure of Social Exchange. Social Psychology Quarterly, 57 (3), 163-176.
Moura, F. A., Martins, L. B., Anido, R. d., Barros, R. M., & Cunha, S. A. (2012). Quantitative analysis of Brazilian football players' organisation on the pitch. Sports Biomechanics , 85-96.
Passos, P., Davids, K., Araújo, D., Paz, N., Minguéns, J., & Mendes, J. (2011). Networks as a novel tool for studying team ball sports as complex social systems. Journal of Science and Medicine in Sport , 170-176.
Peña, J. L., & Touchette, H. (2012). A network theory analysis of football strategies.
Sports Physics: Proc. 2012 Euromech Physics of Sports Conference (pp. 517-528). Palaiseau: C. Clanet (ed.).
Perin, C., Vuillemot, R., & Fekete, J.-D. (2013). SoccerStories: A Kick-off for Visual Soccer Analysis. IEEE TRANSACTIONS ON VISUALIZATION AND COMPUTER GRAPHICS, 19 (12), 2506–2515.
Pileggi, H., Stolper, C. D., Boyle, J. M., & Stasko, J. T. (2012). SnapShot: Visualization to Propel Ice Hockey Analytics. IEEE Transactions on Visualization and Computer Graphics., 18 (12), 2819-2828.
Rampinini, E., Coutts, A. J., Castagna, C., Sassi, R., & Impellizzeri, F. M. (2007). Variation in top level soccer match performance. International Journal of Sports Medicine, 28 (12), 1018–1024.
Reich, B. J., Hodges, J. S., Carlin, B. P., & Reich, A. M. (2006). A Spatial Analysis of Basketball Shot Chart Data. The American Statistician , 3-12.
Sarmento, H., Marcelino, R., Anguera, M. T., Campaniço, J., Matos, N., & Leitão, J. C. (2014). Match analysis in football: a systematic review. Journal of Sports Sciences . Shortridge, A., Goldsberry, K., & Adams, M. (2014). Creating space to shoot: quantifying