278 Aline Hernandez Kath et al.
Velocidade de reação e efeito residual da cinza de casca
de arroz nos parâmetros de acidez do solo
A cinza de casca de arroz apresenta como uma de suas principais utilizações a incorporação na agricultura, com potencial para substituir a calagem e fornecer cálcio e potássio. Entretanto seu efeito residual no solo ainda é desconhe-cido. Este trabalho teve como objetivo avaliar a velocidade de reação e o efeito residual da cinza de casca de arroz nos parâmetros de acidez do solo. Para tal, foi realizado um experimento de campo constituído por cinco tratamentos: quatro doses de cinza de casca de arroz 0, 30, 60 e 120 t ha-1 e um tratamento com adubação e calagem recomendada (calcário
dolomítico para atingir pH 6, 150 kg ha-1 P
2O5 como superfosfato simples e 80 kg ha -1 K
2O como cloreto de potássio) onde
foram realizadas cinco amostragens de solo, nas camadas de 0.00-0.10 m e 0.10-0.20 m, aos 15, 211, 400, 517 e 804 dias após a incorporação da cinza. Os atributos químicos analisados foram: pH em água, porcentagem de saturação de bases, teores de cátions trocáveis (Ca, Mg, K e Na) e capacidade de troca de cátions (CTC) a pH 7. Os resultados indicaram que, a velocidade de reação da CCA é muito rápida quando comparada ao calcário. Quanto maior for a dose de cinza de casca de arroz aplicada ao solo, maior é o efeito residual no pH. E, como corretivo de acidez, o efeito residual da cinza de casca de arroz resume-se ao tempo necessário para ocorrer o processo natural de reacidificação e lixiviação dos cátions básicos, cerca de 33 meses para solos e condições climáticas similares ao deste trabalho.
Palavras-chave: resíduo; fertilidade; tempo; agricultura.
ABSTRACT
RESUMO
Reaction rate and residual effect of rice husk ash
in soil acidity parameters
1The rice husk ash has been applied in agricultural land, with potential of replace limestone and, supply phosphorus and potassium. However, its residual effect in soil is still unknown. This investigation aimed to evaluate the reaction rate and residual effect of rice husk ash in soils acidity parameters. A field experiment was conducted with five treatments: four rice husk ash dosages 0, 30, 60 and 120 t ha-1 and one treatment with recommended soil lime and fertilizer (dolomitic
limestone to reach pH 6, 150 kg ha-1 P
2O5 as single superphosphate and 80 kg ha -1 K
2O as potassium chloride) where five
soil samples. Soil samples were collected in the layers 0.00 – 0.10 m and 0.10 – 0.20 m at 15, 211, 400, 517 and 804 days after ash incorporation. Chemical attributes were determined: soil pH (pH), soil base, exchangeable cation values (Ca, Mg, K and Na) and cation exchange capacity (CEC) at pH 7. Results showed that reaction rate of rice husk ash is faster when compared to liming. As greater was rice husk ash dosage applied in soil, higher is the residual effect in pH. As corrective of soil acidity, the residual effect of rice husk ash is just the required time to occur the natural process of reacidification and leaching of basic cations, about 33 months for soils and weather conditions similar to this work.
Keywords: waste; fertility; time; agriculture.
Aline Hernandez Kath2*, Gláucia Oliveira Islabão3, Ledemar Carlos Vahl2, Juliana Brito da Silva Teixeira2
10.1590/0034-737X201865030008
licence Creative Commons
Submitted on November 18th, 2016 and accepted on May 14th, 2018.
1 This work is part of the first author Master’s thesis.
2 Universidade Federal de Pelotas, Departamento de Solos, Capão do Leão, Rio Grande do Sul, Brazil. [email protected]; [email protected]; [email protected] 3 Instituto Federal de Farroupilha, Departamento de Química, Alegrete, Rio Grande do Sul, Brazil.
INTRODUCTION
Rice husk ash (RHA) is a by-product from the burning of rice husk to energy production. It is an alkali product and serves as corrective of soil acidity. Islabão et al. (2014) evaluated the RHA quality as corrective of soil acidity and concluded that it has a very low neutralizing value (around 1%). Although it reacts much faster than conventional limestone, it has a low effective calcium carbonate equivalent (around 3%). Nevertheless, as the doses used for farmers in their small farms are about dozens of tons per hectare, the use of this residue may replace limestone with the advantage of also supplying phosphorus and potassium (Islabão, 2013).
The liming action time to correct soil acidity is long and reapplication criteria are well established. The limestone residual effect is equivalent to the time period in which acidity and toxic aluminum are controlled (Novais & Mello, 2007). About ashes this issue is unknown but has fundamental importance for its use as liming replacement.
According to Natale & Coutinho (1994), residual effect depends on several factors: liming, dosage requirement, type of soil, fertilization, cropping system, among others. However, an important factor is the limestone reactivity: a higher reactivity results in a lower residual effect, this is, the faster the limestone action, the shorter the time of its effects and vice versa.
The loss of effects in the soil over time - as happens with the limestone - are due to reacting with acidic substances, combined with the loss due to erosion, leaching and removal by crops (Cruz, 1977) probably also occurs with the RHA.
The qualitative composition of the bases present in RHA is unknown but it may be similar to other ashes from plant biomass. According to Demeyer et al. (2001) several studies have shown that wood ash reacts in soil faster than limestone, resulting in a greater pH increases. However in a short period of time hydroxides and K and Na carbonates, which are more soluble and, do not persist in the soil for a long time. Agricultural limestone solubilization is slow, once it is composed by Ca and Mg carbonates which have low solubility. In addition, the common limestones have particles in enough size to be solubilized on long-term, which increases the residual effect (Raij, 2011).
The objectives of this study were to evaluate the reaction rate and residual effect of rice husk ash in soil acidity parameters from a Typic Hapludult.
MATERIAL AND METHODS
It was carried out a field experiment at the Agricultural Center of Palma, Universidade Federal de Pelotas (UFPel),
of the town of Capão do Leão – Rio Grande do Sul/RS (coordinates E357.860 N6.480.490; UTM zone 22; datum WGS84). The soil of the experimental is a Typic Hapludult (Severo, 1999) with a sandy loam texture.
The RHA dosages were equivalent to 0, 30, 60 and 120 t ha-1 and an additional treatment followed the
recommen-dation of the Comissão de Química e Fertilidade do Solo – CQFSRS/SC (2004) (recommended fertilization – RF) from work of Islabão et al. (2014). The RHA composition is on Table 2.
Both RHA and RF were incorporated into the surface layer (0.00-0.10 m) with a rotary tiller. The experimental plots had 6 x 4 m and were arranged in a randomized block design with four replications. The ash produced through combustion of rice husk in a fluidized bed combustor was provided by a company from Pelotas – RS, Brazil. Fluidized bed technology is capable of producing amorphous rice husk ash with very low carbon content in a very rapid reaction time (Angel et al., 2009). The RF consisted of lime requirement to reach pH 6.0. The calculated dose (SMP method) for each block were 0; 0.8; 1.1 and 2.7 t ha-1 of dolomitic limestone with ECC = 76.2%.
A dose of 150 kg ha-1 P
2O5 as single superphosphate and
80 kg ha-1 K
2O as potassium chloride were applied in the
RF treatment.
Two crops (black oat and common beans) were sown in April and November 2010, respectively. The vegetable residue from crops was kept as soil cover after the harvest and, after common bean crop, the area was revegetated with native grassland.
The five soil samples were collected on the following dates: 1ª) 15 days after application (daa) of RHA; 30/04/ 2010; 2ª) 211 daa: 12/11/2010; 3ª) 400 daa: 20/05/2011; 4ª) 517 daa: 14/09/2011 and 5ª) 804 daa: 27/06/2012.
The collects were made in two independent samples in each layer (0.00- 0.10 m and 0.10-0.20 m). Each sample consisted of six sub-samples per plot collected with a soil column cylinder auger. The samples were dried at 60 °C to constant weight, loosened by hand with a clod breaker and sieved (< 2 mm).
The chemical and physical characterization of the soil (Table 1) was performed at laboratory of Soil Science Department/UFPel. Calcium (Ca), Magnesium (Mg), Potassium (K), Sodium (Na) and pHH2O were determined through analytical methods described by Tedesco et al. (1995). The cation exchange capacity (CEC) at pH 7 and percent base saturation (BS) were calculated from the analyzed variables.
A Two Way ANOVA Repeated Measures analysis of variance was performed to analyze the data of soil chemical properties because it allows evaluating the variables effects as well as the interaction between them. It were also run a regression analysis between variables and time whose significance was evaluated by F test. Both analyzes were made using the computer program SigmaPlot® (2008).
From adjusted equations through regression analysis were calculated total time (tt) and half-life (t1/2) of treatment effects in chemical attributes.
RESULTS AND DISCUSSION
Since the focus of this work are the residual effect and reaction rate of RHA, emphasis was given in time effect on soil attributes. In attributes affected by treatments, the effects were more accented in layer 0.00-0.10 m, where RHA was incorporated, but also occurred in layer 0.10-0.20 m. In all variables studied, analyzes of time effects in each layer individually not added any improvement in the interpretation with regard to average data from two layers
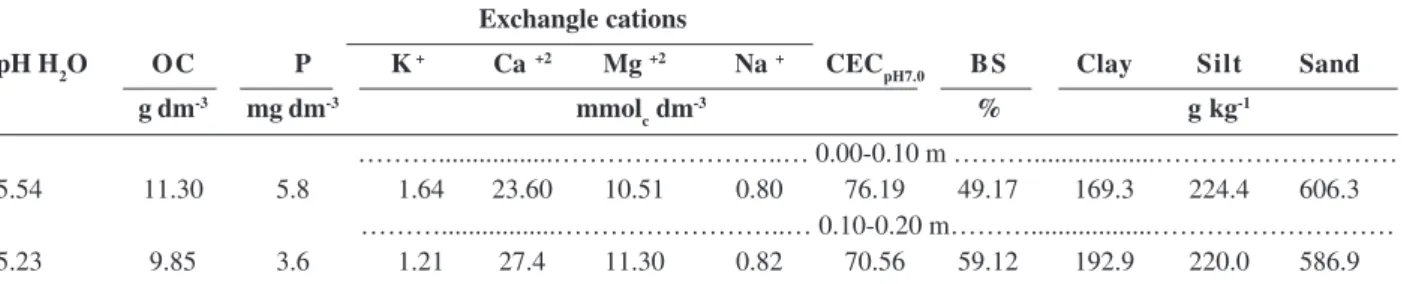
Table 1: Chemical properties and particle size of experiment soil in the layers 0.00-0.10 m and 0.10-0.20 m
Exchangle cations
pH H2O OC P K + Ca +2 Mg +2 Na + CEC
pH7.0 B S Clay Silt Sand
g dm-3 mg dm-3 mmol
c dm
-3 % g kg-1
………...………..… 0.00-0.10 m ………...………
5.54 11.30 5.8 1.64 23.60 10.51 0.80 76.19 49.17 169.3 224.4 606.3
………...………..… 0.10-0.20 m………...………
5.23 9.85 3.6 1.21 27.4 11.30 0.82 70.56 59.12 192.9 220.0 586.9
OC = organic carbon, BS = percent base saturation; CECpH7.0 = CEC at a pH 7.0
Source: Adapted of Islabão et al. (2014)
Figure 1: Monthly (bar) and accumulated (dotted) rainfall in the experimental period of 15/04/2010 to 27/06/2012.
Table 2: Chemical composition of the rice husk ash used in the experiment
NV S i K Na Ca Mg Al
% g kg-1
8.6 0.91 410.5 11.35 6.83 6.02 4.2 0.23
C N P S Cu Fe Mn Zn
g kg-1 mg kg-1
72.3 0.98 2.64 3.52 7.5 480 1278 34
NV= Neutralizing value
representing the superficial soil layer 0.00-0.20 m. Then it was decided to develop the whole interpretation with su-perficial layer data (0.00-0.20 m).
The effects of dose and time after RHA application in the soil exchangeable bases contents (Ca, Mg, K and Na) were statistically significant at the probability level of 0.1% or less, except for the effect of dose in Ca, which was significant at 6.2% (Table 3). The interaction between dose and time was significant to the monovalent cations (K and Na), but not to the divalent cations (Ca and Mg). This means that variations in K and Na contents with the time depended on the dose of RHA applied, but the variations of Ca and Mg with the time did not depend on the dose of RHA.
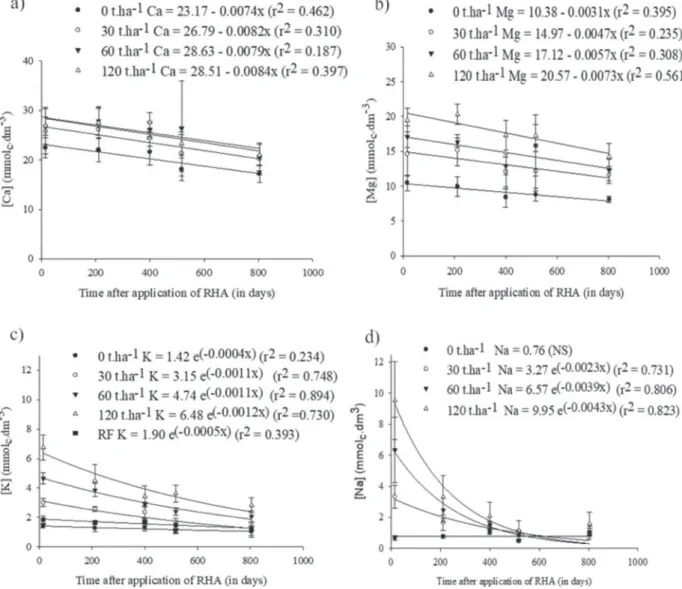
As soon as RHA was applied, contents of Ca, Mg, K and Na increased and then, decreased with the time in all doses, including zero dose, except for Na that it remained stable over time in the treatment without RHA (Figure 2). Both the initial increase with RHA application and the reduction model over time dependent on each cation. The increases in cations contents, with RHA application in the beginning of the experiment were presented and discussed by Islabão (2013). However, it should be noted the variation in the magnitude of these increases among cations, as can be seen at the data corresponding to sampling done at 15 daa in Figure 2. Comparing the extreme RHA applications, zero and 120 t ha-1, Ca increased about 20%; Mg contents
doubled, K contents quadrupled and Na increased 16 ti-mes with this treatment.
To evaluate the time effect, regression analysis was used between each cation content and time after applying within each RHA dose, even in cases where the dose x time interaction was not significant, as a matter of uniformity in data processing. Decreasing in levels with the time was linear to divalent cations, Ca and Mg, and exponential to monovalent cations, K and Na (Figure 2).
The contents of exchangeable Ca tended to remain stable during the first three sampling times (until 400 days) and decreased sharply in the last two samplings, in all RHA applications (Figure 2a). Despite this, the linear regression adjustment between Ca contents and the time was significant. Decreased Ca rates with the time (slope of the fitted straight) varied very little between treatments
(0.00739 mmolc dm-3 day-1 at the zero RHA treatment to
0.00836 mmolc dm-3 day-1 at the 120 t ha-1 RHA treatment).
As there was not significant interaction between time and RHA application (Table 3), these differences in slope of straight between the RHA treatments were not large enough to be statistically significant.
Magnesium behavior was similar to Ca. Its content has declined linearly with the time in all RHA doses. Although dose x time interaction also has not been statistically significant, the decrease of Mg content with time (slope of the fitted straight) varies more consistently with RHA application. The Mg content decreases faster with the time in highest RHA applications, varying the rate of decrease of 0.00313 mmolc dm-3 day-1 at the zero
RHA treatment to 0.00732 mmolc dm-3 day-1 at the 120 t ha -1 RHA treatment (Figure 2b). Similarly to the Ca, these
variations in the rate of decrease in the Mg contents between RHA applications were not large enough to reach statistical significance.
The contents of exchangeable K and Na have declined exponentially with the time but the curvature equations was sharper at Na than K and in higher RHA than lower dose for both cations. (Figure 2c and 2d).
In principle, the process responsible for decreasing contents of exchangeable cations with time, was leaching to deeper soil layers (beyond 0.20 m). During the experiment period (804 days) the rainfall was relatively uniform, and their accumulation almost linear with the time (Figure 1). The exception were the first days after application of RHA, in which occurred heavy rain (55.5 mm between the third and the fifth day after application of RHA), probably causing high leaching of Na, already checked in the first sampling at 15 daa, as discussed by Islabão (2013).
The comparison between cations in terms of losses model and magnitude versus time can be more appropriately performed using the relative contents of each cation in relation to initial content of each one. Figure 3 shows the relative contents of the four cations versus time relative to 120 t ha-1 RHA treatment
according to adjusted equations in Figure 2. It is clear that the magnitude of relative loss with the time occurs in the order: Na > K > Mg > Ca. This is the reverse order
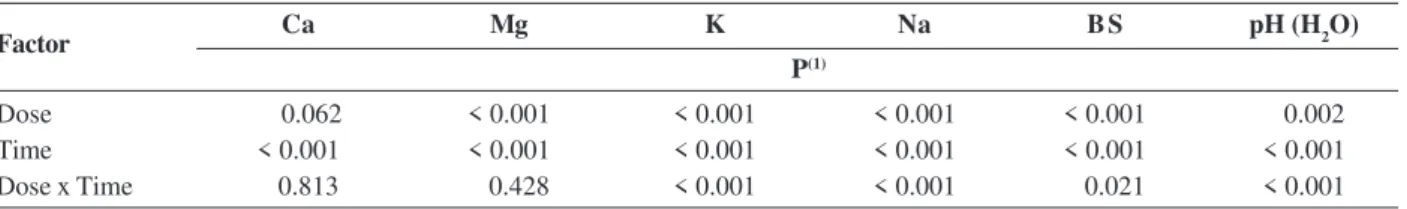
Table 3: Significance levels obtained from analysis of variance to repeated measures (Two-Way Repeated Measures ANOVA) of
exchangeable basic cations Ca, Mg, K and Na, percent base saturation (BS) and pH
Ca Mg K Na B S pH (H2O)
P(1)
Dose 0.062 < 0.001 < 0.001 < 0.001 < 0.001 0.002
Time < 0.001 < 0.001 < 0.001 < 0.001 < 0.001 < 0.001
Dose x Time 0.813 0.428 < 0.001 < 0.001 0.021 < 0.001
(1)P: Probability due to chance.
of strength of adsorption by soil (Sposito, 1989) and, therefore, is coherent with what would be expected: as stronger the adsorption by the soil, lesser is the lost by leaching.
The difference between cations on the losses model over time, linear for the divalent cations and exponential to monovalent, may just be an experimental artifice. There is no theoretical justification to the loss model over time be different between mono and divalent cations. Besides, Markewitz et al. (2006) and Werle et al. (2008) observed that as K as Ca and Mg had exponential losses, increasing the loss rate depending on the initial content of each cation. As discussed before, Mg loss rate tended to increase with RHA dose (slope of the fitted straight in Figure 2b), with initial Mg content, but the relative rates were small at all doses. Calcium loss rates were even lower. It is possible, therefore, that the exponential character of relationship has not manifested more clearly for the divalent cations
due to small magnitude of losses of Ca and Mg (compared to K and Na), resulting in a linear relationship between cation content and the time.
Figure 2: Contents of exchangeable cations over time after application of rice husk ash (RHA) and recommended fertilization (RF) at the doses indicated by adjusted equations in layer 0.00 – 0.20 m of a Typic Hapludult.
On the other hand, decreasing of Ca, Mg and K contents over time, even at zero RHA treatment, shows that concentrations of these cations were above what is natural for this soil due to fertilization and liming performed for crops. The magnitude of these losses agrees with the observed in the others treatments: are smaller in the zero RHA than in plots with RHA because the initial contents were smaller.
The CEC at a pH 7 did not change. The time effect on percent base saturation (BS) is the sum of the effects on exchangeable basic cations Ca, Mg, K and Na. The BS and the pH decreased over time more consistent than was observed for the cations individually. The coefficients of determination of linear equations adjusted to the data were all above of 0.8 (Figure 4). The slope of straight increased by RHA application in these two parameters, which means that the rate of decrease with the time has increased with the initial value to both BS and pH. In other words, as greater the initial value (highest RHA application) the higher was the rate of decrease with time.
Figure 5(rate of decrease calculated from slope equations of the curve per year) shows the relationship between BS rate of decrease along with the initial BS, and pH rate of decrease. Apparently pH and soils base saturation tend to return to originals values which are in the soil in their natu-ral state. Theoretically these values correspond those that would be observed when the rate of decrease is zero in Figure 5. These values (pH = 4.96 and BS = 29%) are very close to the average values observed by Nachtigall & Vahl (1989) in the average of seven Typic Hapludult from region in their natural state, without cultivation.
The decrease of the BS and pH over time shows the natural process of soil reacidification after acidity correction. In areas where rain exceeds evapotranspiration,
soil acidification is a natural process (Bolan et al., 2003). The acidification phenomenon may involve several pro-cesses, but the main acidity source for soil is the CO2 derived from respiration by plant roots and microorganisms, which dissolves in water to form carbonic acid (Schlesinger & Andrews, 2000).
When CO2 dissolves in water, it forms carbonic acid that dissociates to produce ions HCO3- and H+ according
to reaction: CO2 + H2O <=> HCO3- + H+ (Sposito, 1989).
Under normal CO2 concentration in the air (0.03%), pH of rain water is about 5.6 (Bolan et al., 2003). In soil air the CO2 concentration is even higher and pH of solution could still be less than 5.6 (Sposito, 1989). The most important fact is that over time, soil receives rain water with a concentration of at least 10-5,6 mol L-1 of H+ which is added
to soil. The ions H+ have high affinity by pH-dependent
charges of soil colloids, displacing base cations from these charges. This decreases the CEC and the base cations that are released into soil solution are subject to leaching by percolating water.
In treatment with liming (RF), the pH reached value close to 6 (5.8) only in the second sampling, at 211 daa, which was expected because limestone reaction is sufficiently slow to not exercising their corrective effect already in the first sampling (15 daa). The pH value ranged between 5.5 and 5.8 over time but without defined trend and an average 5.6. According to Zancanaro (1996) there are seasonal variation of soil pH of 0.3 at 0.5 units with the time in soil without liming and, in soils with low LR (lime requirement), the liming effect can be masked by this seasonal variation. In this treatment BS showed decreasing trend with the time, but this decrease was not statistically significant. Therefore, liming effect remained over the 804 days of the experiment.
Comparing the RHA effect with liming effect, there are two important aspects: the initial reaction rate and the residence time of effect in acidity parameters, BS and pH. While the RHA effect was already full in the first sampling (15 daa) and thenceforth has begun to decline, the liming effect has reached the peak effect at 211 daa and remained until the end of sampling period (Figure 4).
Considering the residual effect of RHA as the residence time of effect measurable in the analyzed variables, it was estimated the required time to the basic cations contents. The BS and pH return to values obtained in the beginning of experiment in the treatment zero, representing soil in their initial state. For this estimate were used the equations listed in Figures 2 and 4. The estimated times are listed in Table 4. Just Ca and Na had residence time smaller than 804 days after application of RHA. To the other variables, the estimated time extrapolated the 804 days, mainly at the highest RHA application. The t1/2 of all variables, in all three RHA doses, were smaller than 804 days (Table 4). Obviously, in the variables that the relationship with the time is linear the t1/2 is half the time to the total extinction of the effect and in variables which the relationship is exponential (K and Na) the t1/2 was lower than total time.
Except for Na, in other variables the t1/2 increased by RHA application, but not in direct proportion: a fourfold increase in RHA application (30 to 120 t ha-1) increased the
t1/2 just between 18 and 44%, depending of variable. On the other hand, the ascending order of t1/2 between four basic cations was Na < Ca < K < Mg (Table 4). This is not exactly the reverse order of these cations due to rate of decrease by leaching that, in principle, it would be logical: Ca, which had the lowest rate of decrease, should have the greatest t1/2; the other three cations results are in agreement with their rate of decrease. In the case of Ca, increased from their initial content by RHA application was very small, just 20% compared to the soil content. So, although the Ca rate of decrease was the lowest between the cations it was enough to lose faster the small amount of Ca that RHA added to the soil.
The t1/2 of BS is the weighted median of t1/2 from absolute contents of basic cations. So, like the t1/2 of each cation increased by RHA application, the t1/2 of BS also increased. As the pH is related to the base saturation, it increased accordingly (Table 4). However, there is inconsistency between pH and BS of t1/2 values: they should be, at least, very close each other. It’s possible that
Table 4: Total time (tt) and half-life (t1/2) estimated to contents of exchangeable cations, base saturation (BS) and pH values returned to initials values in soil
Ca Mg K Na BS pH
tt t1/2 tt t1/2 tt t1/2 tt t1/2 tt t1/2 tt t1/2
t ha-1 Days
30 441 220 977 488 724 292 634 215 656 328 1040 520
60 691 346 1182 591 1095 392 553 151 840 420 1171 586
120 636 318 1396 698 1265 412 598 145 899 450 1236 618
RF(1) - - - - 582 270 - - - - - -
53.66(2) - - - - - - - - 809 404 1149 574
(1)Treatment with limed and fertilized recommended by the CQFSRS/SC (2004).
(2)RHA dose estimated to correct the initial soil pH to 6.
Dose
this inconsistency is just a consequence of accumulated experimental errors, because the t1/2 were estimated from adjusted equations between the variables and the time which variation rates were numerically small and, therefore, the experimental error becomes large proportionally. Regardless of this apparent inconsistency, the RHA effect as acidity corrective is almost immediate, as discussed by Islabão et al. (2014) and starts to decrease just after their application into the soil. In the necessary RHA dosage to increase the initial pH to 6, estimated in 53.66 t ha-1, the t
1/2 was 574 days
to the pH and 404 days to the BS (Table 4). Even with this discrepancy of t1/2 between pH and BS, is a much smaller duration time than that observed to liming effect, in RF treatment, which there was not significant variation in the pH and in the BS during 804 days of experiment. The projection for the total time (tt) was 809 days for BS and 1149 days for pH (Table 4). On average, this means about 33 months that can be considered as the time of the residu-al effect of RHA as corrective of acidity for the soils and weather conditions studied.
CONCLUSIONS
Reaction rate of RHA is faster when compared to liming, because all bases contained in it are dissolved immediately after their incorporation into the soil.
The residual effect of RHA on exchangeable Ca, Mg and K contents, on the base saturation and in the pH increased with increasing RHA applied to the soil.
As corrective of soil acidity, the residual effect of RHA comes down to the time needed to occurs the natural process of reacidification and leaching of basic cations, about 33 months for soils and weather conditions similar to this work.
ACKNOWLEDGEMENT
The authors are indebted to Brazilian Federal Agency for Support and Evaluation of Graduate Education (CA-PES), for funding and for scholarships.
REFERENCES
Angel JDM, Vásquez TGP, Junkes JA & Hotza D (2009) Caracte-rização de cinza obtida por combustão de casca de arroz em reator de leito fluidizado. Química Nova, 32:1110-1114.
Bolan NS, Adriano DC & Curtin D (2003) Soil acidification and liming interactions with nutrient and heavy metal transformation and bioavailability. Advances in Agronomy, 78:215-272.
CQFSRS/SC - Comissão de Química e Fertilidade do Solo (2004) Manual de adubação e calagem para os Estados do Rio Grande do Sul e Santa Catarina. 10ª ed. Porto Alegre, Sociedade Brasileira de Ciência do Solo. 404p.
Cruz ES (1977) Efeito residual da calagem em solos de diferentes classes texturais. Dissertação de Mestrado. Universidade Fede-ral do Rio Grande do Sul, Porto Alegre. 102p.
Demeyer A, Nkana JCV & Verloo MG (2001) Characteristics of wood ash and influence on soil properties and nutrient uptake: an overview. Bioresource Technology, 77:287-295.
Embrapa – Empresa Brasileira de Pesquisa Agropecuária (2013) Estação Agroclimatológica de Pelotas – Boletim Agroclimato-lógico. Disponível em: <http://www.cpact.embrapa.br/agromet/ estacao/>. Acessado em: 20 de agosto de 2013.
Islabão GO (2013) Uso da cinza de casca de arroz como corretivo e condicionador do solo. Tese de Doutorado. Universidade Fe-deral de Pelotas, Pelotas. 81p.
Islabão GO, Vahl LC, Timm LC, Paul DL & Kath AH (2014) Rice husk ash as corrective of soil acidity. Revista Brasileira de Ciên-cia do Solo, 38:934-941.
Markewitz D, Figueiredo R & Davidson EA (2006) CO2-driven
cation leaching after tropical forest clearing. Journal of Geochemical Exploration, 88:214-219.
Nachtigall GR & Vahl LC (1989) Parâmetros relacionados à aci-dez em solos da região sul do Rio Grande do Sul. Revista Brasi-leira de Ciência do Solo, 13:139-143.
Natale W & Coutinho ELM (1994) Avaliação da eficiência agro-nômica de frações granulométricas de um calcário dolomítico. Revista Brasileira de Ciência do Solo, 18:55-62.
Novais RF de & Mello JWV de (2007) Relação solo-planta. In: Novais RF de, Alvarez V VH, Barros NF de, Fontes RL, Cantarutti RB & Neves JCL (Eds.) Fertilidade do solo. Viçosa, Sociedade Brasileira de Ciência do Solo. p.133-204.
Raij B van (2011) Fertilidade do solo e manejo de nutrientes. Piracicaba, International Plant Nutrition Institute. 420p.
Schlesinger WH & Andrews JA (2000) Soil respiration and the carbon cycle. Biogeochemistry, 48:07-20.
Severo CRS (1999) Caracterização dos solos do Centro Agropecuário da Palma. Dissertação de Mestrado. Universidade Federal de Pelotas, Pelotas. 97p.
SigmaPlot (2008) Exact Graphs and Data Analysis. Version 11.0. San Jose, Systat Software. CD-Rom.
Sposito G (1989) The chemistry of soils. 2ª ed. New York, Oxford University Press. 277p.
Tedesco MJ, Gianello C, Biassani CA, Bohnen H & Volkweiss SJ (1995) Análises de solo, plantas e outros materiais. Porto Ale-gre, Universidade Federal do Rio Grande do Sul. 174p. (Boletim técnico, 5).
Werle R, Garcia RA & Rosolem CA (2008) Lixiviação de potássio em função da textura e da disponibilidade do nutriente no solo. Revista Brasileira de Ciência do Solo, 32:2297-2305.