“Building an Embedded Enterprise Performance
Management Solution: An Exploratory Case Study"
Caglayan Adiguzel
Project Work presented as partial requirement for obtaining
the master’s degree in Statistics and Information Systems
and Information Technologies Management.
2018
“Building an Embedded Enterprise Performance Management Solution: An Exploratory Case Study "
Caglayan Adiguzel
NOVA Information Management School
Instituto Superior de Estatística e Gestão de Informação
Universidade Nova de Lisboa
BUILDING AN EMBEDDED ENTERPRISE PERFORMANCE
MANAGEMENT SOLUTION: AN EXPLORATORY CASE STUDY
by
Caglayan Adiguzel
Project Work presented as a partial requirement for obtaining the master’s degree in Information Management, with a specialization in Information Systems and Technologies Management
ACKNOWLEDGEMENTS
First, I would like to thank to my advisor, Professor Miguel Neto, for all the guidance and advices during the progression of this study. His instructions helped me to progress, both professionally and personally. With his support, it was possible to finalize this work project. Many thanks to all employees of the company that is the main target of this study, for providing the necessary resources for the development of this work project.
Thanks to my family and friends, for always standing by myside and encouraging me to believe in my abilities to achieve my goals.
ABSTRACT
Nowadays most companies are struggling to manage large data and spending a lot of money on storing and capturing. To benefit from the stored data, enterprises implement Business Intelligence solutions and technology-driven processes. The most significant advantage of BI is analyzing actionable information and data-driven business decisions for executives and managers. Since technology is evolving very fast, Business Intelligence processes are getting more advanced every day. These advancements are promoting accountability, visibility, timely actionable information, increased return on investment, connected business processes, standardized management processes and augmented organizational flexibility. In a relationship with BI, enterprise performance management provides more predictable answers on these advancements by improving planning, budgeting, financial reporting, and consolidation.
Therefore, this study aims to contribute to a better understanding of the implementation processes of embedded Enterprise Performance Management Solutions in ERP Embedded BI Platforms by revealing its methodology, steps, significant milestones, and effectiveness of the organizational structure. The embedded approach is going to be maintained by Business Intelligence based Business Planning and Consolidation tool on Enterprise Resource Planning System. Embedded Enterprise Performance Management solutions consist of Analysis Reporting, Business Planning, and Consolidation. Thoroughly they cover budgeting, planning, and consolidation as an advance altogether. The Implementation of an artefact aims to satisfy market competition requirements and to compete with financial demands which are originated from the growth rate at the organizational level
There are several studies in the literature focuses on the critical success factors of BI projects, but there are not many studies which are mainly focused on the process evaluation of embedded enterprise performance management solutions and their success on organizations. This study will be an exploratory design research case study of a Group Company which is professionalized in language translation in 30 different countries on five different continents.
KEYWORDS
Budget Planning, Consolidation, EPM, Enterprise Performance Management, Embedded Systems, Real-Time, Business Intelligence, Finance
INDEX
1. Introduction ... 1
1.1.
Contextualization ... 1
1.2.
Identify Problem and Motivate ... 2
1.3.
Define Objectives of Solutions ... 3
1.4.
The Main Question Regarding with the Project ... 3
1.5.
Project Goals... 3
2. Literature Review ... 4
2.1.
Enterprise Performance Management... 4
2.1.1.
Planning & Budgeting ... 4
2.1.2.
Consolidation ... 5
2.1.3.
Business - Enterprise Reporting ... 5
2.1.4.
Usage of EPM ... 5
2.2.
Business Intelligence ... 6
2.2.1.
Data Warehouse and Infrastructure ... 7
2.2.2.
Metadata and Optimization ... 11
2.2.3.
Business and Management Processes ... 12
2.2.4.
Reporting Tools ... 13
2.2.5.
Development Methodologies ... 18
2.2.5.1. Waterfall ... 18
2.2.5.2. Agile ... 18
3. Methodology ... 21
3.1.
Analyze and Design the System... 21
3.2.
Build the Prototype ... 22
3.3.
Assumptions and Limitations ... 24
3.4.
Observe and Evaluate the System ... 25
3.4.1.
Project Management Plan ... 25
3.4.2.
Planning Preparation... 26
3.4.3.
Top Down Goals and Guidelines ... 29
3.4.4.
B1-Forecast and Budget ... 29
3.4.4.1. Project Revenue and Cost Planning ... 29
3.4.4.3. CAPEX ... 34
3.4.4.4. OPEX Planning ... 35
3.4.5.
B2-HCM Planning ... 39
3.4.6.
B3-Financial and Operational Reporting ... 41
3.4.6.1. P&L Actuals vs. Budget ... 42
3.4.6.2. Cash Flow actuals vs. Budget... 44
3.4.6.3. Balance Sheet actuals vs. Budget ... 47
4. Results And Discussion ... 49
5. Conclusions ... 50
6. Recommendation For Future Developments ... 51
7. Bibliography ... 55
LIST OF FIGURES
Figure 1.1: Modules of ERP System ... 2
Figure 2.1: Current Architecture by EPM Activity ... 6
Figure 2.2: Kimball DW Architecture ... 8
Figure 2.3: Hierarchy Sample ... 8
Figure 2.4: Structure of Star Schema ... 10
Figure 2.5: SAP S/4HANA ... 11
Figure 2.6: Magic Quadrant for Analytics and BI Platform ... 14
Figure 2.7: Magic Quadrant for EPM Tools ... 15
Figure 2.8: Comparison of Wide-Scale EPM Solutions ... 15
Figure 2.9: SAP BPC Solutions... 16
Figure 2.10: SAP BPC Approach on S/4HANA ... 17
Figure 2.11: SAP BPC Version List ... 17
Figure 2.12: Waterfall Methodology ... 18
Figure 3.1: Macro Vision of Planning Process ... 22
Figure 3.2: Planning and Budgeting Approach ... 23
Figure 3.3: Forecast & Budget Process ... 24
Figure 3.4: The legend of Figure 3.3 ... 24
Figure 3.5: Functional Architecture of the Planning Solution ... 25
Figure 3.6: Macro Project Plan ... 26
Figure 3.7: Planning Preparation ... 26
Figure 3.8: Top-down Goals and Guidelines ... 29
Figure 3.9: Project Revenue and Cost Planning ... 29
Figure 3.10: HANA Studio Overview ... 30
Figure 3.11: Main Info Providers of OPEX and FI Functions ... 31
Figure 3.12: ZFI_R01 Characteristic Relationships ... 31
Figure 3.13: Data Slices ... 31
Figure 3.14: Data Slice of planning for June 2017 ... 32
Figure 3.15: Planning Account Structure for P&L with *999 Planning Accounts ... 32
Figure 3.16: Categories in SPRO ... 33
Figure 3.17: Planning Period for Category in SPRO ... 33
Figure 3.18: Actual Accounts to *999 Planning Accounts mapping ... 33
Figure 3.19: Accounts not Mapped AFO Report ... 34
Figure 3.20: Revenue Account Mapping ... 34
Figure 3.22: AFO Reports and Planning Elements ... 36
Figure 3.23: Increased Percentage Input Enabled AFO Report ... 36
Figure 3.24: Cost Center Planning Input Enabled AFO Report ... 36
Figure 3.25: Profit Center Planning Input Enabled AFO Report ... 37
Figure 3.26: AFO Report Prompt ... 39
Figure 3.27: HCM Planning ... 39
Figure 3.28: All HR HANA Views for Actual Data ... 40
Figure 3.29: HR-HCM Planning Applicable Steps ... 40
Figure 3.30: HCM Planning FTE - Employee Input Enabled AFO Report ... 41
Figure 3.31: HCM Planning Annual Salary - Employee Input Enabled AFO Report... 41
Figure 3.32: Financial and Operational Reporting Elements ... 41
Figure 3.33: Planning Control AFO Report ... 42
Figure 3.34: P&L Process Flow... 43
Figure 3.35: Report Tree for P&L ... 43
Figure 3.36: P&L Planning Sequences Running Buttons on Report ... 43
Figure 3.37: P&L Input Enabled AFO Report ... 44
Figure 3.38: Profit and Loss Budgeting Info Providers ... 44
Figure 3.39: Report Tree for Cash Flow ... 44
Figure 3.40: Cash Flow Annual Assumptions Input Enabled AFO Report ... 45
Figure 3.41: Cash Flow Monthly Assumptions Input Enabled AFO Report ... 45
Figure 3.42: P&L to Cash Flow Transfer Assumptions Input Enabled AFO Report ... 45
Figure 3.43: Cash Flow AFO Report ... 46
Figure 3.44: AFO Reports and Planning Elements ... 46
Figure 3.45: BPC Balance Sheet and Cash Flow Multi-Provider with Info Cubes ... 47
Figure 3.46: FI Actual Planning Multiprovider with Info Cubes ... 47
Figure 3.47: BL/CF Balance Actuals Info Providers ... 47
Figure 3.48: Report Tree for Balance Sheet ... 47
Figure 3.49: P&L to Balance Sheet Transfer Assumptions Input Enabled AFO Report ... 48
Figure 3.50: Cash Flow to Balance Sheet Transfer Assumptions Input Enabled AFO Report .. 48
Figure 3.51: Balance Sheet AFO Report ... 48
Figure 6.1: SAP BPC Web Interface ... 51
Figure 6.2: SAP BPC Web Console My Activities - BPF List ... 52
Figure 6.3: Consolidation Activities BPF on BPC Web Client ... 52
Figure 6.4: SAP EPM Interface ... 53
Figure 8.3: Virtual Infocube directly connected to Real-Time Hana View ... 59
Figure 8.4: Mapping of Info Cube Fields (On the left) and Hana View Fields (On the Right) .. 59
Figure 8.5: Real Time Infocube Designed for Planning Purposes... 60
Figure 8.6: Activate Deactivate Data Slice Planning Functions in PS ... 60
Figure 8.7: Activate/Deactivate Data Slice PF Filter ... 61
Figure 8.8: Intercompany Recharge PF Filter ... 61
Figure 8.9: Intercompany Recharge PF Details ... 62
Figure 8.10: Copy Actual PS ... 64
Figure 8.11: Copy Actual to 9* Accounts PF Filter ... 64
Figure 8.12: Copy Actual to 9* Accounts PF Details ... 65
Figure 8.13: Monthly Distribution – Cost Center PS ... 66
Figure 8.14: Actual Data Monthly Distribution by Cost Center PF Filter ... 67
Figure 8.15: Actual Data Monthly Distribution by Cost Center PF Details ... 67
Figure 8.16: Planning Data Monthly Distribution by Cost Center PF Filter ... 69
Figure 8.17: Planning Data Monthly Distribution by Cost Center PF Details ... 69
Figure 8.18: Year Aggregation – Cost Center PS ... 71
Figure 8.19: Year Aggregation by Cost Center PF Filter ... 71
Figure 8.20: Year Aggregation PF Details ... 72
Figure 8.21: Monthly Distribution Year+1 by Cost Center PS ... 73
Figure 8.22: Monthly Distribution Year+1 by Cost Center PF Filter ... 73
Figure 8.23: Year Aggregation Year+1 – Cost Center PS ... 74
Figure 8.24: Monthly Distribution – Profit Center PS ... 74
Figure 8.25: Monthly Distribution – Profit Center PF Filter ... 74
Figure 8.26: Monthly Distribution Actual Data by Profit Center PF Filter ... 74
Figure 8.27: Year Aggregation by Profit Center PS ... 75
Figure 8.28: Monthly Distribution Year+1 by Profit Center PS ... 75
Figure 8.29: Monthly Distribution Year+1 by Profit Center PF Filter ... 75
Figure 8.30: Year Aggregation Year+1 by Profit Center PS ... 75
Figure 8.31: P&L - Full Integration PS ... 76
Figure 8.32: P&L and WBS integration PF Filter ... 76
Figure 8.33: P&L WBS Integration by Plan Data PF Details ... 77
Figure 8.34: P&L - WBS integration – Actual PF Filter ... 78
Figure 8.35: P&L and WBS Integration by Actual Data PF Details ... 79
Figure 8.36: P&L - Cost and Profit Center Integration PF Filter ... 80
Figure 8.37: P&L Cost and Profit Center Integration PF Details ... 81
Figure 8.38 : P&L - HR Integration PF Filter ... 81
Figure 8.40: P&L - Cost and Profit Center Integration - Trend Years PF Filter ... 84
Figure 8.41: P&L - Cost and Profit Center Integration – Actual PF Filter ... 84
Figure 8.42: P&L Cost and Profit Center Integration by Actual PF Details ... 85
Figure 8.43: P&L - WBS Integration PS ... 86
Figure 8.44: P&L by Cost and Profit Integration PS ... 86
Figure 8.45: P&L by HR Integration PS ... 86
Figure 8.46: P&L - Copy P&L to Adjusted P&L PS ... 86
Figure 8.47: P&L by Cost and Profit Center Integration - Trend Years PF Filter ... 87
Figure 8.48: P&L Copy to adjusted PF Details ... 87
Figure 8.49: P&L Copy to adjusted Standard PF ... 87
Figure 8.50: P&L - WBS Integration PS ... 88
Figure 8.51: HR FTE Copy Actual PS... 88
Figure 8.52: FTE Copy Filter PF Filter ... 88
Figure 8.53: HR FTE Input Year Copy PF Details ... 89
Figure 8.54: HR Planning PS... 90
Figure 8.55: HR Percentage Increase PF Filter ... 90
Figure 8.56: HR Salary Increase Function PF Details ... 90
Figure 8.57: HR Salary Month Distribution PF Filter ... 92
Figure 8.58: Salary Input Year to Month Distribution PF Details ... 92
Figure 8.59: HR FTE Planning Sequence 1 PF Filter ... 94
Figure 8.60: FTE Distribution 1 PF Details ... 95
Figure 8.61: FTE Distribution 2 PF Details ... 96
Figure 8.62: HR FTE Planning Sequence 2 PF Filter ... 97
Figure 8.63: Currency Conversion PF Filter ... 97
Figure 8.64: HR Currency Conversion PF Details ... 98
Figure 8.65: HR Trend Years Calculation PF Filter ... 99
Figure 8.66: HR Trend Years Calculation PF Details ... 99
Figure 8.67: HR Trend Years Calculation PF Standard Copy Formula ... 99
Figure 8.68: P&L to CashFlow Planned PF Details ... 100
Figure 8.69: P&L to CashFlow Actual Months Accumulated PF Details ... 102
Figure 8.70: P&L to CashFlow Actuals PF Details ... 105
Figure 8.71: CF->BS PF Details ... 107
Figure 8.72: CashFlow Accumulated Balance PF Details ... 108
Figure 8.73: CashFlow Actual Months Accumulated Balance PF Details ... 110
Figure 8.77: Accumulated Beginning Balance PF Details ... 113
Figure 8.78: Accumulated Beginning Balance PF Standard Copy Fox Formula... 114
Figure 8.79: CashFlow Final Month Beginnings Calculation PF Details ... 114
Figure 8.80: CashFlow Final Calculations PF Details... 116
LIST OF TABLES
Table 3.1: Methodology Overview ... 21
Table 3.2: Business Steps of Planning ... 23
Table 3.3: Preliminary Processes Steps ... 32
Table 3.4: OPEX Planning Applicable Steps ... 35
Table 3.5: Profit Center Planning Input Enabled AFO Report Macro Buttons and Functions . 38
Table 3.6: Description of Indices from Figure 3.33 ... 42
Table 8.1: Deactivate Data Slice PF Fox Formula Code ... 61
Table 8.2: Activate Data Slice PF Fox Formula Code ... 61
Table 8.3: Intercompany Recharge PF Fox Formula Code ... 63
Table 8.4: Copy Actual to 9* Accounts PF Fox Formula Code ... 66
Table 8.5: Actual Data Monthly Distribution by Cost Center PF Fox Formula Code ... 68
Table 8.6: Planning Data Monthly Distribution by Cost Center PF Fox Formula Code ... 70
Table 8.7: Year Aggregation PF Fox Formula Code ... 73
Table 8.8: P&L WBS Integration by Plan Data PF Fox Formula Code ... 78
Table 8.9: P&L and WBS Integration by Actual Data PF Fox Formula Code ... 80
Table 8.10: P&L Cost and Profit Center Integration PF Fox Formula Code ... 81
Table 8.11: P&L HR Integration PF Fox Formula Code ... 84
Table 8.12: P&L Cost and Profit Center Integration by Actual PF Fox Formula Code ... 85
Table 8.13: HR FTE Input Year Copy PF Fox Formula Code ... 89
Table 8.14: HR Salary Increase Function PF Fox Formula Code ... 91
Table 8.15: Salary Input Year to Month Distribution PF Fox Formula ... 94
Table 8.16: FTE Distribution 1 PF Fox Formula... 95
Table 8.17: FTE Distribution 2 PF Fox Formula... 97
Table 8.18: HR Currency Conversion PF Fox Formula ... 98
Table 8.19: Cash Flow copy from P&L PS ... 100
Table 8.20: P&L to CashFlow Planned PF Fox Formula ... 101
Table 8.21: P&L to CashFlow Actual Months Accumulated PF Fox Formula ... 104
Table 8.22: P&L to CashFlow Actuals PF Fox Formula ... 106
Table 8.23: CF->BS PF Fox Formula ... 107
Table 8.24: CashFlow Accumulated Balance PF Fox Formula ... 110
Table 8.25: CashFlow Actual Months Accumulated Balance PF Fox Formula ... 111
Table 8.26: PL->BS PF Fox Formula ... 113
Table 8.29: Cash Flow Adjusted Calculations PS ... 121
Table 8.30: CashFlow Adjusted Calculations PF Fox Formula ... 125
LIST OF ABBREVIATIONS AND ACRONYMS
EPM Enterprise Performance ManagementBI Business Intelligence
ERP Enterprise Resource Planning
BPC Business Planning and Consolidation
IT Information Technology
IS Information Systems
DW Data Warehouse
OLAP Online Analytical Processing
EDW Enterprise Data Warehouse
SQL Structured Query Language
RAM Random Access Memories
ABAP Advanced Business Application Programming
SAP Systems Applications and Products in Data Processing
BW Business Warehouse
BW-IP Business Warehouse – Integrated Planning
PAK Planning Application KIT
ETL Extract Transform Load
EDM Enterprise Data Model
CRM Customer Relationship Management
HR Human Resources
HRM Human Resources Management
DBMS Database Management System
OLTP Online Transaction Processing Databases
CPM Corporate Performance Management
AFO Analysis for Office
1. INTRODUCTION
Lately, organizations are investing a lot of money on storing and capturing data. Most companies are struggling to manage the vast amount of data which is growing day by day with an increasing rate. To maintain the benefits of stored data, enterprises implement technology-driven Business Intelligence processes to extract data-driven business decisions. Since technology is evolving very fast, Business Intelligence processes are getting more advanced every day. Because of that organizations are very eager to maintain.
Meanwhile, timely, accurate, and relevant intelligence to plan and control the entire organization is getting essential. Enterprises are trying to collect the most vital metrics to measure the performance with the help of technology. At this point, the general trend is getting to the idea that all management systems could work together to provide the needs of the organization at the right time. Enterprise Performance Management (EPM) provides these enhancements by improving organizations’ planning, budgeting, financial reporting, and consolidation. The primary motivation of Enterprise Performance Management is managing integrated business processes on the strategical, financial and operational level to enable more effective businesses. EPM can provide a competitive aspect for companies which integrate it by allowing their self to anticipate and respond to a changing business environment. Henceforth, the aim of this study is the development of an embedded enterprise performance management solution in ERP embedded business intelligence platform to maintain foresight capacity and decision-making mechanism for the group company. During the project the chosen embedded enterprise performance management solution will be implemented to provide a clear understanding of improved financial reports with planning approach. In the meantime, the developed system will be providing real-time data for the reporting as well as sustaining real-time planning for a different level of the group company. The ultimate aim is to retain better-informed decisions and plans.
The study paper is organized in several sections. The first section is completely related with problem, motivation, objective and project goals. The second one is entirely dedicated to literature review, where each relevant idea mentioned in the paper is discussed in detail. The third section presents the methodology considered most appropriate for the problem in analysis. It also includes an extensive analysis of the findings that are extracted from artefact development performed during the methodological process. The fourth section is presenting all the significant results and analysis which are collected during and after the implementation. Finally, the last section displays the conclusions extracted throughout the master thesis project.
1.1. C
ONTEXTUALIZATIONThe Group Company which is the main asset of this article has an ERP system which consists of different modules, such as Financial Accounting (FI), Controlling (CO), Asset Accounting (AA), Sales & Distribution (SD), Material Management (MM), Project System (PS), Human Resources (HR), etc. ERP system collects and combines data from the separate modules to provide a complete data store for the company or organization. A complete combination of the data structure in the ERP system is summarized in Figure 1.1.
Figure 1.1: Modules of ERP System
All these modules provide actual data through the central component ERP structure as well as store planning data aside. That is why this study aims to develop an embedded enterprise performance management solution in ERP embedded business intelligence platform to maintain foresight capacity and decision-making mechanism for the group company. Business Intelligence approach will be used to process the data as valuable information. It will lead to a faster, more efficient decision-making processes on enterprise performance management.
1.2. I
DENTIFYP
ROBLEM ANDM
OTIVATEMajor Problems in Group Company are briefly presented below:
• Basic excel forms are used by central financial services through a process of enterprise performance management. The whole approach is centralized in shared finance services in one company branch and transformations is happening through email connections.
• Many organizations started to use globally connected ERP system related enterprise performance management tools.
• Since the company developed a global financial structure above its partners and shareholders, a new solution for the globally available performance management tool is required.
• Lack of guidance through the application of enterprise performance management solution to improve the orientation of business processes with the business strategy and to develop the ability to measure performance efficiently.
• As a group company, revealing performance indicators demands consistency on the global-based analysis. Direct participation of each peer from every part of the global structure of the group company is also required to maintain control conditions requested by managers. Coordination of activities needed for budget planning and consolidation as an advance through enterprise performance management progress.
1.3. D
EFINEO
BJECTIVES OFS
OLUTIONSSo briefly our objective is: “Propose a method towards the evaluation of the implementation of an embedded enterprise performance management solution in ERP Embedded BI platform of a group company, thereby improving the orientation of business processes with the business strategy and enhancing the ability to measure financial performance by using the advantages of real-time data support.”
1.4. T
HEM
AINQ
UESTIONR
EGARDING WITH THEP
ROJECTBased on the problem and objective, the primary research question is: Is it possible to build a specific artefact to satisfy the needs of the group company. On the other hand, what can be the most suitable solution for the evaluation of the design and implementation of an embedded enterprise performance management solution in ERP embedded BI Platform and what are the properties of this solution to reveal and analyze this question?
Support questions for the workshop are defined according to Span (2009):
• What is the current situation in literature, about enterprise performance management (EPM)? • What is the current situation in literature, about Business Intelligence (BI)?
• What constraints need to be dealt with through the evaluation of designing and implementing an embedded EPM solution in practice?
• What are the main properties of an embedded EPM solution in real life?
• Which steps can be separated through the evaluation of the design and implementation process of an embedded EPM solution in practice?
• Which steps or activities can be executed through the assessment of developing and implementing an embedded Enterprise Performance Management solution in practice?
• What methods and techniques can be used to reach the objective in practice?
Briefly, the output of this project will be the building of a globally connected enterprise performance management system.
1.5. P
ROJECTG
OALSThe primary goal is to develop a methodology for the building of embedded Enterprise Performance Management solution in ERP Embedded BI Platform which has a significant relationship with the new technology in-memory, column-oriented, relational database ERP system.
This objective is right from the IT-Eye perspective and the actual group company’s structure as well. It will be very useful in creating this method to provide and relate to the company`s strategy and to monitor business processes globally. The next step of discovering the applicability of an embedded enterprise performance management solution will help the group company compared to other solutions on the market in decision making and systematize management processes. This should predict new opportunities for the company for further performance improvements. (Span, 2009)
2. LITERATURE REVIEW
In this context, Enterprise Performance Management is not a very popular theoretical topic in the business intelligence area that attracts attention lately. However, it was recently ranked as one of the top ten technology trends that companies should own. It is considered a jump tool ahead of the competition (Ariyachandra, 2008). Below, a literature review of EPM is mentioned briefly by the support of BI understanding of data warehousing. Beside EPM, Business Intelligence approach should be identified, analyzed and understood completely. The reason is; EPM is directly related with Business Intelligence in Information Management Systems and Technologies. EPM and Business Intelligence aspects will be presented briefly in divided sections to cover all the elements of this project.
2.1. E
NTERPRISEP
ERFORMANCEM
ANAGEMENTIn general, EPM solutions in financial context are formed by Planning & Budgeting, Financial Enterprise Reporting and companywide Consolidation approaches (Gaiss, 1998). It is very crucial that a company has a long and short-term planning mindset which is considering the actual financial history of the organization in each financial term. For big companies, this is one of the most significant requirements (Ariyachandra, 2008).
2.1.1. Planning & Budgeting
Planning & Budgeting is the process by which the group will establish financial goals to reflect its choices and tactics, including the use of actual and historical data to predict the financial outcome of the upcoming months (forecasting). The group’s budget method follows a bottom-up approach where individual responsibility centers start to plan future conditions for the company. Subsequent procedures will become more and more centralized along the planning flow, resulting in a corporate budget reflected on projected financial statements and reports. Specifically, budgeting is the method of analyzing the future about how to spend actual money for a defined period. Budget planning includes planned sales volumes and revenues, resource quantities, costs and expenses, assets, liabilities and cash flows (Gaiss, 1998). Creating a future transaction plan allows to control and check if enough money is available to afford needs or planned investments in advance. It is the method of balancing expenses and income altogether. Nowadays budgeting, planning, and forecasting are one of the most crucial processes for companies to estimate the future and prepared for the upcoming financial periods. Because of that preferences, consistency is critical when it comes to future financial analysis. Details can be beneficial, and timing also can reveal risks and shortages. It reveals strategic plans of business units and an organization, activities or events in defined term with measurements (Zeng, 2006).
A budget planning helps to improve the planning of actual operations by demanding consideration on how the conditions might affect the plan and what aids should be taken now by managers. It also encourages managers to consider problems before they arise from a variety of subjects. Helps the coordination of activities in the organization by informing managers to examine relationships between their operation and related departments (Bose, 2006). Other significant roles of the budget include: • To control resources
• To evaluate the performance
• To provide visibility and clearance into the company's performance • The support mechanism of responsibility
2.1.2. Consolidation
Consolidation is merging assets, equity, liabilities and operating accounts of a parent firm and its subsidiaries into one financial statement. Joining two or more firms through purchase, merger, or ownership transfer to form a new group company is the basic definition of consolidation. In the corporate dictionary, consolidation is also known as amalgamation which is the merger and acquisition of smaller companies into a more larger group company. In the financial accounting framework, consolidation refers to the combination of financial statements of a group company as consolidated financial statements with a parent-child financial relationship (Loebbecke, 2016).
Consolidation methods occur in a different kind of investment methods. Percentages signify the influence of parent(purchasing) company on a child (Purchased) company. These are 20% ownership or less (Investment), 20% to 50% ownership (Associate Company) and more than 50% ownership (Subsidiary). In this case, a remarkable point is if the company owns more than 50% common stocks of child company, purchasing company has control over the acquired company (Elias, 2012).
Consolidation shows both parent and subsidiaries in a consolidated financial as one single entity. Parent company uses its investment power on subsidiary to make further investments (Bose, 2006).
2.1.3. Business - Enterprise Reporting
Business reporting or enterprise reporting is an analysis of financial data by a business enterprise. On the other hand, reporting is the acquirement of information for decision-makers within an organization to support their work effort. Implementation of a project consists of extract, transform and load (ETL) processes in coordination with business warehouse (Data Warehouse) (Bose, 2006). After these operations finished, reporting tools are used to create provisions from the collected data for decision making. These reports delivered to designated users by different distribution channels like print out, email or cloud-based presentations. Nowadays, with the expansion of information technology and the increases in the desire of corporations, the computer is the only way of reporting. All these approaches are originated from analytics which is discovery and interpretation of meaningful part of data. Organizations apply analytics to their data to describe, provision and improve their business performance in advanced level. Especially, areas of analytics which includes predictive analytics, prescriptive analytics, and enterprise decision management are critical and beneficial. There is also a different analytics method to improve prediction and provisioning. According to that information, we can analyze possible problem which can mostly affect the building process (Bose, 2006).
2.1.4. Usage of EPM
Regarding the usage of the EPM tools, the study of Desroches (2014) presents a lot of facts that are directly related with the motivation of users and EPM. According to Desroches (2014), there is still a significant dependency on the use of spreadsheet-based tools to support EPM activities. This is
Survey analysis shows that more than half of the respondents rely on spreadsheets and manual processes to support planning and budgeting activities.
Figure 2.1: Current Architecture by EPM Activity Source: (Desroches, 2014)
But users who are dependent on the use of spreadsheets and manual processes expressed that their satisfaction level regarding with the technology is the lowest. In the meantime, respondents who are using cloud technology or internal EPM Software to support EPM activities, they expressed the highest overall level of satisfaction among all technologies considered as well as the highest level of satisfaction for supporting financial close and disclosure activity and business intelligence (Desroches, 2014). Spreadsheet-dependent users are not satisfied enough that their planning and financial close activities are efficient and effective or that they have excellent processes for monitoring performance. Users who are using only ERP, are most likely to believe that their planning and financial close activities are efficient and effective. On the other hand, users who are using cloud technology or internal EPM Software are highly satisfied that their standard reports provide the information needed to perform their job, that their internal stakeholders can run their reports efficiently without relying on accounting or IT, that they have useful tools for answering ad hoc questions, and that their organization has an excellent process for monitoring performance (Desroches, 2014).
2.2. B
USINESSI
NTELLIGENCEBusiness Intelligence is considered one of the most crucial advantages of the company by many authorities. Ability to store, explore and add value by making decisions are the top benefits of BI tools. Operational systems are where you put data and BI systems is where you get the information out. (Kimball & Ross, 2013)
The success of BI on competitive advantages is driving the market to evolve every day. A lot of studies show the importance of BI platform in decision making and future planning in any organization (Dobrev & Hart, 2015).
On the other hand, maintaining BI has many requirements (Kimball & Ross, 2013): • Easy Access to Information
• Consistent Information • Adaptation to changes
• Presentation of information on time • Security of the Information
• Authority and Trustworthiness of the system • Acceptation of the success of the system
2.2.1. Data Warehouse and Infrastructure
This section will be related to Data Warehouse and its design processes. The concept of a data warehouse with its benefits and requirements and its design will be covered briefly in this section. As a first step, some major functional requirements should be identified before starting the design of Data Warehouse (Boateng, Singh, Greeshma, & Singh, 2011).
• Business needs • Outputs • Expectations
• An indication of scope for the required data • The delivery method of the data
• Defining Subject Model • Documentation of Data
These requirements will help to create a scope of Data Warehouse with its aim, goals, and limitations. After clarifying requirements, choosing the most appropriate architecture will be the next step for maintaining the data warehouse. Nature of user tasks, independent information between organizational units, social and political factors, business constraints, technical issues and compatibility with the existing system are the major factors that can affect this process (Boateng, Singh, Greeshma, & Singh, 2011).
In the meantime, the right questions should be asked regarding with the architecture also (Kimball & Ross, 2013).
• Which tool or system should be used for analysis, data recovery, database management, data migration (ETL, etc.).
• Will, there be parallel processing to maintain the system, or it will be partitioning.
According to Moody and Kortink (2000), steps of Data Warehouse creation is defined as it is presented below:
1. Develop EDM
2. Design Data Warehouse 3. Classify Entities
5. Design Data Marts – design star schema structures for each transactional data source in the data warehouse model.
One of the important data warehouse architecture is defined by Ralph Kimball (2013) which is a Dimensional Data Warehouse Architecture. Dimensional Data Warehouse is a database that is managed independently of an Operational database (OLTP - On-Line Transaction Processing databases), according to Kimball & Ross (2013). It is the favorite technique for the developers because it helps to maintain the analytical data which provides logical data for business users and fast performances on query running. It is straightforward and goal oriented (Kimball & Ross, 2013).
Figure 2.2: Kimball DW Architecture Source: (Kimball & Ross, 2013)
On dimensional modeling, the Hierarchical structure has an important role. Because it helps to construct the core points of dimensional modeling by maintaining the relationship between each other in Master Data concept (Moody & Kortink, 2000). They are generally maintained in one to many relationships which are aligned all to the same direction.
Figure 2.3: Hierarchy Sample Source: (Moody & Kortink, 2000)
According to Moody & Kortink (2000), a hierarchy in an Entity-Relationship Model is formed as “State” at the top and “Sale Item” at the bottom. As it is presented in Figure 2.3; “State” is the parent of “Region”, “Region” is the child of “State”, “Sale Item” with “Sale Location” and “Region” are all child of “State” as well. In this case “Sale”, “Location”, “Region” and “State” are all parents of “Sale Item”. As presented in Figure 2.2, Kimball’s Data Warehouse Architecture considers Data Source, ETL, Data presentation area and Business Intelligence Applications as the main components of the structure. In this concept, Data Source keeps the potential of combining useful and business-related data from different kind of business modules-resources. As an example; ERP, CRM or HRM systems are the most favorite ones. These data sources can be structured with relational databases with many tables or different independent databases with spreadsheets and plaintexts. (Ranjan, 2009)
The other concept ETL is defined as the process that consists of Extraction, Transformation, and Load which is the transporting-replicating amount of specific data from the source system to the data warehouse. ETL is very important when it comes to maintaining a good data warehouse with accurate historical or updated and maintenance of the date. To maintain it, it can also be created with full of process which is anti-duplication, character type correction, missing entry or misspelling. It is also very useful on master data change logging which provides the historical information at the Datawarehouse separated from the source system (Vassiliadis, Simitsis, & Skiadopoulos, 2003).
Another concept is the Data Presentation Area. According to Kimball & Ross (2013), it should be organized for the needs of business processes and their events. Data in the presentation area should be dimensional and business process centric. Its structure should be designed for the standard department needs, not individual department needs (Kimball & Ross, 2013). Hereafter, the concept star schema and online analytical process(OLAP) cubes take control of data structure. If the presentation area includes one of these structure designs, it is accepted that the dimensional concept is maintained on the Data Warehouse (Moody & Kortink, 2000).
Moody & Kortink (2000) identifies star schema as a basic building block which is used in Dimensional Modelling. There is a central table which is called “Fact Table” and the number of smaller tables which are called dimension tables are surrounding this fact table (Moody & Kortink, 2000).
Figure 2.4: Structure of Star Schema Source: (Moody & Kortink, 2000)
Primary Keys in all dimension tables should be maintained as concatenated in Fact Table. Because fact table is linked to other dimensional tables through those primary keys by one-to-many relationships. With this relationship, dimension tables provide more detailed master data for the element from the fact table when it is needed. In this case, the fact table is designed to store primary keys with measurements (quantity, amount, price) and dimension tables to store master data for each aggregated element from fact table (Moody & Kortink, 2000).
Both Star Schema and OLAP cubes have identifiable dimensions, but their implementation is made differently. When it comes to OLAP cubes, data is deposited with specially formatted indexes which are designed for dimensional data. On the other hand, OLAP Engine is performing pre-calculated summary tables by indexing strategies and other optimizations to provide superior query performances. Time and Hierarchies are the main navigation dimensions to slice and dice and drill down on OLAP cubes concept. OLAP techniques and tools can be used to work with data warehouses or data marts designed for sophisticated enterprise intelligence systems, as reported by Ranjan (2009). According to Kimball & Ross (2013), the primary benefit of using star schema is that it reduces the number of tables in database and number of relationships between them. It is also stated that it either be implemented with special OLAP tools or using Database management Systems(DBMS).
Since Group Company has in-memory, column-oriented, relational database management system(SAP HANA), it would be much more beneficial to have a solution which is embedded in the system directly. SAP HANA is designed to replicate and ingest structured data from SAP and non-SAP databases, applications, and other systems in a faster way. It has three styles of data replication available which are trigger-based, ETL-based, or log-based and can be used depending on the source system and desired use-case. The replicated data is stored in random access memories (RAM) rather than loaded onto disk drive which is the the traditional method of application data storage concept. Because the data is stored in-RAM, it can be accessed in real-time by analytic and transactional applications that runs on top of HANA (Merz, Hugens, & Blum, Implementing SAP BW on SAP HANA, 2015). Derivation of real-time data will be much faster and effortless. On the other hand, new technology, in-memory, column-oriented, relational database management systems offers to create and manage actual database by integrated development environment (IDE) tools (Pattanayak & Koppolu, 2016).
Figure 2.5: SAP S/4HANA Source: (Pattanayak & Koppolu, 2016)
Creating Data Sources from ERP and establishing a connection between Info Providers can be handled by IDE tools (ABAP for Eclipse) as well. Regarding embedded connection feature, Info Providers can be loaded by real-time data acquisition without any data transfer load process regulation. (Darlak & Christensen, 2014)
2.2.2. Metadata and Optimization
On the second section, metadata will be covered. Importance of Metadata and its usage in Business Intelligence approach will be covered in this section. Metadata is data that keeps information about other data in the system. Examples for metadata can be filenames, author name, file sizes, etc. According to Inmon (2002), Document ID, Data of entry, Description, Source, Classification, Index Words, Purge Date, Physical Location Reference, Length, and Related References should be included as metadata.
They should be provided by ETL suites already through the processes. Also, data warehouse architecture should be available to maintain and provide metadata repository (Kimball & Ross, 2013). According to Boateng, Singh, Greeshma, & Singh (2011), the major issues regarding with the optimization are presented as:
• The amount of data in the warehouse
• The growth rate of the warehouse and the expectation • The number of parallel users
• The complexity of user queries
• Queries and other data access functions should grow linearly with the increase of the data warehouse
Dimensional approach on modeling provides extreme optimization and scalability options. Fact tables are getting bigger every day, and their enlargement increases the arguments about simplicity on data warehousing. As Kimball & Ross (2013) stated that the key factor of data warehousing is the simplicity itself. It enhances the fast maintenance and understanding of data for the business. It also increases the query performances and runs time statistics.
2.2.3. Business and Management Processes
Nowadays, studies on data warehouse projects show that proper management on BI and holistic concepts of BI maturity is critical. Usually, Bi solution life cycle includes implementation and support processes. BI solution implementation and support services can be in-source or out-source. Successful management of BI can be maintained with a close relationship of IT and business through the BI solution life cycle. That is why, Wieder & Ossimitz (2015) suggests that Implementing and retaining a BI solution in support of “effective problem and opportunity identification, critical decision-making, and strategy formulation, implementation, and evaluation” should not be outsourced entirely. It requires internal resources beyond the IT department. Wieder & Ossimitz (2015) also states that organizations can reveal the most benefits out of BI applications if proper management of BI is maintained in the organization. According to their perspective, the relationship between BI Management Quality, Information Quality, and Data Quality are described with bullets below:
• BI management quality is positively related to the quality of managerial decision making • Information quality is positively associated with the quality of managerial decision making • Data quality is positively related to information quality
• BI management quality is positively related to data quality • BI management quality is positively related to information quality
According to Couture (2013) basic dimensions that can be expanded upon over time are presented below:
• Completeness - Source-to-target validation; Monitored and reported
• Timeliness – Defined Service Level Agreements7 (SLAs); Reviewed and approved; Monitored and reported
• Validity – Data profiling8; Data cleansing9; Inline data quality checks; Monitored and reported • Consistency – Inline data quality; Trended; Monitored and reported
Data integration processes should be, according to Sherman (2014): • Holistic – avoid costly overlaps and inconsistencies
• Incremental – more manageable and practical • Iterative – discover and learn from each project • Reusable – ensure consistency
• Documented – identify data for reuse, and create leverage for future projects • Auditable – necessary for government regulations and industry standards.
According to Horakova & Skalska (2013), BI tools are more and more often focused on Corporate Performance Management(CPM) or lately it is called Enterprise Performance Management(EPM). CPM is designed for managing and analyzing general business efficiency. Key performance indicators are generally supervised both at the corporate level and at the department or division level. CPM provides metrics for verification of business efficiency development, and BI solutions can support the practical realization of CPM.
According to (Lingle, 1996), organizations using balanced performance measurement systems as the foundation for management perform, are better than those that do not have or use the technique. Because of that companies should at least have a minor knowledge of what is EPM and its advantages on management performance. According to the related importance, there is a massive gap in the literature about EPM and its aspects. There are not enough methodological approaches analyzed and proposed for EPM design and implementation.
As (Dresner, 2008) explains, anyone can approach EPM in multiple ways when different business cases require different approaches as well. This statement may be considered as a restriction on the topic, but it reveals the needed effort on EPM area which has a broad variability within its parameters. Current EPM approaches in the literature include the BPM framework by (Ariyachandra, 2008), the BPM lifecycle by (Zeng, 2006) and PDCA cycle from (Deming, 1986). These approaches are mainly focused on continuous improvement of EPM implementation. This study tries to extend the literature by using an exploratory case study of the building of embedded version of EPM solution on an in-memory, column-oriented, relational database management system. By describing this aspect, the gap which is originated from high variability within EPM and business relation parameters will be decreased (Span, 2009).
2.2.4. Reporting Tools
Kimball & Ross (2013) describes the term BI application as the variety of abilities provided to business users to control the presentation area for analytic decision-making purposes. A BI application can be:
• Ad hoc queries – as simple as an ad hoc query tool or as complex as a sophisticated data mining or modeling application
• Standard reports – Most corporate users will probably access the data through prebuilt parameter is driven applications and templates that do not require users to construct queries directly
• Analytic apps – Ad hoc query tools may be understood and used efficiently by only a minor percentage of the potential data warehouse business users
• Data mining & models – Some of the sophisticated applications, such as modeling tools, might upload results back into the operational source systems, ETL or presentation area
Obeidat, North, Richardson, & Rattanak (2015) mentions that the Business Intelligence applications are rarely used in a popular of search-based applications within a range of areas, such as Business, Security, Finance, Marketing, Law, Education, Visualization, Science, Engineering, Medicine, Bioinformatics, Health Informatics, Humanities, Retailing, and Telecommunications.
Currently, technology vendors are promoting data visualization and Business Intelligence tools more than ever. However, other communities support that successful business intelligence implementations need to have enough human sources with capable knowledge of BI (Few, 2007). At this point, it is essential to maintain the role of the user on the development of the BI solution. As Obeidat, North, Richardson, & Rattanak (2015) recommends that at least one mid-process of the development of report or dashboard solution should be dependent on the end-user. Because users can identify and control the driven data from developed report and dashboard. Relevancy of the data between users and business is very critical in this process.
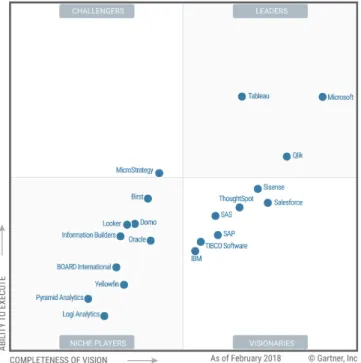
Figure 2.6: Magic Quadrant for Analytics and BI Platform Source: (Gartner, 2018)
There are a lot of business intelligence reporting software available on the market. Majority of these tools are focused on reporting and dashboarding. When it comes to input data for budgeting and planning and enterprise performance management solutions, the product range is very different and limited.
Figure 2.7: Magic Quadrant for EPM Tools Source: (G2CROWD, 2018)
The comparison of five of these full-scale Enterprise Performance Management solutions are presented below (G2CROWD, 2018):
Figure 2.8: Comparison of Wide-Scale EPM Solutions Source: (G2CROWD, 2018)
In this case, the market provides SAP BPC tool as an option for the artefact. SAP BPC (Business Planning and Consolidation) software delivers planning, budgeting, forecasting, and financial consolidation
capabilities in a single application. Adjustments on planning and budgeting are straightforward and customizable (G2CROWD, 2018).
The Actual ERP System of the group company is built on SAP S/4HANA software and HANA database. HANA is the in-memory, column-oriented, relational database that SAP SE is developed and marketed. S/4HANA is the ERP management suite that is built on operational database system by SAP SE as well (Kilaru, Sharma, Ayuluri, & Darla, 2016). In this case, we have two different options in SAP BPC solution which are BPC Standard and BPC Embedded which is more appropriate for our approach (Bekmezci, 2017):
Figure 2.9: SAP BPC Solutions Source: (Bekmezci, 2017)
BPC Classic is structurally half closed system. (Srinivasan & Srinivasan, 2015) It has its environment and does not have a direct connection with other providers. (Kilaru, Sharma, Ayuluri, & Darla, 2016) Briefly, it is constrained and does not provide real-time info provider connection from BW level. Using transactional info providers from BW is also needed because they will be helpful in providing actual data for the reporting and maintaining satisfactory assumptions. Classic BPC will be useful for Consolidation since it has a well-maintained consolidation structure which is reliable, updated, experienced and trustworthy compared to other solutions on the market (Kilaru, Sharma, Ayuluri, & Darla, 2016).
Figure 2.10: SAP BPC Approach on S/4HANA Source: (Kilaru, Sharma, Ayuluri, & Darla, 2016)
With the S/4HANA optimized BPC approach, it will be easy to maintain all the data from ERP Tables which are fundamental in Hana Multi-Tenant database. In this case, ACDOCA is the main table to keep all the data (Pattanayak & Koppolu, 2016).
Figure 2.11: SAP BPC Version List Source: (Bekmezci, 2017)
As it is shown in Figure 2.11, SAP BPC 10.1 NW version which optimized for S/4HANA Planning is also using old planning method of SAP BW which BI-IP approach as a support at the planning level (Kilaru, Sharma, Ayuluri, & Darla, 2016).
2.2.5. Development Methodologies
2.2.5.1. Waterfall
Waterfall methodology is one of the top software development approaches. It is designed as a sequential top-down flowing model that only continues to the next step when the step before is finished (Mahadevan, Kettinger, & Meservy, 2015). It is also described as a phase-oriented approach. Each phase is separated by defined quality gates to review the results of the previous phase and to authorize work on the subsequent phase. As Royce (1970) stated that waterfall methodology consists of implementation steps to develop a large computer program for delivery to a customer. Methodology is focused on milestones. It provides the separation of the project scope into end-to-end features.
Figure 2.12: Waterfall Methodology Source: (Grech, 2015).
Because of the structure, waterfall methodology is very open to adapt to shifting teams. Because it is forcing structured organization, control processes are fundamental. Key decision-makers who have a deep understanding of the system should be identified clearly for each step. Authorization structure of the project should also be identified by the other team members (Grech, 2015).
2.2.5.2. Agile
Nowadays, global scale projects and market conditions are pressuring for more dynamic environments and more flexible services when it comes to software development and implementation. Every day changing business systems are getting more common and flexible requirements with important changes during the project cycle are increasing day by day (Mahadevan, Kettinger, & Meservy, 2015). Agile supporters claim that changes and learning must take place throughout a project. It is designed to deliver increased efficiency, quality and project success (Ionel, 2009).
Some authorities define Agile as a lightweight approach to project management because of its iterative and change driven aspect. Like the name implies, agile stands for faster turnaround and the dynamic
ability to quickly adapt to required changes or developments. The agile approach has a habit of taking more people-centric perspective, implementing short, iterative phases which are called sprints. Sprints depend on ongoing feedback that continuously restructures and enhances the project design and plan (Mahadevan, Kettinger, & Meservy, 2015).
In 2001, seventeen authors released the agile manifesto which has finished the reign of traditional methodologies. Authors presented twelve principles about how the agile methodology should be practiced. Customer value, iterative delivery, intense collaboration, small integrated teams, self-organization, and small-continuous improvements were primary focuses (Mahadevan, Kettinger, & Meservy, 2015).
Principles (Beedle, et al., 2001):
1. Our highest priority is to satisfy the customer through the early and continuous delivery of valuable software
2. Welcome changing requirements, even late in development. Agile processes harness change for the customer's competitive advantage
3. Deliver working software frequently, from a couple of weeks to a couple of months, with a preference to the shorter timescale
4. Business people and developers must work together daily throughout the project
5. Build projects around motivated individuals. Give them the environment and support they need, and trust them to get the job done
6. The most efficient and effective method of conveying information to and within a development team is a face-to-face conversation
7. Working software is the primary measure of progress
8. Agile processes promote sustainable development. The sponsors, developers, and users should be able to maintain a constant pace indefinitely
9. Continuous attention to technical excellence and good design enhances agility 10. Simplicity--the art of maximizing the amount of work not done--is essential
11. The best architectures, requirements, and designs emerge from self-organizing teams
12. At regular intervals, the team reflects on how to become more active, then tunes and adjusts its behavior accordingly.
Mahadevan, Kettinger, & Meservy (2015) states that In the Waterfall approach, responsibility is often gathered in the information systems function. In the Agile approach, shared project responsibility is assigned to the information systems function and business function areas. During the project, representatives from both functions are located accordingly. Agile team members cooperatively provide status reports daily. Iteration cycles which are called “Sprints” are only a few weeks long and involve customer and management feedback at the end of each session to mark the main points of the actual sprints. Requirements are continuously evaluated, and priorities are changed depending on customer involvement. Cooperative responsibility, daily reporting, multiple quick iterations, and volatility in requirements adjust the Agile methodology a significant organizational conversion (Mahadevan, Kettinger, & Meservy, 2015).
• Traditional methodologies assume that customers are not capable of arranging their future requirements. In this case, developers need to provide extra functionalities to meet these unexpected future needs. This generally leads to the overdesigned system. Briefly, in traditional methodologies, developers require a detailed specification at the beginning of the project.
• Agile methodologies assume that both customers and developers don’t have a complete understanding of requirements when the project starts. In agile methodologies, customers and developers need to learn together about the system requirements throughout the project. Basically, in the Agile development process evolves in time.
3. METHODOLOGY
In management theory, there is no uniform approach to define the central concept (Dresner, 2008). Because of that, the methodology of this study is related to the creation of organizational and economically associated enterprise performance management system to provide global wide enterprise performance analysis. Since the primary objective is the development of the methodology to create a new artefact to solve the problem of the company, design science research methods are the most appropriate elements to finalize this progress from top to bottom. At this point artefact building, approaches will be used to support the primary outcome.
This exploratory case study was exercised at the group company to reveal the success performances of the building of an Embedded Enterprise Performance Management software. This study aims to comply with the criteria of relevance, applicability, and specificity, as proposed by Cheng(1983). The integrity of organization research and practice also be taken into consideration as Loebbecke(2016) presented.
Presented Group Company is selected because the organization is trying to implement the first ERP level EPM solution with an embedded approach for the very first time. Because of that the process itself, vulnerable to propose challenges and difficulties. The company does not have any Business Intelligence department but has a big shared financial services team which is mainly working with spreadsheets.
Table 3.1: Methodology Overview
According to methodology, the first three steps are already covered at Section 1 and Section 2 which are presented above. Remaining steps will be covered below:
3.1. A
NALYZE ANDD
ESIGN THES
YSTEMAnalysis of the system and work structure is done by the Technical Team and Project Team. Group Company wants to implement a planning and budgeting tool to accomplish business goals at a planning level, integrated with reviewed processes that can be more aligned with the benefits that can be achieved by the tool. SAP BPC optimized for S/4HANA is ready to interact and communicate with SAP S/4HANA using the same infrastructure, taking advantage of other tools as Analysis for Office. (Kilaru, Sharma, Ayuluri, & Darla, 2016). SAP BPC is also providing embedded consolidation which is considered as future development regarding this project.
Group Company is present in 21 countries with 28 fully owned companies.
Observe and Evaluate the System Build the Prototype Analyze and Design the System Literature Review Define Objectives of Solution Identify Problem and Motivate
This document is prepared to present all details regarding with all processes that are defined and major solution definitions related to Planning implementation. It is also included that how business processes are supported by the system.
The planning and budgeting process in scope: • Project Revenues and Cost Planning • HR Planning
• CAPEX Planning • Other OPEX Planning
• Financial Statements Planning (Profit & Loss, Balance Sheets, and Cashflow)
The current planning model is based on Excel sheets. For each planning process, Group Company resources use Excel file where they can introduce the planning values. Those files are not integrated, and there are a lot of time-consuming processes. It is also mandatory that whenever there are changes, files need to be created/updated with a line (e.g., new account; new cost center). There is no master plan to connect between different planning sheets (i.e., don’t have any business rule to link the Balance Sheet with P&L).
3.2. B
UILD THEP
ROTOTYPEFigure 3.1 represents the planning and budgeting process to be implemented in a functional perspective. It represents the concept of the planning model.
The optimization of the current budget and planning process, as the premise of a new sustainable, scalable and transversal process for the group is split into five different steps:
1. Planning preparation → manual operations for a new planning cycle as define, adjust master
data and exchange rate definition;
2. Top-down goals & guidelines → introduced by top-level Group Company
administration/direction, it reflects the main goals of the organization;
3. Forecast & Budget → forecast calculation for the time periods of non-actual data of the current
year and the introduction of planning data for operational and financial budgeting;
4. Financial and Operational Reporting → Reporting figures based on planning data introduced;
5. Planning Control Execution → Reports for Real vs. Planning control during the current year.
The planning and budgeting process will be done in two different perspectives: • In S/4HANA;
• In BPC.
Figure 3.2: Planning and Budgeting Approach
The Project Revenue and Cost Planning and CAPEX Planning will be done in S/4HANA environment, using existing process planning tool on standard ERP. The HCM Planning, Other Opex (Cost Center planning), Intercompany Recharges and Financial Statements Model (Finance Planning) will be developed using BPC embedded tools. The picture below illustrates those two perspectives divided into three stages:
B1
→
Planning in S/4HANA B2→
HCM Planning in BPCB3
→
Intercompany Recharges and Finance Planning in BPCFigure 3.3: Forecast & Budget Process
Figure 3.4: The legend of Figure 3.3
3.3. A
SSUMPTIONS ANDL
IMITATIONSDuring the project, some assumptions were made to keep the efficiency of the process high and complexity low. Beside assumptions, there were limitations as well.
First, top-down goals and guidelines are delivered by business/region. These guidelines are taken as main process flow materials and given to the responsible users to execute the Planning and Budgeting processes.
On the other hand, the company is IFRS compliant regarding the accounting structure. During the meetings, the purpose of EPM and Planning & Budgeting clarified by the technical team to other shareholders. According to main goals and new performance strategy, by the request of the group company, accounting elements are adjusted from regular account numbers to collective “*999” account numbers. Because of that planning and budgeting structure is developed to be processed only in “*999” collective version of accounts. These accounts will be called Planning Accounts.
The last, intercompany recharges for planned data will not be calculated automatically by the system because of the unstructured financial environment of the Group Company. To maintain this, each related transaction will be inserted from Cost Center Planning and Profit Center Planning with their trading partner information accordingly.
As a limitation, SAP BPC 10.1 needed to be used. Because SAP BPC 11.0 was not released yet for the specific time of the project but was announced with all specifications.