António Guevara Ferreira Exposto Rodriguez Lopez
Licenciado em Bioquímica
Phototermal therapy using gold nanoparticles
Dissertação para obtenção do Grau de Mestre em Bioquímica para a Saúde
Orientador: Pedro Miguel Ribeiro Viana Baptista, Professor Doutor, FCT/UNL
Setembro, 2017
António Guevara Ferreira Exposto Rodriguez Lopez
Licenciado em Bioquímica
Phototermal therapy using gold nanoparticles
Dissertação para obtenção do Grau de Mestre em Bioquímica para a Saúde
Orientador: Pedro Miguel Ribeiro Viana Baptista, Professor Doutor, FCT/UNL
Júri:
Presidente: Prof.ª Doutora Maria Teresa Nunes Mangas Catarino Arguente: Prof. Doutor João Carlos dos Santos Silva e Pereira de Lima Vogal: Prof. Doutor Pedro Miguel Ribeiro Viana Baptista
Faculdade de Ciências e Tecnologias, Universidade Nova de Lisboa
Phototermal therapy using gold nanoparticles
Copyright © António Guevara Ferreira Exposto Rodriguez Lopez, Faculdade de Ciências e Tecnologia, Universidade Nova de Lisboa.
A Faculdade de Ciências e Tecnologia e a Universidade Nova de Lisboa têm o direito, perpétuo
e sem limites geográficos, de arquivar e publicar esta dissertação através de exemplares impressos
reproduzidos em papel ou de forma digital, ou por qualquer outro meio conhecido ou que venha
a ser inventado, e de a divulgar através de repositórios científicos e de admitir a sua cópia e
distribuição com objetivos educacionais ou de investigação, não comerciais, desde que seja dado
ACKNOLOWDGEMENTS
Ludwig Wittgenstein once said that knowledge is in the end, based on acknowledgment,
and he was not far from the truth. This all year was an indescribable journey, a kind of
roller-coaster, full of ups and downs, a series of incidents that lead me to the opposite
extremes of horror and ecstasy.
I hereby want to express my gratitude to you all, all the people that contributed to this
work, without them this thesis would not come to the light of day, or even started. I am
afraid that words could not be enough to express my thankfulness, but here it goes. I
would like to especially thank to:
Professor Pedro Viana Baptista, my supervisor, for all the opportunities he gave me
throughout the year; for all the guidance, the time, the mighty advices; for all the help he
gave me in my scientific and academic growth; and most of all for trusting in me. I am
sincerely thankful.
Professor João Sottomayor for all the assistance with the densitometer and pycnometer,
as well as the willingness to receive me in his office and answer all my questions.
Professor João Carlos Lima to arrange 5 minutes to talk to me, even when ill, and pointing
me the right direction when I was not entirely sure of what to do to reach my goal.
Professor Madalena Dionisio for the precious help as well as the availability for
answering any doubts that came out throughout the experiments with the Differential
Scanning Calorimetry.
Professor Alexandra Fernandes, Professor Jaime Mota, Professor Carlos Salgueiro and
Professor Mario Diniz for the kindness, and all the support and advices along this year.
Professor Manolis Matzapetakis and Professor Antonio Baptista for not allowing me to
lose hope in my ideas, and Professor Ricardo Louro to be an inspiration. I always remember one of your most iconic phrases:” NMR can save almost all the problems in the World”
be always available to help me when I was in need of help.
All the members of lab 315 and 319, the one’s that inspired and motivated to go there (Fábio Carlos and Bruno Veigas); the one’s there were there and gave me all the support
they could: Milton Cordeiro, Fabiana Paradinha, Raquel Vinhas, Ana Sofia, Catarina
Rodrigues, Luis Raposo, Vanessa Silva, Andreia Carvalho, Ana Silva, Letícia Fialho,
Cinthia Barroco, Catarina Brás, Rita Gomes, Miguel Padilha, Mariana Cunha, Rita
Fernandes; the one’sthat left and finally the one’s that our paths crossed each other even
for a brief moment in time, Suzilaine and Inês Martins, I did not forget you. A special
thanks to Cindy Oliveira, Beatriz Coelho and Filipa Correia, you were my light, my
guiding star, sometimes with just a smile (you give so many, in a few seconds…). I have
not got enough words in my vocabulary for you, you are so damn special!
The Photochemistry group (Verónica Simões, Andreia Forte, André Seco, Ana Lúcia,
Marcos) for making me feel like I was at home when I spent all afternoons at the DLS.
My friends (spread across the globe), for always being there, for the advice and endless
support and motivation that gave me, not only throughout the year but through life. I could
name persons but they are too many and I do not want to particularize, all of you were
and are special in my mind and in my heart.
My family for all the faith, the love, the strength and support, for being my rock.
Especially for my parents that put up with me in my darker and annoying moments.
My colleagues, for all the things they taught me.
To Daniela, for entering my life when I did not know I needed you.
You all are the epitome that in life if you do your path alone, you go faster, but if you go
together, you go further. My path was long, hard, but I never gave up, thanks to you all.
“A life without challenges is not worth living.” Socrates
“You can know the name of a bird in all the languages of the world, but when you're finished, you'll know absolutely nothing whatever about the bird... So let's look at the bird and see what it's doing -- that's what counts. I learned very early the difference between knowing the name of something and knowing something.”
Richard P. Feynman
“We did not ask for this room or this music. We were invited in. Therefore, because the dark surrounds us, let us turn our faces to the light. Let us endure hardship to be grateful for plenty. We have been given pain to be astounded by joy. We have been given life to deny death. We did not ask for this room or this music. But because we are
here, let us dance.”
RESUMO
O cancro é uma das principais causas de morte em todo o mundo. Tal mortalidade
deve-se, maioritariamente, não à patologia em si, mas aos efeitos colaterais dos tratamentos existentes
como a quimioterapia e a radioterapia. De forma a ultrapassar os problemas de falta de
seletividade e especificidade das terapias existentes, novas alternativas encontram-se atualmente
em investigação.
A terapia fototérmica usa a luz para induzir calor localmente, levando à morte celular. As
células cancerígenas são mais vulneráveis ao aumento de temperatura devido ao fraco
fornecimento de sangue e à falta de dissipação de calor. Geralmente, esta terapia emprega
radiação infravermelha próxima permitindo uma penetração profunda nos tecidos e evitando a
sua absorção por parte de certas biomoléculas como a hemoglobina. Comparando com as terapias
convencionais, a terapia fototérmica revela vantagens únicas na terapia do cancro, incluindo alta
seletividade e especificidade e mínima invasividade.
As nanopartículas de ouro possuem propriedades óticas, eletrónicas e térmicas únicas
para a terapia fototérmica. Além disso, estas são fáceis de sintetizar em meio aquoso e podem ser
facilmente funcionalizadas com uma ampla gama de biomoléculas. Modulando os parâmetros
geométricos e físicos destas nanoestruturas, como a forma e o tamanho, os picos de ressonância
plasmónica das nanopartículas de ouro podem ser sintonizados para a região do infravermelho
próximo ou na região visível. Ao usar radiação de luz com uma frequência que se sobrepõe
fortemente à banda de absorção do plasmão das nanopartículas, pretende-se que o procedimento
de conversão fototérmica possa ser altamente eficiente.
O objetivo deste trabalho prende-se com a caracterização fototérmica de nanopartículas
de ouro com diferentes tamanhos com o intuito de utilização futura na ablação fototérmica de
células cancerígenas. A síntese e a funcionalização de nanopartículas de ouro com diferentes
tamanhos foram realizadas com sucesso. Usando os ensaios de calorimetria, concluiu-se que as
nanopartículas de ouro com um revestimento de PEG têm uma capacidade de conversão
fototérmica maior do que aquelas com cobertura de citrato e que as nanopartículas de ouro
menores são mais eficientes a converter luz em calor do que as maiores.
ABSTRACT
Cancer is one of the leading causes of mortality worldwide. The fact that most people do
not actually die from the cancer itself, but from the side effects of the conventional treatments
(e.g. chemotherapy and radiation) has led scientists to find new therapies that can surpass the
problem with lack of selectivity and specificity.
Nanotechnology is still a field in development but it could overcome these problems. It
offers great potential in the biomedical field, in imaging, diagnostics, and therapy.
Photothermal therapy uses light to induce heat that leads to cell death. Cancer cells have
proven to be more vulnerable to increase of heat due to poor blood supply and lack of heat
dissipation. Generally this therapy employs near infrared radiation, which allows deep tissue
penetration, thus allowing the evasion of absorbance of biomolecules (e.g. hemoglobin).
Comparing conventional therapeutic modalities, photothermal therapy shows unique advantages
in cancer therapy including high selectivity and specificity, and minimal invasiveness.
Gold nanoparticles possess unique optical, electronic and thermal properties for
photothermal therapy. Moreover, they are easy to synthetize in aqueous media and can be easily
functionalized with a wide range of biomolecules. Modulating the geometric and physical
parameters of nanostructures such as shape and size, the plasmon resonance peaks of gold
nanoparticles could be tuned to the near-infrared region or the visible region. By using light
radiation with a frequency that strongly overlaps the nanoparticle plasmon absorption band, the
aim is that the photothermal conversion procedure could be highly efficient.
The purpose of this work was to perform a photothermal characterization of gold
nanoparticles with different sizes with the perspective of downstream application to photothermal
ablation of cancer cells. Synthesis and functionalization of gold nanoparticles with different sizes were performed successfully. Using calorimetry it was concluded that “PEGylated” gold nanoparticles have higher photothermal conversion capacities than the ones with a citrate capping,
and that smaller gold nanoparticles are more efficient in converting light to heat than the bigger
ones.
TABLE OF CONTENTS
ACKNOLOWDGEMENTS………...VII
RESUMO………..XIII
ABSTRACT………...XV
FIGURE INDEX………...XXI
TABLE INDEX………...XXV EQUATIONS INDEX……….XXV ACRONYMS AND LIST OF ABBREVIATIONS……….….XXVII
LIST OF SYMBOLS….………XXVII
1. INTRODUCTION…..………...1
1.1. Cancer: An overview……….1
1.2. Nanotechnology……….2
1.3. Gold nanoparticles……….3
1.3.1. Synthesis and functionalization………...3
1.3.2. Properties of gold nanoparticles………...5
1.3.3. Applications………6
1.4. Photothermal therapy..………..7
1.5. Scope of the thesis……….9
2. MATERIALS AND METHODS……….11
2.1. Equipment, materials and reagents………..11
2.2. Synthesis of gold nanoparticles………12
2.3. Gold nanoparticles characterization……….14
2.3.1. Uv-visible spectroscopy………14
2.3.1.1. Haiss at al. approximation………14
2.3.2. Dynamic Light Scattering………...15
2.3.3. Transmission electron microscopy………....15
2.4. Gold nanoparticles functionalization………...15
2.4.1. Functionalization with polyethylene glycol………...15
2.4.1.1. Ellman’s assay………...16
2.5. Laser irradiation………...17
2.5.1. Water and PBS………...18
2.5.2. DMEM culture media (with and without phenol red)………18
2.5.3. Egg white………...18
2.5.4. Cell culture………18
2.6.1. MTS assay………..19
2.7. Size and shape separation of gold nanoparticles………...20
2.8. Density measurement………...21
2.8.1. Tensiometer………...21
2.8.2. Pycnometer………22
2.9. Differential scanning calorimetry………23
3. RESULTS AND DISCUSSION….……….25
3.1. Gold nanoparticles………...25
3.2. Characterization of gold nanoparticles………26
3.2.1. UV-visible characterization………...26
3.2.2. Dynamic light scattering characterization……….27
3.2.3. TEM characterization………28
3.3. Scattering and absorption with different lasers………...29
3.4. Functionalization and characterization………29
3.5. Stability of gold nanoparticles……….30
3.6. Calorimetry………..31
3.6.1. Water……….31
3.6.1.1. Behavior of citrate capped gold nanoparticles in water………...31
3.6.1.2. Behavior of “PEGylated” gold nanoparticles in water………32
3.6.2. PBS………33
3.6.2.1. Behavior of citrate capped gold nanoparticles in PBS………..33
3.6.2.2. Behavior of “PEGylated” gold nanoparticles in PBS………34
3.6.3. DMEM………..34
3.6.3.1. Behavior of citrate capped gold nanoparticles in DMEM (with phenol red)………35
3.6.3.2. Behavior of “PEGylated”gold nanoparticles in DMEM (with phenol red)………36
3.6.3.3. Behavior of citrate capped gold nanoparticles in DMEM (without phenol red)………36
3.6.3.4. Behavior of “PEGylated” gold nanoparticles in DMEM (without phenol red)………37
3.6.4. Egg white………...37
3.6.4.1. Behavior of citrate capped gold nanoparticles in egg white……….37
3.6.4.2. Behavior of “PEGylated” gold nanoparticles in egg white………....38
3.7. Elimination of polidispersivity………40
3.8. Density assessment………..41
3.9. Differential scanning calorimetry analysis………...42
3.10. Photothermal yield………43
3.11. Cell assays………...44
4. CONCLUSIONS AND FUTURE WORK……….……….47
5. REFERENCES….………...49
6. APPENDICES...………..55
Appendix A……….55
Appendix B……….56
Appendix C……….60
Appendix D……….63
Appendix E………..64
FIGURE INDEX
Figure 1: Relative changes in age-standardized cancer incidence rates in both sexes for all cancers
in 195 countries or territories from 2005 to 2015………1
Figure 2: Richard Feynman on Caltech giving his lecture “There’s plenty room at the bottom”………...2
Figure 3: Stained glass containing gold nanoparticles in Troyes cathedral in France……….2
Figure 4: Different moieties that could be attached to the surface of a gold nanoparticle………...4
Figure 5: A) The effect of opsonins in bared gold nanoparticles. B) The effect of opsonins in “PEGylated” gold nanoparticles……….4
Figure 6: Schematic of the localized surface plasmon resonance on gold nanospheres. Upon illumination at resonant wavelengths, the conduction band electrons of the gold nanoparticles’ surface are delocalized and undergo collective oscillation. ………5
Figure 7: Current gold nanoparticle-based therapeutic approaches………7
Figure 8: Steps of future photothermal therapy……….9
Figure 9: Synthesis setup……….………12
Figure 10: Scheme that sums up the synthesis of different generations of gold nanoparticles ………..13
Figure 11: Expected correlation between generations and diameter of gold nanoparticles ………...………...14
Figure 12: Ellman’s assay reaction scheme………..………..16
Figure 13: A) Thermocouple used for the calorimetry experiments. B) Principle of measurement of thermocouple (Seebeck effect)……….17
Figure 14: Setup of each 96 well plate……….………...19
Figure 15: Principle of MTS assay. Tetrazolum salts (yellowish color) are reduced to formazan (purpleish color) by NADH Dehydrogenase (complex I of respiratory chain) in the presence of metabolic active cells...20
Figure 16: Elimination of polidispersivity: size (A) and shape (B) separation of gold nanoparticles ………...21
Figure 17: Used tensiometer to assess the densities of the different media...……….22
Figure 18: Pycnometer used for measuring the densities of the different media ………...23
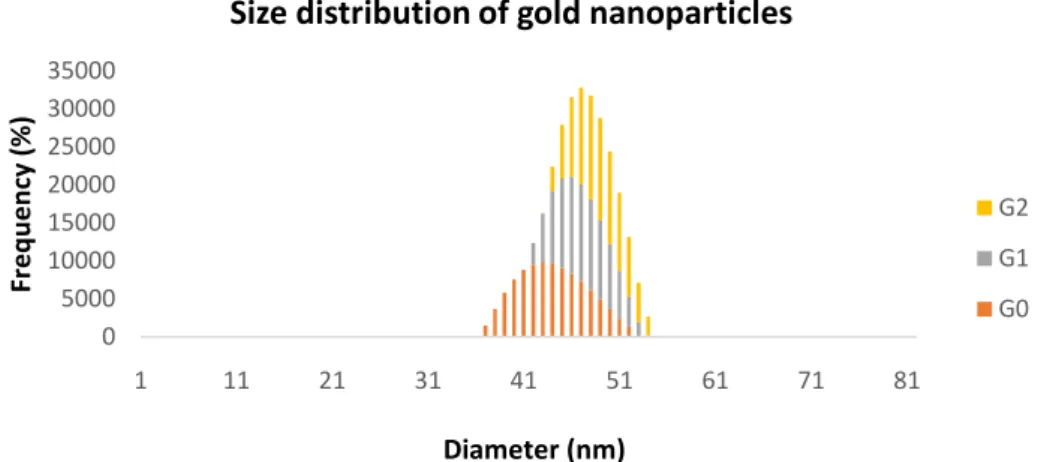
Figure 20:Different generations of the first synthesis of gold nanoparticles (from left to right: G0, G1, G2, G3 and G4)………26 Figure 21: Absorbance spectra of the different generations (G0, G1 and G2) of gold nanoparticles……….26 Figure 22: Size dispersion of the different generations (G0, G1 and G2) of gold nanoparticles determined through Dynamic Light Scattering……….28
Figure 23: TEM images of different generations of gold nanoparticles: a) G0 b) G1 c)
G2.………28
Figure 24: HPLC tube containing the same gold nanoparticles exposed to green and red light..29 Figure 25: Absorbance spectra of gold nanoparticles with a citrate and PEG capping...30
Figure 26: Stability test of “PEGylated” gold nanoparticles in PBS using different dilutions…31 Figure 27: Calorimetry results of citrate capped gold nanoparticles with a concentration of 0.4 nM and 1 nM in water...32
Figure 28: Calorimetry results of “PEGylated” gold nanoparticles with a concentration of 0.4 nM and 1 nM in water………..32 Figure 29: Calorimetry results of citrate capped gold nanoparticles with a concentration of 0.4 nM and 1 nM in PBS……….33 Figure 30: Calorimetry results of “PEGylated” gold nanoparticles with a concentration of 0.4 nM and 1 nM in PBS...34
Figure 31: Calorimetry results of citrate capped gold nanoparticles with a concentration of 4 nM and 10 nM in DMEM (with phenol red), using the laser in continuous and pulsed mode………35 Figure 32: Citrate capped gold nanoparticles in DMEM (phenol red): a) monodisperse (33 nm) b) aggregated (15 nm)………...35 Figure 33: Calorimetry results of “PEGylated” gold nanoparticles with a concentration of 4 nM and 10 nM in DMEM (with phenol red), using the laser in continuous and pulsed mode……..36
Figure 34: Calorimetry results of citrate capped gold nanoparticles with a concentration of 4 nM and 10 nM in DMEM (without phenol red), using the laser in continuous and pulsed mode ………..36 Figure 35: Calorimetry results of “PEGylated” gold nanoparticles with a concentration of 4 nM and 10 nM in DMEM (without phenol red), using the laser in continuous and pulsed mode…..37 Figure 36: Calorimetry results of citrate capped gold nanoparticles with a concentration of 4 nM and 10 nM in eggwhite, using the laser in continuous and pulsed mode
………..38
and 10 nM in eggwhite, using the laser in continuous and pulsed mode ………..38 Figure 38: Absorbance spectra of different gold nanoparticles with a citrate capping, before and after calorimetry...39
Figure 39: Absorbance spectra of different “PEGylated” gold nanoparticles, before and after calorimetry...39
Figure 40: Size separation of citrate capping gold nanoparticles (15 nm) through
centrifugation………....40
Figure 41: Size separation of citrate capping gold nanoparticles (35 nm) through centrifugation ………...41 Figure 42: Graphic elucidation of how to calculate specific heat...42 Figure 43: Comparing results of calorimetry with 15 nm citrate capping and “PEGylated” gold nanoparticles in HCT116 cells...45
Figure 44: MTS results of assay with 15 nm citrate capping and “PEGylated” gold nanoparticles in HCT116 cells………45 Figure 45: Molar extinction coefficient for the diameters of the gold nanoparticles…………..55 Figure 46: SZ-100 Horiba software – Condition Settings: Particle/Dispersion Medium window……….56 Figure 47: SZ-100 Horiba software – Condition Settings: Measurement window………57 Figure 48: SZ-100 Horiba software – Condition Settings: Calculation window………...58 Figure 49: SZ-100 Horiba software – Condition Settings: Calculation window, sub-window Advanced……….59 Figure 50: (A) Graphic of heat flow as a function of temperature in PBS. By doing the punctual tangent in the selected area, a graphic of specific heat as a function of temperature is obtained (B)……….60 Figure 51: (A) Graphic of heat flow as a function of temperature in DMEM (with phenol red). By doing the punctual tangent in the selected area, a graphic of specific heat as a function of temperature is obtained (B)………..61 Figure 52: (A) Graphic of heat flow as a function of temperature in DMEM (without phenol red). By doing the punctual tangent in the selected area, a graphic of specific heat as a function of temperature is obtained (B)………..62 Figure 53: Representative 1H NMR spectrum of PEG (with a thiol end) in deuterated solvent with
TABLE INDEX
Table 2.1: Equipment………..11
Table 3.1: Summary of the results given by all the different techniques used to characterize the gold nanoparticles…...29 Table 3.2: Difference in half-width before and after centrifugation, using 2 different sizes of
AuNPs………...41
Table 3.3: Density measurements using a tensiometer and pycnometer………...41 Table 3.4: Specific heat measurements using differential scanning calorimetry……...43 Table 3.5: Photothermal yield summary………..44
EQUATIONS INDEX
Equation 1……...14
Equation 2………...14
Equation 3………...17
Equation 4………...18
Equation 5………...19
Equation 6………...27
Equation 7………....63
ACRONYMS AND LIST OF ABBREVIATIONS
Abs Absorbance
AuNPs Gold Nanoparticles
AuNPs@Citrate Gold Nanoparticles with citrate capping AuNPs@PEG Gold Nanoparticles with PEG capping
CW Continuous Wave mode
DSC Differential Scanning Calorimetry
DLS Dynamic Light Scattering
DMEM Dulbecco’s Modified Eagle Medium DTNB 5,5’-dithio-bis(2-nitrobenzoic) acid
GLP Good Laboratory Practices
HD Hydrodynamic Diameter
LDI Laser Diode Intensity
LSPR Localized Surface Plasmon Resonance
NIR Near Infra-Red
PEG Polyethylene glycol
PI Polydispersity Index
PTT Photothermal Therapy
Pul Pulsed mode
ROS Reactive Oxygen Species
RT Room Temperature
SD Standard Deviation
SDS Sodium Dodecyl Sulfate
SPR Surface Plasmon Resonance
TEM Transmission Electron Microscopy UV-Vis Ultraviolet-Visible
List of symbols
C Concentration
Cp Specific heat
I0 Initial light intensity
I Light intensity after it passes through the sample
l Optical path
ρ (rho) Density
1. INTRODUCTION
1.1. Cancer: An overview
Since the birth of Mankind, disease has been a common denominator throughout
all generations. The arise of new and worse illnesses has led Mankind to seek a way to
cure all misfortunes that affect all his similar in order to restore hope and “stability” to
our lives.
Diagnosis and treatment are two crucial factors in keeping people healthy. To
attain this, it is paramount to make a diagnosis as early as possible and perform a highly
selective and specific treatment, with no side effects.
According to the World Health Organization (WHO) recent reports, cancer is the
second leading cause of mortality worldwide, with 8.8 million deaths only in 2015 (in
Figure 1 is possible to see cancer incidence around the World from 2005-2015). Almost 1 in 6 deaths is due to cancer. In the past year (2016), 1,685,210 new cancer cases and
595,690 cancer deaths were estimated to occur in the United States. And the issue is
far-off from being solved. The global cancer rates could increase by 50% by 2020, and it is
expected to rise by about 70% over the next 2 decades [1-3].
Although remarkable progress has been made in the last 50 years, we are not close
to understanding the molecular mechanisms of this disease, as well as the search for new
approaches of treatment that rely on selectivity and specificity concerning cancer cells.
[2,3] This is where nanotechnology enters. It offers a great diversity of tools that can be
very helpful for cancer diagnostics and therapy [2, 3].
1.2. Nanotechnology
The concept of nanotechnology was first (indirectly) raised by Richard Feynman
in a talk entitled “There’s plenty of room at the bottom” in an American Physical Society
meeting at Caltech in 1959 (Figure 2) [5,6]. Nowadays, it can be defined as the study and
manipulation of materials with dimensions between 1 and 100 nanometers [7].
Nanomaterials have been used, even though inadvertently, since ancient times. A great
example is the use of gold nanoparticles (AuNPs) in medieval cathedrals’ stained glass
windows (Figure 3) [3, 8-9].
It was just in the last decade that the interest on these materials has emerged, due
to their outstanding electrical, optical, and chemical properties, high stability and
biological compatibility, controllable morphology and size dispersion, easy surface
functionalization, as well the wide-range of applications they present [10-11]. The feature
that makes nanomaterials stand out from their bulk materials is the high
surface-area-to-volume ratio, which makes them a tool that offers great potential in the biomedical field,
in imaging, diagnostics, and therapy [12, 13]. The most common bioapplications that have
been used so far are labeling, delivering, heating, sensing, and detection, using several
approaches, such as gene delivery, tumor targeting, or drug delivery, especially in cancer
therapeutic [14, 15]. Examples of these nanomaterials are: carbon nanotubes, quantum
dots, dendrimers and noble metal nanoparticles [16]. This thesis will focus on the
applications of the later.
Figure 2: Richard Feynman on Caltech giving his lecture “There’s plenty room at the bottom”.
http://www.kurzweilai.net/there-s-plenty-of-room-at-the-bottom (1/07/2017).
Figure 3: Stained glass containing gold nanoparticles in Troyes cathedral in France.
1.3. Gold Nanoparticles
AuNPs have been extensively studied and applied in several concepts of
nanotheranostics (the use of nanotechnology for the diagnostic and therapy of different
diseases), due to their unique optical, electronic, thermal and physical properties [17]. In
the following subsections, it will be outlined some important aspects about these
nanomaterials, like the synthesis, functionalization, properties and applications. This is
important to perceive the importance of this work, due to the fact that gold nanoparticles
are the core of what will be done next.
1.3.1. Synthesis and functionalization
In 1857, Faraday synthesized colloidal gold nanoparticles for the first time by
reducing gold chloride with phosphors [6]. Almost 100 years after, Turkevich et al.
simplified the method by using sodium citrate as reducing agent [18]. Since then, a wide
variety of papers have been published about the subject. These mentioned different
reduction agents, diverse capping agents, different sizes, different shapes, resulting in the
end in solutions with different stabilities, and with higher or lower monodispersivity [19,
20]. Here are a few examples of the different procedures of AuNPs’ synthesis: Schmid
method, Brust–Schiffrin method and seed mediated growth method [21]. The size and
shape of AuNPs is determined mainly by salt concentration, temperature, nature of
capping agents, and rate of addition of reactants [22, 23].
Gold nanoparticles can be easily functionalized with a wide range of (bio)
molecules (Figure 4). In order to do that, several methods have been devised. In spite of
the fact that each technique has its specific purposes (due to its unique characteristics),
the main goal is to increase the stability and affinity of AuNPs to biological molecules,
as well as to use them as drug carriers into the cells with increased specificity. Gold
nanoparticles are usually functionalized with one or a combination of biomolecules such
as polyethylene glycol (PEG), peptides, tumoral markers, polymers, drugs, fluorescent
dyes, oligonucleotides (i.e. siRNA, ssDNA), antibodies. All of them are easily attached
Figure 4: Different moieties that could be attached to the surface of a gold nanoparticle. Adapted from [11].
In Nanomedicine, the ability to easily render a biological function to inorganic
nanostructures is of utmost importance [26]. Using citrate stabilized gold nanoparticles
can make that possible. Since citrate interactions with gold are weak (adsorption),
functionalization with biomolecules is generally easy through amine and thiol groups that
interact strongly with gold (chemisorption) [27].
Giersig and Mulvaney first described the first robust gold nanoparticles by
stabilizing them with thiolates using the strong bond between the soft gold acid and the
soft thiolate base. Due to the fact that thiol groups bind to gold surfaces with high affinity,
most frequently thiol modified ligands are used as stabilizing agents which bind to the
surface of the AuNPs by formation of gold-sulfur bonds [28].
In this work, PEG (with a thiol end) was used to functionalize the AuNPs. “PEGylation” of nanoparticles is one of the most used methods. This hydrophilic and flexible polymer increases the stability and half-life of the gold nanoparticles (thus
obtaining long circulating nanoparticles), and provides a very good biocompability with
the human body. PEG creates a “hydration shell” surrounding the nanoparticle,
preventing therefore opsonin-nanoparticle interaction (Figure 5), which is the first step
of the recognition by the immune system. As for toxicity, it is diminished only in certain
sizes [29, 30].
Figure 5: A) The effect of opsonins in bared gold nanoparticles B) The effect of opsonins in “PEGylated” gold nanoparticles [30].
1.3.2. Properties of gold nanoparticles
The most remarkable physical property of AuNPs is their size, which affects their
surface-area-to-volume ratio and colloidal stability in solution [8]. It was Faraday that
first stated that gold nanoparticles possess a reddish color due to its size. Since that
moment, the interaction between light and AuNPs has been a target of interest [31].
When matter interacts with light, several phenomena occur. Light can be
absorbed, scattered (i.e. Raman or Rayleigh scattering) or absorbed and re-emitted (i.e.,
fluorescence). In the presence of gold nanoparticles all these phenomena are strongly
enhanced due to the unique interaction of light with the free electrons on their surface.
Since light wavelength and nanoparticles are at the same scale, when gold nanoparticles
are exposed to it, its electromagnetic field causes a collective and coherent oscillation of
the conduction-band electrons at the surface of the nanoparticles, forming instantaneous
dipoles. This phenomenon is called Surface Plasmon Resonance (SPR) [Figure 6] [8, 32].
Figure 6: Schematic of the localized surface plasmon resonance on gold nanospheres. Upon illumination at resonant wavelengths, the conduction band electrons of the gold nanoparticles’ surface are delocalized and undergo collective oscillation [33].
The SPR frequency is dependent on the type of the metal, the size and shape of
the metal nanoparticles, the dielectric constant of the surrounding medium. This
dependence enables the possibility of tuning the optical properties of these
nanostructures. When the size increases, the SPR maximum slightly redshifts. This
red-shift also occurs when the nanoparticles form assemblies or aggregates, but in these case
it is to the Near Infra-red (NIR) region. Changing the shape from a sphere to a rod, the
absorptionspectrum splits into two bands: a stronger long-wavelength band in the NIR
region due to the longitudinal oscillation of electrons and a weaker short-wavelength band
Furthermore, the addition of salt and changes in pH leads to an increase of
instability of the colloid, due to fact that there is a change in the dielectric constant of the
media, momentary dipoles are generated at the nanoparticles’ surface, reducing the
repulsion between them and promoting their irreversible aggregation. Aggregated
nanoparticles behave as bigger nanoparticles despite the fact that they are not chemically
bonded. The solution acquires a blueish appearance. This occurs because when AuNPs
are close enough, they change their optical properties, behaving as single bigger particles
and shifting the SPR band to longer wavelengths. This ability to change color when
aggregation happens is quite remarkable, and it is has been used extensively in diagnostic
tests [32, 36-38].
1.3.3. Applications
Currently the most successful cancer treatment method usually involves invasive
processes including chemotherapy, radiation, surgery or a combination of these.
Surgery has the purpose of physically remove the tumor, howbeit this is not
always feasible [21, 39]. As for chemotherapeutic drugs, they have significant side effects
due to its toxicity to normal cells. Another important fact is that cancer cells can develop
resistance to these drugs. As for radiotherapy, the use of high energy ionization particles
(X-rays, gamma rays or electrons) to damage cell and tissue at a molecular level to
eradicate remaining cancer cells, it can cause damage to the healthy tissues close to the
cancer cells, in the path of the radiation beam or in the surroundings (bystander effect)
[21, 39-40].
Tremendous efforts have been devised by scientists and physicians to enhance
these traditional treatments. Howbeit, selective methods are still required which can harm
cancer cells hardly without destroying the healthy tissue [40].
Over the last decade researches have made many efforts to use AuNPs for cancer
treatment. It is demonstrated that gold nanoparticles have an immense potential to
As to the currently available gold nanoparticle-based therapeutic approaches
(Figure 7), they can be classified into four main types [41]:
(1) Photothermal therapy (PTT): minimally invasive treatment method in which photon energy is converted to thermal energy in order to induce
cell death [41].
(2) Photodynamic therapy: consists in the selective destruction of targeted cells by a combination of light and light sensitive drug known as photosensitizers [41].
(3) Radiotherapy: consists in enhancing the radiosensitivity of cancer cells using kilovoltage or megavoltage energies [41].
(4) Drug delivery: AuNPs act as vectors for delivery of molecular cargo into a target [41].
This thesis is focused on the study and characterization of the potential of gold
nanoparticles to do photothermia with the perspective of doing photothermal therapy.
Figure 7: Current gold nanoparticle-based therapeutic approaches [41].
1.4 Photothermal therapy
The use of heat to treat illnesses has been a habit for ages. According to History,
in 1700 B.C., a glowing tip of a firedrill was used to treat breast cancer. Thermal therapy
has proven to be a good alternative to conventional oncological approaches. Heating
ultrasound waves have been used to induce moderate temperature rise in a specific target
region to destroy the cancer cells, clinically termed as hyperthermia. However, they all
present a problem of destroying the tumors selectively. For a successful thermal therapy,
hyperthermia should be confined to the target tumors without harming surrounding
healthy tissues [21, 31].
Neoplastic cells were shown to be more vulnerable to temperature elevation than
normal tissue cells. Studies have shown that laser power threshold required to kill the
cancerous cells was less than half of that required to kill noncancerous cells. This happens
because of their reduced heat tolerance compared to normal tissue, which is due to their
poor blood supply. Moreover, the heat dissipation through blood flow in tumors is less
effective than in normal tissue, which may contribute to a higher rise in temperature in
tumor cells than in normal ones [21, 31].
Administration of AuNPs in cancer tissues followed by laser irradiation can offer
the advantage of less-invasive and effective modality over the conventional treatment
methods, as it combines a minimal systemic toxicity, rapid and effectiveness of heat
deposition with a highly selective destruction of tumor cells [21, 31].
The photothermal properties of gold nanoparticles have been studied by Link and
El-Sayed, who have shown that the photoexcitation of metal nanostructures results in the
formation of a heated electron gas that subsequently cools rapidly (in approximately1
picosecond) by exchanging energy with the nanoparticle matrix. This is succeeded by
phonon–phonon interactions where the nanoparticle lattice cools down quickly by
exchanging energy with the surrounding medium. This rapid energy conversion and
dissipation can be put to use for the heating of the local surroundings by using light
radiation with a frequency that strongly overlaps the nanoparticle SPR absorption band.
The intense SPR-enhanced absorption of AuNPs makes the photothermal conversion
procedure highly efficient [21, 31, 42].
Photothermal therapy generally employs near infrared (NIR) radiation. The light
absorption efficiency of AuNPs in the near-infrared region is high which allows deep
tissue penetration. Furthermore, it is possible to avoid the absorbance (Abs) of
biomolecules such as hemoglobin [21, 31, 42-43].
Gold nanoparticles have been used with different purposes based on their heating
effects under laser irradiation due to the enhanced absorption induced by localized surface
parameters of nanostructures such as shape and size, the plasmon resonance peaks of
AuNPs could be tuned to the near-infrared region or the visible region [21, 32, 42-43].
Many researchers have focused on the photothermal therapy of gold nanoparticles
with different size and morphology, such as gold nanorods, gold nanostars, gold
nanorings, gold nanocages, and hollow gold nanoshells [41].
Since spherical AuNPs exhibit their surface plasmon resonance in the visible
region, prospects for in vivo photothermal therapy has become restricted only to shallow
depths due to the high tissue absorption at visible wavelengths. Excitation of spherical
AuNPs with the appropriate wavelength that overlaps with their plasmon resonance
absorption band in the visible range has the advantage of using lower power laser and
hence searching for photothermal treatment protocol with the aim of lowering laser power
could present a great advantage for achieving selectivity by targeting only tumor cells
[21, 31, 42-43].
Moreover, irradiating AuNPs at their plasmon resonance absorption band may
require a relatively low concentration of particles to be delivered and consequently
prevent possible side effects resulting from high accumulations of nanoparticles at
various body organs. The in vitro success of photothermal efficiency of AuNPs in the
visible range near its plasmon resonance absorption can potentially be extended to in vivo
applications of skin and surface type cancers [21, 31, 42-43]. Figure 8 illustrates what
can be possibly the future steps of photothermal therapy.
Figure 8: Steps of future photothermal therapy. https://chembites.org/2017/04/26/plasmonic-photothermal-therapy-pptt-using-gold-nanoparticles/ (1/07/2017).
1.5. Scope of the thesis
Therefore, the purpose of the thesis is to perform a photothermal characterization
downstream application to photothermal ablation of cancer cells. Specifically the
following steps are needed:
Synthesis and characterization of stable and monodisperse gold nanoparticles
from 14 nm up to 70 nm in diameter;
Functionalization with PEG;
Calorimetry studies in different media; Assess the photothermal yield;
2. MATERIALS AND METHODS
2.1. Equipment, materials and reagents
Table 2.1: Equipment
Equipment model Company
UV-Vis Spectrophotometer UV Mini-1240 Shimadzu, Germany
UV-Vis Spectrophotometer Evolution 300 Thermo Scientific, USA
DLS, Nanoparticle Analyzer, SZ-100 Horiba Scientific, Japan
TEM, Hitachi 8100 Hitachi, São Paulo
Fiber coupled laser system fcw 532-8 w CNI-laser, China
Sigma 3-16K Centrifuge Sartorius, Germany
Sigma 1-14 Mini-Centrifuge Sartorius, Germany
Ultrasonic bath S 10 H Elmasonic, Germany
Shaker GLF 3016 Buch & Holm, Denmark
Infinite M200 Microplate Reader Tecan, Switzerland
KSV Sigma 702 Tensiometer Lichfield, United Kingdom
Fortuna 43 Pycnometer Wertheim. Germany
Differential Scanning Calorimeter Q2000 New Castle, USA
Materials
Current laboratory material;
Quartz absorption cell – 105.202-QS (Hellma, Germany);
Polystirol/Polystirene cuvette (SARSTEDT, Germany);
Tissue Culture Testplate (96 wells) [SPL LifeSciences);
Thermocouple (Digital Multimeter);
Green Laser Pointer (Commercial);
RC Laser Pointer (Commercial).
Chemical reagents
Sodium citrate tribasic dihydrate, ≥ 99 % (Sigma-Aldrich, USA),
[HOC(COONa)(CH2COONa)2.2H2O; MW 294,10 Daltons];
Gold chloroauric acid 99,999 % (Sigma-Aldrich, USA), [HAuCl4, MW 339.785
Daltons);
Daltons);
Polyethylene glycol (PEG) [O-(2-Mercaptoethyl)-O’-methyl-hexa(ethylene glycol],
(Sigma-Aldrich, USA), [C15H32O7S, MW 356.48 Daltons];
Sodium Dodecyl Sulfate (SDS) [Sigma-Aldrich, USA, NaC12H25SO4, MW 288.38
Daltons];
5,5′-Dithiobis(2-nitrobenzoic acid) [DTNB], (Sigma-Aldrich, USA, C14H8N2O8S2, MW
396.35 Daltons);
Phosphate buffer (H4NaO5P, MW 137.992 Da) - Prepared by the addition of 288.55 mM
of Sodium phosphate dibasic (Sigma-Aldrich, USA, Na2HPO4, MW 141.96 Da) and
211.45 mM of Monosodium phosphate (Sigma-Aldrich, USA, NaH2PO4,MW 119.98
Daltons);
Phosphate buffer saline (Cl2H3K2Na3O8P2, MW 411.029 Daltons);
MTS (Promega, USA);
Sucrose (Sigma-Aldrich, USA), [C12H22O11, MW 342.30 Daltons).
Media
Dulbecco's Modified Eagle Medium (DMEM) with color (Phenol red – pH indicator) and without color (Thermo Fisher Scientific, USA);
Egg white (commercial).
2.2. Synthesis of gold nanoparticles
The optimized protocol of Bastús et al. was used [26]. All glass materials used for
the synthesis of AuNPs were previously immersed in aqua regia overnight and later
washed with Milli-Q water (18.2 MΩ.cm at 25 °C) and desionized water.
1. In a 250 mL round bottom flask, 150 mL of 2.2 mM Sodium Citrate were brought
to a boil while in reflux and vigorously stirring during 15 minutes (Figure 9);
2. When it starts to boil, it was added 1 mL of 25 mM HAuCl4;
3. The color of the solution changes from yellow to a bluish grey and then to a soft
pink in 10 minutes, approximately;
4. The reaction vessel was then cooled down till the temperature of the solution was
90 ºC;
5. 1 mL of 25 mM HAuCl4 was added twice to the solution, in periods of 30 minutes
in order to make the seeds;
6. To each generation there is needed 3 additions of chloroauric acid (in a total time
of 1h 30 min). The following figure elucidates the process (Figure 10);
7. Between generations there is needed a dilution. It was extracted 55 mL of sample
to another flask and it was 2 mL of 60 mM Sodium Citrate and 2 mL of ultrapure
water.
Figure 10: Scheme that sums up the synthesis of different generations of gold nanoparticles [26].
There is a relation between generations, size and concentration of AuNPs (Figure
11). The initial aim was to synthesize bigger gold nanoparticles, 30, 60, 90 and maybe 120 nm of diameter, approximately. Note that the concentration of AuNPs does not suffer
Figure 11: Expected correlation between generations and diameter of gold nanoparticles [26].
2.3. Gold nanoparticles characterization
2.3.1. UV-visible spectroscopy
Several absorbance spectra were taken using a Ultra-Violet – Visible (UV-Vis)
spectrophotometer in order to characterize the AuNPs.
2.3.1.1. Haiss et al. approximation
Using the method developed by Haiss et al. [44], it was possible to calculate an
approximation of the size in diameter of the AuNPs and its concentration. The following
procedure was taken:
After taking the Absorbance spectrum take note of the values at 450 and 520 nm; Calculate the quotient of Abs520/Abs450;
Substitute the value (y) in the following equation;
𝑦 = 0,335 ln 𝑥 + 0.7301 Equation 1
The value of x corresponds to the approximate diameter of the gold nanoparticles; In the table in Appendix A, search for the Molar extinction coefficient that
corresponds to the calculated diameter;
Using Lambert-Beer law, calculate the concentration
𝐶 =𝐴𝑏𝑠450
2.3.2. Dynamic light scattering
The hydrodynamic diameter of AuNPs was determined by Dynamic Light
Scattering (DLS). The analysis was performed at 25 ºC, with a scattering angle of 90º,
using water as medium of dispersion. A volume of 500 μL of AuNPs was first stabilized
for 3 minutes and then the samples were measured. DLS analysis was performed at
Departamento de Quimica, at the group of Photochemistry (FCT-UNL). During the
thesis, a protocol was optimized and it can be seen in Appendix B.
2.3.3. Transmission electron microscopy
This was a provided service. Samples of AuNPs were sent to Instituto de Ciência
e Engenharia de Materiais e Superfícies (ICEMS/IST), Portugal, for Transmission
Electron Microscopy (TEM) analysis. The samples with a volume of 100 µL were
deposited in the grids and then air dried. TEM was performed with a HITACHI H-8100
microscope operated at 200 kV.
Particles size and shape were determined by analyzing the TEM pictures in house
using the imaging software Fiji.
2.4. Gold nanoparticles functionalization
2.4.1. Functionalization with polyethylene glycol
AuNPs were functionalized with a commercial hetero-functional polyethylene
glycol modified with a thiol group at one end. The purpose is to fully saturate the surface
of the nanoparticles. The functionalization was done by using the protocol of Conde et al
[45].
Firstly, in order to find out the appropriate concentration of PEG to functionalize
the nanoparticles, a range of PEG concentrations between 0.001-1mg.mL-1 was added to
a fixed concentration of gold nanoparticles (10 nM) and SDS (0.028 % (v/v) in aqueous
medium. Then, the solutions were incubated for 16 hours at room temperature (RT) with
continuous stirring on a shaker. Later, excess PEG was removed by centrifugation (three
times, 14,000g, 30 min, and 4 °C) and the supernatants were removed to new tubes and
replaced by ultrapure water. The three resultant supernatants were also centrifuged once,
2.4.1.1 Ellman’s assay
Ellman’s assay is based on the reaction between free PEG’s thiol groups presented in the supernatants with DTNB (also known as Ellman’s reagent), which results in a
yellow solution [46, 47].
The Ellman’s reagent reacts with a thiol leading to the formation of a thiol-TNB adduct and a concomitant release of one equivalent of 5-thio-2-nitrobenzoic
acid (TNB) [Figure 12]. Quantification of the thiols is based on the released TNB which
can be measured spectrophotometrically at 412 nm with a molar absorptivity of 14,150
M-1 cm-1 at a neutral pH [46, 47].
One of the major problems of quantification by spectrophotometry is the
interference by compounds which exhibit absorption at the measured wavelength, a
phenomenon often encountered with a biological sample and already noticed for the Ellman’s spectrophotometric method [46, 47].
Figure 12: Ellman’s assay reaction scheme [46].
For this purpose, on a 96 well-plate, 200 μL of the supernatants, 100 μL of 0.5 M phosphate buffer pH 7.0 and 7 μL of DTNB (2 mg/mL) prepared in 0.5 M phosphate buffer pH 7.0 were mixed. In order to interpolate the absorbance results into PEG
concentrations, a calibration curve was also prepared under the same conditions that were
described above, but instead of 200 μL of the supernatants, 200 μL of known
concentrations of PEG (range of 0-160.5 mg.mL-1) were used. Following 5 min, the
absorbance was measured from 290 nm to 600 nm in a microplate reader. Thus, the
2.5. Laser irradiation
Using the green laser to irradiate a sample of 200 µL each time, during 180
seconds, with a laser diode intensity (LDI) of 2.7 Amperes, in triplicates, following the
manual of good laboratory practice (GLP).
A thermocouple (Figure 13A) was used to measure the temperature before and
right after the irradiation. The measurement is based on the Seebeck effect (Figure 13B).
A thermocouple consists of two wires of different metals joined together at one end, called
the measurement ("hot") junction. As for the other end, where the wires are not joined, is
connected to the signal conditioning circuitry traces, usually made of copper. This
junction between the thermocouple metals and the copper traces is called
the reference ("cold") junction.
Figure 13: A) Thermocouple used for the calorimetry experiments. B) Principle of measurement of thermocouple (Seebeck effect). http://akeinc.com/news/how-thermocouples-work (15/07/2017)
The voltage produced at the reference junction depends on the temperature at both
junctions (measurement and reference). Since the thermocouple is a voltage differential
device rather than an absolute temperature measurement device, it is required that the “cold” junction can measure the temperature with great accuracy.
In the end, a ∆∆T is obtained (Equation 3). It is a ∆∆T instead of a ∆T because the control is taken into account. The results are also represented as a function of ∆∆T versus concentration because the formula of heat transfer (Equation 4) depends of other
variables like the mass and the specific heat of the medium.
𝑄 = 𝑚 𝑥 𝐶 𝑥 ∆∆T Equation 4
2.5.1. Water and PBS
A concentration range between 0.1 and 1 nM of AuNPs in water and Phosphate
buffered saline (PBS) was used to test the calorimetry. It was used gold nanoparticles
with citrate capping (AuNPs@Citrate) and with PEG capping (AuNPs@PEG).
2.5.2. DMEM culture medium (with and without phenol red)
Due to the fact that the medium absorbs a considerable amount of energy, and that
was already seen previously, the green laser was used in two modes:
- Continuous Mode (CW)
- Pulsed (3 seconds pulses)
Moreover, these two modes contribute to the production of reactive oxygen
species (ROS). However, it is stated in the literature that in continuous mode the amount
of produced ROS is much higher (contributing also to the damage of proteins that absorb
in the visible, like cytochrome) [49].
The parameters stood the same. The major differences were the concentration of
samples used, between 1 nM and 10 nM. It was also used AuNPs@citrate and
AuNPs@PEG.
2.5.3. Egg white
Due to the problems with the viscosity of egg white, measures were taken in order
to bypass the problem. The eggwhite of an egg was put into a 50 mL falcon (depending
on the egg the volume is around 35 mL) and it was added ultrapure water in order to make
up a final volume of 45 mL. Finally, a spin was done in the vortex with the purpose of
homogenize the solution.
The parameters of measurement were the same as mentioned above. Samples of
200 µL, 180 seconds of irradiation, using an intensity of 2.7 Amperes. The concentrations
used were of 4 nM and 10 nM.
2.5.4. Cell culture
The experiment was done with HCT 116 cell line (Homo sapiens colon colorectal
carcinoma) with the help of MSc. Rita Mendes. In order to do the irradiation in cells, first
colored DMEM media (supplemented) in a 96 well plate (setup in Figure 14). Next, this
plate is put into a greenhouse at 37 ºC during 24 hours. Then, the middle was carefully
withdrawn from each well, leaving the adherent cells in the bottom of the well. Next, 100
µL of DMEM without color (supplemented) was added to the wells that had only cells,
and two solutions with the concentration of 10 nM of AuNPs with different cappings
(Citrate and PEG) in DMEM without color (supplemented) were added.
The plate was then put into a greenhouse at 37 ºC. Then, after 2 hours of
incubation, the middle was withdrawn and replace with fresh DMEM media. The
irradiation was done using the same parameters as before, but only in continuous mode.
Figure 14: Setup of each 96 well plate.
2.6. Assessment of cell viability
2.6.1. MTS assay
MTS assay is a very sensitive colorimetric method to assess metabolic activity, as
well as being used as a cytotoxic assay. It can be used to infer the numberof viable cells.
MTS tetrazolium salt is reduced into formazan, a converted aqueous, soluble product by
dehydrogenase enzymes present in metabolically active cells (Figure 15) [50]. The
quantity of formazan produced is directly proportional to the number of viable cells and
so, the cell viability can be obtained according to the following formula:
𝑉𝑖𝑎𝑏𝑖𝑙𝑖𝑡𝑦 (%) =𝑚𝑒𝑎𝑛 𝑜𝑓 𝐴𝑏𝑠 𝑜𝑓 𝑡𝑟𝑒𝑎𝑡𝑚𝑒𝑛𝑡 𝑔𝑟𝑜𝑢𝑝𝑚𝑒𝑎𝑛 𝑜𝑓 𝐴𝑏𝑠 𝑜𝑓 𝑐𝑜𝑛𝑡𝑟𝑜𝑙 𝑔𝑟𝑜𝑢𝑝 𝑥 100 Equation 5
Figure 15: Principle of MTS assay. Tetrazolium salts (yellowish color) are reduced to formazan (purplish color) by NADH Dehydrogenase (complex I of respiratory chain) in the presence of metabolic active cells.
2.7. Size and shape separation of gold nanoparticles
In order to reduce the polidispersivity of the synthesized gold nanoparticles
throughout size and shape separation, a protocol was done based on the experiments of
Wu et al. and Kumar et al (Figure 16) [50, 51]:
Prepare a centrifugation tube of 2 mL with 4 layers of sucrose (30% - 60%);
Insert 200 uL of AuNPs;
Centrifuge to 4000g during 20 minutes;
4 fractions were obtained;
Separate each fraction in a different tube;
Centrifuge each fraction to 30000g during 5 minutes in order to remove the sucrose;
Ressuspend in a 0.1 % solution of SDS.
This process is called density gradient centrifugation. This work was done with the
help of PhD Fábio Carlos, PhD Bruno Veigas and MSc. Rita Mendes.
A size separation can also be done (but was not performed during this work):
Insert each fraction in a well of a 0.9 % Agarose gel in 1x TBE buffer (pH = 9);
Run the gel for 1 hour at 100 V:
Cut the bands separately;
Dissolve each one in Milli-Q water at 90 ºC;
Centrifuge at 9000 g for 5 minutes to remove the agarose;
Figure 16: Elimination of polidispersivity: size (A) and shape (B) separation of gold nanoparticles [50].
2.8. Density measurement
The density (ρ) is an elementary physical property of matter. It is stated, for a
homogeneous object, that the density is defined as the ratio of its mass m to its volume
V. It is influenced by the thermal expansion of materials, as well as its physical state. For
liquids, the 2 of the most popular methods of density measurement are:
- Tensiometer
- Pycnometer
2.8.1. Tensiometer
The density of PBS, DMEM (with phenol red) and DMEM (without phenol red)
was measured using samples of 25 mL with a KSV Sigma 702 Tensiometer (Figure 17). The concept of measurement is based on the Archimedes’ principle. Using a sphere attached to a cable (with known mass), and immersing it on a liquid of known
volume, it is possible to calculate the density, knowing that the mass of the sphere is
different when submerged in the liquid.
The analysis was performed at Departamento de Quimica (FCT-UNL) with the
Figure 17: Used tensiometer to assess the densities of the different media.
2.8.2. Pycnometer
The density of PBS, DMEM (with phenol red) and DMEM (without phenol red)
was measured using samples of 25 mL with a Fortuna 43 Pycnometer. The pycnometer
(or specific gravity bottle) [Figure 18] is a glass flask with a close-fitting ground glass
stopper with a fine hole through it, that enables the measurement of density with great
accuracy. The needed steps are as following (the weightings were done in triplicate):
Weight the empty pycnometer;
Fill the pycnometer with distilled water;
Weight the pycnometer;
Know we know the mass of water inside de pycnometer (𝑚1):
Check the temperature (checking a table, you know 𝜌1):
Dry very well the pycnometer, use compressed air and acetone;
Fill the pycnometer with the unknown sample;
Weight the pycnometer.
Know we know the mass of the liquid inside the pycnometer ( 𝑚2).
So, equalizing the volumes (25 mL), we know the density.
𝑚1 𝜌1 =
𝑚2 𝜌2
The assessment was performed at Departamento de Quimica (FCT-UNL) with
Figure 18: Pycnometer used for measuring the densities of the different media.
2.9. Differential scanning calorimetry
The specific heat (Cp) of PBS, DMEM (with phenol red) and DMEM (without
phenol red) was assessed using a Differential Scanning Calorimeter. In order to perform
that analysis, the following steps are needed:
1) Weight the pan (Figure 19a) in an analytical balance (one with 5 decimal places);
2) Insert a drop of the sample (one medium at a time) in the pan;
3) To know the exact weight of the sample, seal the pan with a sealing press (Figure
19b);
4) Introduce the pan in the Calorimeter (Figure 19c). The reference pan is already
inserted (Figure 19d);
5) Insert the data obtained through the weighting (pan and sample masses) and the
following parameters in the Calorimeter:
1: Sampling interval 0.10 s/pt
2: Data storage On
3: Equilibrate at 40.00 °C
4: Ramp 1.00 °C/min to 20.00 °C
5: Isothermal for 1.00 min
6: Mark end of cycle 1
7: Ramp 1.00 °C/min to 30.00 °C
8: Isothermal for 1.00 min
9: Mark end of cycle 2
11: Isothermal for 1.00 min
12: Mark end of cycle 3
13: Ramp 1.00 °C/min to 30.00 °C
14: Isothermal for 1.00 min
15: Mark end of cycle 4
16: Ramp 10.00 °C/min to -50.00 °C
17: Isothermal for 1.00 min
18: Mark end of cycle 5
19: Ramp 10.00 °C/min to 40.00 °C
20: Isothermal for 1.00 min
21: Mark end of cycle 6
22: Equilibrate at 40.00 °C
23: Data storage Off
The measurement was performed at Departamento de Quimica (FCT-UNL) in the
laboratory of dielectric relaxation spectroscopy and differential scanning calorimetry,
with the help of Professor Madalena Dionísio and PhD Teresa Cordeiro.
Figure 19: a) An exemplar of a pan used in Differential Scanning Calorimetry. b) Hydraulic press used to close the lids. c) Used Differential scanning calorimeter to calculate the specific heat of the different media d) Place where are inserted the pans: 1 – Reference pan 2 – Sample pan.
a)
d) b)
c)
3. RESULTS AND DISCUSSION
3.1. Gold nanoparticles
Generally, gold nanoparticles are synthesized in water by the chemical reduction
of Au3+ derivatives to neutral gold atoms (Au0), using a reducing agent. There is also a
need of a capping and/or stabilizing agent in order to prevent the aggregation of the
particles, and also to control the growth and size of nanoparticles [9, 20, 22].
The growth of nanoparticles involves 2 steps: the “Focusing period”, where the mean radius of the particles increases and the size distribution narrows, and the “Ostwald ripening”, which is characterized by the increase of heterogeneity of sizes in the solution. Factors like temperature, ionic strength, time of the reaction and the stoichiometry of
reactants and its order of addition determine the size of AuNPs [26].
There are many different protocols for the synthesis of gold nanoparticles.
However, the simplest one available was established by Turkevich et al. in 1951 (based
on work done by Faraday) and refined by Frens in the 1970s. This method allows the
synthesis of monodisperse and spherical gold nanoparticles with a size around 10 - 20 nm
in diameter. It uses a gold salt, chloroauric acid (HAuCl4) and sodium citrate as both
reducing and capping agent [9, 20, 22].
Larger particles can be produced with the previous reactants. If the amount of
added sodium citrate is diminished, the amount of the citrate ions available for stabilizing
the particles is lower, leading to the coalescence of the small particles still present in
solution, until the total surface area of all particles becomes small enough to be covered
by the existing citrate ions. This all come with a price, the sacrifice of the monodispersity
and the shape of the AuNPs. That is why it is used more than 1 reducing agent (e.g.
hydroquinone) [9, 20, 22].
In the present work, the method developed Bastús et al. was used to produce big
and stable AuNPs. The reactants are exactly the same as the Turkevich method, but the
order of addition is different. First, the sodium citrate is heated and then the gold is added.
Keeping the temperature at 90 ºC and adding the gold at a steady rate allows the shift of
the equilibrium of the reaction to the focusing period and leads to the formation of bigger
nanoparticles (through the formation of oval particles and the nucleation of the smaller
ones) [26].
different generations of the first synthesis.
Figure 20: Different generations of the first synthesis of gold nanoparticles (from left to right: G0, G1, G2, G3 and G4).
It is important to outline that the second and third synthesis were used to do the
experimental work.
3.2. Characterization of gold nanoparticles
3.2.1 UV-visible characterization
The colloidal solutions of gold nanoparticles were characterized by the use of
Ultraviolet-Visible (UV-Vis) spectroscopy, Dynamic Light Scattering (DLS), and
Transmission Electronic Microscopy (TEM).
Like stated before, the LSPR is a very important optical property of AuNPs. By
performing analysis of the SPR absorption band, important information can be extracted
about the particles, such as their size, shape, concentration and dispersion state, thus
making this technique a valuable tool for the characterization of these nanomaterials [52].
In the next figure (Figure 21), it is possible to perceive the spectra of the different
generations of AuNPs of the second synthesis.
Figure 21: Absorbance spectra of the different generations (G0, G1 and G2) of gold nanoparticles.
0 0.2 0.4 0.6 0.8 1
400 450 500 550 600 650 700 750 800
A b sor b anc e Wavelength (nm)
DIfferent generations of AuNPs@Citrate
G0 G1 G2
λSPR = 531 nm
λSPR = 537 nm


![Figure 7: Current gold nanoparticle-based therapeutic approaches [41].](https://thumb-eu.123doks.com/thumbv2/123dok_br/16472936.731778/35.892.279.638.603.938/figure-current-gold-nanoparticle-based-therapeutic-approaches.webp)