Work Project Report
“How to improve Banco Santander Brasil business model by
analyzing opportunities of Cross Sell”
NOVA School of Business and Economics
Sofia Alexandra Amaro Góis Mausinho Raposo |CEMS MIM 278
1
Contents
Executive Summary ... 2
Abbreviation Index ... 3
1. Business Project Context ... 4
a. Banco Santander S.A... 4
b. From Banco Santander’s Current Situation to BP Challenge ... 4
c. Market Overview... 6 d. Summary of Conclusions/Findings ... 6 Trade Finance ... 6 Foreign Exchange ... 7 Derivatives ... 8 Cross-selling targets ... 9
2. Reflexion on the Business Project ... 9
a. Originality, Evolvement and Limitations ... 9
b. Alternative Approach ... 12
3. Reflection on Learning ... 18
a. Previous Knowledge ... 18
Masters’ Content Applied ... 18
Masters’ Content Adjusted ... 19
b. New Knowledge ... 20
Methodologies and Frameworks ... 20
c. Personal Experience ... 20
Key Strengths & Weaknesses ... 20
Develop Areas of Improvement ... 21
d. Benefit of Hindsight ... 22
4. Appendix ... 23
2
Executive Summary
Before 2008, several companies in Brazil hold derivative products for speculative purposes. When the global financial crisis hit Brazil, these companies were force to declare financial bankruptcy as they were not able to satisfy its obligations. As a side-effect, the lack of trust that spread over the Brazilian financial market led to lower the demand for derivative products after 2008. Consequently, our client’s revenues and profitability were also affected.
Our client, Banco Santander Brasil, entered the Brazilian market in 1957 and from then on the bank has been growing through strategic acquisitions to become the 5th biggest bank operating in the Brazilian FX and Derivatives. To react to the current market conditions, the bank developed the Business Project: “How to improve Banco Santander Brasil business model by analysing opportunities of cross sell”.
The team approached the problem based on a methodology called “Acquisition Pattern Analysis”. As major findings of the methodology applied, the team identified a total of 669 clients, from which 505 were exclusively buying products from the FX department and 164 were exclusively TF’s clients. These clients constitute the potential cross-selling targets because they frequently hold positions FX or Credit Loans with the bank although they are not establishing any FX hedging contracts within the derivative’s department. Certainly, these clients may be hedging their position with a different bank or may not be hedging them at all. Either way, they represent potential cross-selling clients for Santander.
Finally, within this report I approached the problem under a different perspective by exploring the circumstances that impeded the bank from benefiting from cross-selling. In fact, the framework reviewed,“A Framework for Creating Value through Interunit
Collaboration” (Hansen and Nohria, (2004)) conceptualizes collaboration, explores its
value and suggests possible practices for companies to enhance team-work. By applying this framework, I concluded that the bank was failing on promoting team-work and collaboration across departments and this fact explained why the bank was missing cross-selling opportunities. The main conclusion regards Santander’s incentives schemes which, I believe, fail to align the incentives of the bank with the employees.
3
Abbreviation Index
BCB = Brazilian Central Bank
CAGR= Compounded Average Growth Rate
CNAES = Classificação Nacional de Atividades Econômicas CNPJ = Cadastro Nacional da Pessoa Jurídica
FX = Foreign Exchange
GBM = Global Banking & Markets GDP = Gross Domestic Product TF= Trade Finance
4
1. Business Project Context
a. Banco Santander S.A.
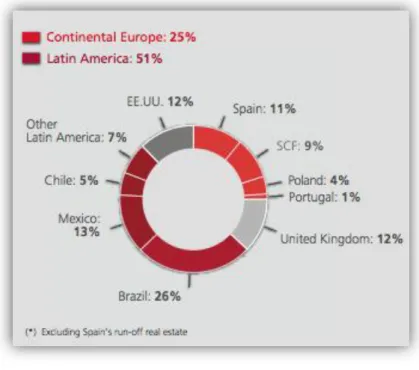
Santander was founded in Santander, Spain in 1857. It is the biggest European bank and among the top 15 banks worldwide1. Santander had market capitalization of 55.2 billion EUR at the end of the first quarter 2013. The bank’s shares are listed on the stock exchange of Madrid, Buenos Aires, Lisbon, London, Mexico, Milan, New York, and Sao Paulo and are featured on 62 different indices. By the end of 2012 Santander employed 193,000 employees worldwide. Santander operates in a large variety of markets worldwide, although it’s most important markets are Continental Europe and Latina America, accounting for 76% of its operating profit, Appendix - Figure 1. Brazil is the biggest market with a stake of 26% of the overall profit in Q1 2013 (Santander, 2013A).
Santander entered the Brazilian market in 1957 and its subsidiary Santander Brasil is the main full-service bank in Brazil, headquartered in Sao Paulo, and employs 54,406 employees. Although its 3,784 branches are located across the whole country, the highest density is present in the South and South – East area. Through strategic acquisitions the bank has been able to increase its market share and to become the 5th biggest bank operating in the Brazilian FX and Derivatives market. Appendix - Figure 2, presents a general market share overview per region.
b. From Banco Santander’s Current Situation to BP Challenge
Before 2008, several companies in Brazil hold derivative products for speculative purposes. As a consequence, when the global financial crisis hit Brazil, these companies were force to declare financial bankruptcy as they were not able to satisfy its obligations. But those were not the only effects of the crisis. Indeed, the lack of trust that spread over the Brazilian financial market led to lower the demand for derivative products after 2008. Not exceptionally, Santander Brasil faced a decline on the demand for its derivative products affecting its financial performance. Indeed, clients swift their preferences from more complex, higher risk-return products to simpler, plain-vanilla financial products. This fact hugely impacted the bank’s financial performance because complex derivative products have a higher profit margin than simpler plain vanilla products.
5
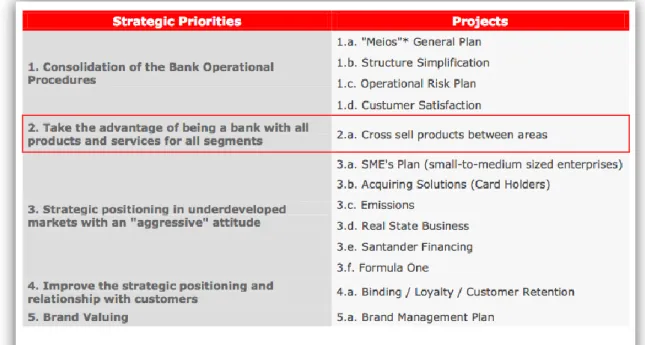
The scope of the Business Project: “How to improve Banco Santander Brasil business model by analysing opportunities of cross sell”, is part of a bigger sustainable growth project developed within the bank and named Project 3.1. Project 3.1 aims at leading Santander to become the first bank for its customers within the next three years. Project 3.1’s business plan consists of four different strategic priorities, Appendix - Figure 3. Hence, the Business Project was set to target the second priority: “Take the advantage of being a bank with all products and services for all segments” (Santander 2013). It was further defined that this goal should be reached by exploring cross-selling opportunities of financial products across three different areas of the bank: the FX, Trade Finance and Derivatives’ departments. In fact, the ultimate objective of the Business Project is to increase Santander Brasil’s market share by increasing revenues from the treasury and loan products (Derivatives, Trade finance and FX).
Additionally, the focus of this project was the bank’s corporate clients segment due to the enormous potential of this segment and its importance for the bank’s strategy. Nevertheless, these goals should be reached by a better understanding of their clients’ needs. Indeed, the bank is aware of the need to develop a sustainable relationship with its clients, offering products that better suit with their operational necessities.
Departing from the fact that the Trade Finance, FX, and Derivatives sales’ departments focusing exclusively on their own products and clients, the team, together with the project coaches, developed a preliminary approach to the problem that comprised three main activities:
1) Gather databases from the Trade Finance, FX, and Derivatives departments. 2) Cross analyse the databases, looking for synergies between products.
3) Propose an action plan for Sales forces.
Afterwards, the team developed each of the above points and established a dead-line for its accomplishment. Each stage of development had its own challenges: gathering the data bases was a bureaucratic process because the different departments had to make sure that confidentiality would be preserved. On the other hand, the second stage was definitely intellectually challenging due to the complexity of the transactions operated in these departments. Finally, the last stage was certainly the most important has it would make a bridge between the team’s analysis and findings and its applicability on day-to-day operations.
6
c. Market Overview
To successfully implement the developed action plan it is of upmost importance to understand how the Brazilian macroeconomic situation is expected to evolve in the future. Since the macroeconomic variables and consequently the entire Brazilian economy influences the demand for Santander Brasil’s products. Thus, the team looked at three macroeconomic indicators: the gross domestic product (GDP), the exchange rate and the Brazilian trade balance.
Firstly, Brazil’s GDP growth rate drastically decreased in 2009 as a result of the outbreak of the global financial crisis, it recovered in 2010, but decreased in the following years again. Nevertheless, the Monetary International fund suggests that GDP will grow at a rate of 3% over the next six years, motivated by private consumption, governmental expenditures and a positive and growing trade balance (exports minus imports). Secondly, Brazilian exporters and importers’ companies generate cash flows in different currencies and thus, are exposed to currency exchange rate risk, “a possible direct loss or indirect loss in the firm’s cash flows, assets and liabilities, net profit and, in turn, its stock market value from an exchange rate move” (IMF, 2006). This exposure led companies to increase its demand for financial products that could hedge the mismatch between its operational revenues’ currency and its operational cost’s currency. Thus, the presence of FX risk in one of the main reason for the development of the derivatives market in Brazil. Thirdly, trade balance is defined as: “The difference between exports and imports of goods and services“(OECD, 2005). Literature shows that Brazil changed from a country with higher imports than exports to the opposite. It is of high importance to see that both import and export increased their stake of the GDP over the last two years. This is the basis for an increase in demand for hedging tools. The importance of Brazil in world trade has been increasing, ranking number 22 in exports and 21 in imports in 2011, the highest scores in the Brazilian history (World Trade Organization, 2012).
d. Summary of Conclusions/Findings
In this section I will present a summary of the major findings per department: Trade Finance
Trade Finance’s main products are Adiantamento a Exportação, a credit line that aims at financing exporters operations prior the product’s exportation; BNDES Exim, a loan
7
conceded by the Brazilian Development Bank to help companies financing its investments; Financiamento a Importação, a collateralized credit line that aims at financing importations; Loans asset, a collateralized loan; and Pré-Pagamento a Exportação, a credit loan that aims at pre-pay companies’ exports.
In 2010, Trade Finance product’s portfolio relied solely on the BNDES Exim loan. In 2011, the bank started offering Loans Asset and Pré-Pagamento a Exportação. In 2012, the most significant products were Financiamento a Importação, R$12 Million, and Pré Pagamento, R$19 Million. Moreover, across years, profit margins tended to shrink due to the governmental policies and regulation on these financial products, Appendix - Figure 8.
Concerning Trade Finance clients’ distribution by industries, in 2012, the 7th largest industries (in terms of volume generated and out of 30 Industries) represented 61% of total Trade Finance volume, indicating that volume is highly concentrated in a few set of industries: Agropecuária (R$625 Million), Usinas (R$606 Million), and Quimica e Petroquimica (R$530 Million). Moreover, the most profitable industries were Quimica e Petroquimica, (4.1%) Usinas (1.8%) and Maquinas e Equipamentos (3%), Appendix - Figure 9. Furthermore, we believe that the differences in the industries’ profit margins are mainly motivated by the industry risk profile and product needs.
On the other hand, under a regional analysis, corporate clients are mainly located in the South regions of Brazil: SP, Sudeste and Sul represented 78% of 2012 total TF volume (R$4,253 Million) - Appendix - Figure 10. Indeed, when combined together, these regions represented 70.6% of the Brazilian GDP in 2012.
Overall, due to the close relationship between location and industries we believe that by targeting clients from different industries, the TF department would also be able to disperse its regional concentration.
Foreign Exchange
FX’s main products are Financeiro Compra (FC) and Exportação (EXP), non-deliverable and non-deliverable domestic currency at spot rate, respectively; Financeiro Venda (FV) and Importação (IMP), non-deliverable and deliverable foreign currency at spot rate, respectively.
8
In opposition to Trade Finance product’ mix evolution, FX products’ range did not vary substantially across years. Indeed, FX revenues grew organically from 2010-2012 at a CAGR of 17.6%- Appendix - Figure 11.
After clustering FX’s clients in industries, it was possible to understand each industry performance. In 2012, Transporte e Logistica and Comércio Atacadista have been the industries with the highest traded volumes. Moreover, the 6th biggest industries represented 48% of total FX volume in 2010; 51% in 2011 and 40% in 2012, indicating a high concentration of volume in few industries, Appendix - Figure 12.
Finally, when analysing FX Corporate Clients’ location across the country: SP, Sudeste and Sul represented 50% of 2012 total FX volume (R$26,326 Million). Plus, Multinacionais represented 25% of total volume in 2012. Despite representing 13% of the Brazilian GDP, Nordeste only represents 3% of Santander’s volume, Appendix - Figure 13.
Derivatives
The most important derivative products are SWAP, Termo or NDFs, and Options. SWAPs are derivative products that enable the yield between two financial instruments to be swapped; NDF or Non-Deliverable Forwards is a forward contract in which two counterparties agreed on a NDF price or rate to be settled in the future (maturity of the contract) as opposed to the prevailing spot price or rate; Options are contracts which gives the owner the right but not the obligation to buy or sell un instrument or underlying asset at an agreed price, the strike price at or before the maturity date.
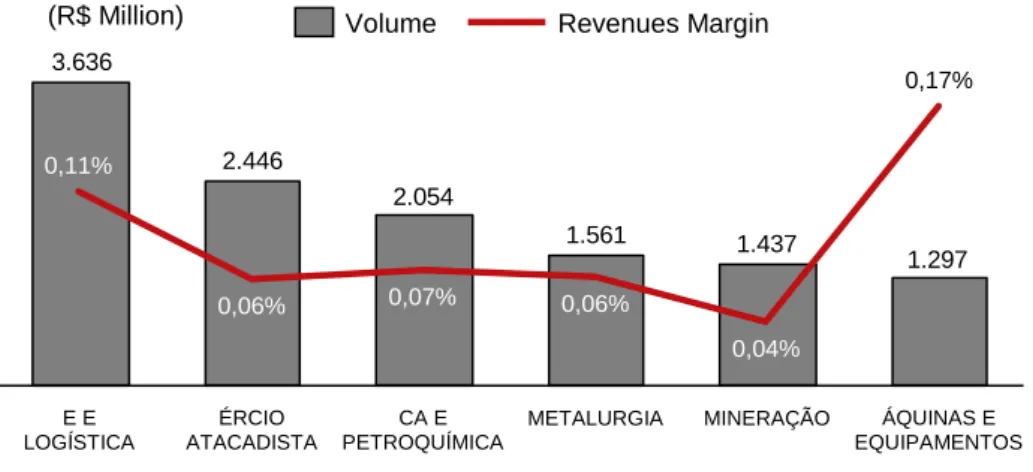
By looking at the Derivatives’ department performance, it is clear that Derivatives volume decreased 18% from 2010 to 2011 mainly due to a decrease in the volume generated by SWAP CDI Protegido. Alternatively, from 2011 to 2012, volume increased by 48%, driven by the increase on the volume generated by SWAP products, Appendix - Figure 14.
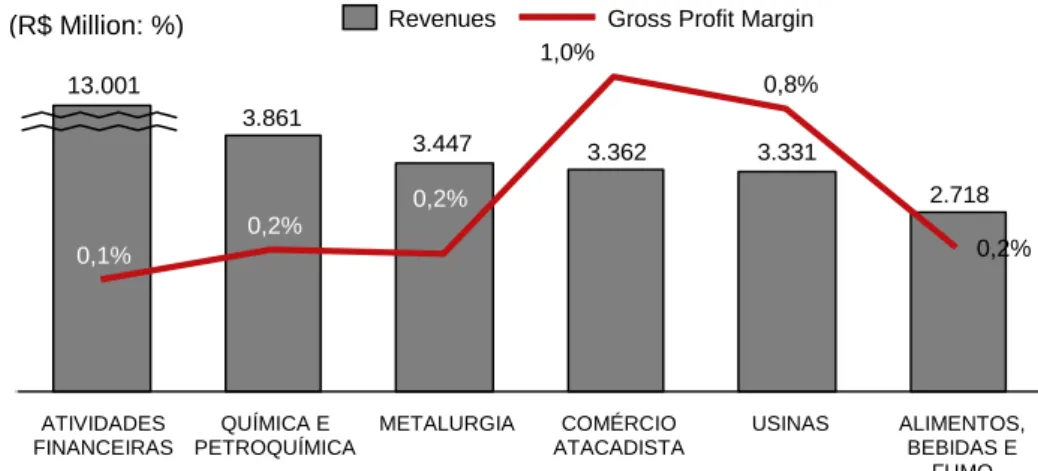
Regarding industries performance, Comércio Atacadista and Usinas have consistently returned the highest profit margins, and its volume has been increasing across years. On the other hand, Actividades Finaceiras and Quimica e Petroquimica whose profit margins are the lowest gained weight over total volume contributing to an overall lower profit margin. The volume generated by these industries has been concentrating in few
9
industries over the three years. The 7th largest industries represented 50% of total volume in 2010, 59% in 2011 and 54% in 2012, Appendix - Figure 15.
Finally, Derivative corporate clients’ are mainly located in the South regions of Brazil: SP, Sudeste and Sul represented 76% of 2012 Total Volume. Additionally, the derivatives’ sales desk has been losing presence in the Nordeste region and is almost not operating in the Norte region. Also, it is worth mentioning the weak expressivity of Multinacionais compared to the FX department. The main reason for this fact is that Multinacionais are often reluctant or prohibited from engaging into derivative contracts, Appendix - Figure 16.
Cross-selling targets
The team identified a total of 669 clients, from which 505 were exclusively buying products from the FX department and 164 were exclusively TF’s clients. The main reasoning found behind the potential of these two types of target groups is:
1) FX exclusive clients constitute potential cross-selling targets because they frequently hold foreign exchange positions although they are not establishing any hedging contract within the derivative’s department. Certainly, these clients may be hedging their position with a different bank or may not be hedging them at all. Either way, they represent potential cross-selling clients for Santander.
2) TF exclusive clients’ potential is driven by the fact that these clients already obtained loans or credit lines from Santander but did not close their foreign exchange position within the bank through FX products. Or, did they hedge their foreign exchange risk with the bank’s derivative department.
2. Reflexion on the Business Project
a. Originality, Evolvement and Limitations
For the second meeting with the project coaches, the team had prepared a detailed working procedure based on the preliminary approach defined during the first meeting. Therefore, the methodology suggested by the team comprised not only the cross-analysis of the different databases but also a deep cross-analysis of each department’s database in order to understand its overall performance, the characteristics of the clients
10
being target and the department’s strengths and weakness regarding its customer’s management. Afterwards, the team would cross-checked the different data-bases to identify the clients that could offer possibly opportunities for cross-selling.
Due to the size of the clients’ database, the team suggested to segment the clients according to their characteristics and buying patterns, namely segmenting by the financial products already bought from Santander, the industry in which the clients operate and their regional location. By clustering the clients, the team was able to analyze the performance of each segment, and understand what are the products mostly demanded by each industry, where these industries are located and what are the most profitable industries and products. The team believed that the knowledge extracted from this analysis would help defining the sales’ force action plan particularly by allowing a clear understanding of the different clients and their needs.
Indeed, the approached developed was based on Kamakura (2007) methodology, “Acquisition pattern analysis”, previously developed by Jarrar and Neely (2001).
In order to perform the intended analysis it was necessary to filter and complete the different department’s databases, which contained specific information about Santander’s client transactions from 2010 – 2012. Thus, the team used the information provided on those files concerning the clients names and CNPJs (the companies’ fiscal number), volumes of transactions, gross profits of transactions, type of products bought, belonging segments (business, corporate, or GBM). The information above were not yet sufficient and it was therefore necessary to match the clients CNPJs with a database that would match each client (through its CNPJ) to the industry in which the client operates and its location. In fact, Santander’s database did not include the information needed to segment the clients according to the team’s plan, therefore, the team requested, with the help of Santander, a governmental database named CNEAS that contains information about companies’ CNPJ and names, operating industries and regions, allowing an extensive characterization of the clients’ database.
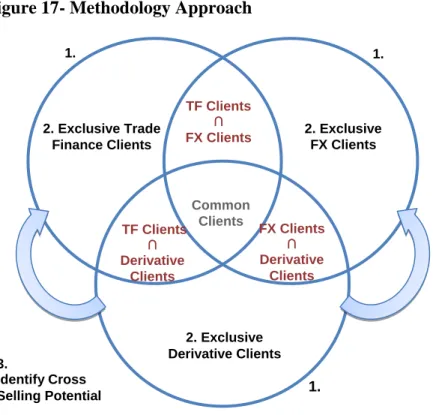
After analysing the transaction databases, the team pursue a cross-database analysis in which the clients from the three databases were compared in order to understand the ones that were not buying products from the three departments. Appendix - Figure 17 resumes the approach followed by the team to identify the cross-selling target clients by clustering clients into three groups:
11
1) Clients exclusively doing business with only one of the three different departments.
2) Clients doing business with two of the three different departments. 3) Clients doing business with all three departments.
An in depth analysis was conducted with the first group, the potential cross-selling clients in order to explore their buying patterns and to understand the type of products they might be willing to buy, based on the “acquisition pattern analysis” approach. The team targeted exclusively the first group because these clients were buying products from one department but they were not buying the necessary complementary products from the other departments of the bank.
As a last step the group matched the transaction databases with the derivative credit limit database. Thanks to this analysis it was possible to identify the potential cross-selling clients already equipped with a credit limit with Santander Brasil. These clients should be targeted first, since Santander Brasil does not have to apply a screening process to access their credit risk and thus, these clients could be contacted immediately and be offered the products that were identified as matching their needs.
The methodology applied and the analysis performed received great positive feedback. Indeed departments’ managers and sales’ managers argued that understanding clients’ needs is crucial for the success of their job because they can offer a more customized service, anticipating the clients’ needs.
Despite its simple concept and apparent straight-forward application, the process required the students’ absolute dedication. The students had to strategically re-arrange the different databases provided in order to be comparable and able to be cross-checked. Indeed, the different departments have their client databases organized differently, namely, respecting different lay-outs and organized for different purposes. Thus, the process of standardizing the three transaction databases was time-consuming and required intense brainstorming.
Despite the overall good results and positive feedback on the work done, the team faced several difficulties to apply the developed methodology. Namely, gathering the database from the different departments is not an easy task because the information is confidential and managers from each department feared that the purpose of the project would not be aligned with their interests. Indeed, Santander incentive schemes reward
12
individuals for the performance of the department in which they operate. Meaning that managers will privilege their department’s performance over the jointly performance of the bank’s departments. Thus, managers feared that by sharing information about their clients, this information will be used by the other departments against their interests. Additionally, databases were frequently incomplete or not up-dated requiring the team to carefully analyze the content of each database and complete the missing information. Finally, the team believed the main limitation comes from the applied methodology itself. Indeed, the analysis and the suggested recommendations for the cross-selling target group (exclusive clients from TF and FX) are based on the common pattern analysis methodology, therefore, as mentioned by the author, Kamakura (2007), such analysis will not have a 100% cross selling conversion rate due to each client specific needs and circumstances that are not being particularly considered.
The truth is that, in the case of Santander, the team came across several companies (multinationals) which have hold position in derivative products in the past but that were not establishing any contract with the bank’s derivative department mainly because, after the financial crisis, these companies’ internal policies changed and prohibited exposure to complex financial products. Thus, despite any possible value-added by these products, companies are not allowed to hold them.
b. Alternative Approach
Ever since the first meeting in which the project’s coaches presented the business project objective, the need to increase cross-selling within Santander clients’ base, it has never been discussed the reason why the different departments were not naturally engaging into cross-selling. Moreover, at the end of the project, when presenting our action plan and particularly, when the team suggested that collaboration and team work should be promoted across the different departments in order to successfully implement the developed plan, the team received extremely good feedback on this suggestion. Indicating that the bank’s departments have intrinsically felt that the lack of interaction with the other departments was certainly the main reason why cross-selling opportunities were being forgone.
As a matter of fact, I believe that the lack of team work and collaboration across departments is the main source of the problem presented. Consequently, the successful implementation of the developed plan is highly dependent on how Santander is
13
engaging its workers into team work. Therefore, I believe that the subjects that could have been further explored regarding Santander’s problem, concern three main questions: firstly, “why were workers not been engaged into team work?”; secondly,
“what is the impact of team work on the bank’s financial performance by allowing cross-selling opportunities to be explored?”; and finally, “how can the bank promote team work across departments?”.
Therefore, this section will aim at exploring the answers of these questions and at suggesting possible solutions for the problems recognized through the application of a theoretical framework.
The first question aims at exploring why workers were not naturally being engaged into cross-selling and consequently forgoing selling opportunities. Indeed, at the beginning of the project, when the team had to gather the transactions’ data from the different departments, it was clear that the different departments were not willing to share information with the purpose of being analysed, shared and available for everyone inside the bank. When the team questioned the department managers and project coaches the reason why the different departments would not be willing to share the information, the answers mainly regard the fear of losing clients for the other departments. Even though the different departments offer complementary products, they also offer products that may compete with each other. Thus, the different departments felt that once the other departments would access its client base, they would offer these clients not only complementary products but also products that compete with its products, leading to a cannibalization of its sales.
Under an economic perspective, these concerns would make sense if the different departments were part of different organizations competing on the same market. However, common sense would suggest that, since the three departments are part of the same institution, they should share the goals of the institution which surely comprise the focus on revenues and profitability growth.
As a matter of fact, even though the products sold by the different departments may compete with each other, our analysis showed that derivative products are on average (and considering the product’s tenor), more profitable than the competing FX products. Thus, even considering the cannibalization effect, if the three departments shared aligned incentives with the bank, they would be willing to explore the mix of products (offered to the clients) that most enhances the bank’s profitability.
14
In fact, I may conclude that the incentives of each department are not aligned with the bank’s goals. Instead, each department has its own incentive to maximize the department revenues and profitability. As a matter of fact, the conflict of interest that arises between the three departments is commonly presented in large corporation and highly debated in literature.
As studies on agency theory have pointed out, when the interests of individuals in an organization are not aligned with the organization as a whole, employees will tend to behave in ways that impede the maximization of the firm’s performance. Employees and organizations interest alignment is defined has the degree to which the members of
the organization are motivated to behave in line with organizational goals (Gotthschalg
and Zollo (2004)).
Literature suggests that a firm’s potential performance is dependent on its market position and resource configuration, however the extent to which its potential is realize depends on the aggregate motivation of its employees. Thus, motivational mechanisms are constantly subject of studies as a way to help firms aligning interests and enhancing its performance. Research shows that reward systems and control mechanisms are the main mechanisms used by firms to align incentives. Although, literature is not clear on the extent to which these mechanisms are able to motivate employees (Jensen 1986). Based on the literature reviewed, I was able to infer and discuss the reasons why incentives are not aligned in the case of Banco Santander Brasil.
Indeed, Santander earned a position among the largest financial groups in Brazil through its strategy of growing inorganically based on the acquisition of several banks in Brazil. For instance, Banco Geral do Comercio in 1997, Banco Noroeste in 1998, Banespa in 2000, and the latest, the Brazilian assets of the ABN AMRO conglomerate in 2007. On one hand, this strategy allowed the bank to be one of the largest banks in Brazil, after Itau Unibanco, Banco do Brasil, Bradesco and Caixa Economica Federal. On the other, growing through acquisitions brings several challenges to the bank’s corporate governance structure. Particularly, the pos-acquisition process which requires the merger of the cultures and processes of the institutions involved, requiring the re-definition of the employees’ incentive system to account for the new structure. As the banks got bigger, the challenges concerning the definition of the incentive schemes and particularly its alignment with the bank’s goals became even more difficult.
15
Despite not been able to fully access Santander employees’ incentive schemes, I was able to get a general description of its structure. Thus, under a simplified view, bonuses are granted based on a multiple of the employees’ base salary. The multiple depends on performance, which is obtained by weighting the grades on three main variables: the individual performance/achievements of the employee, the performance/achievements of the department and the performance/achievements of the bank. The overall grade of each of these variables is further obtained by weighting the grades of a set of other pre-established targets. Moreover, I believe the weights of each variable’s grade on the total grade are similar, however due to the size of the bank, employees have lower control over the performance of the remaining departments and thus, the weight given to the bank’s overall profitability variable has a lower intrinsic importance for the employee. As a result, the employee puts more effort on individual and department performance because these variables are easier to control. Nevertheless, it does not incentive the employee to work towards the maximization of the bank’s revenues and profitability. Therefore, I may argue that because it fails to align the employees’ incentives with the bank’s overall goals, this incentive schemes is not well-designed.
The second point aims at exploring the benefits of engaging employees into team work. Indeed literature has also deeply discussed this subject. In the paper, “How to build Collaborative Advantage, the authors, Morten Hansen and Nitin Nohria, argue that team-work and collaboration is a major source of competitive advantage in mature markets. While in the past, companies were able to explore market inefficiencies and business opportunities, as markets and economies mature, new sources of competitive advantage should be pursued by companies in order to enhance profitability. The new economies of scope arise from the ability of business units, subsidiaries and departments within the company to work together by sharing knowledge and jointly developed products and services. Thus, multinationals that can promote and support collaboration will be able to leverage their resources and capabilities. The authors argue that collaboration is a source of competitive advantage because it does not occur automatically; instead there are several barriers that impede team work in complex organizations. Indeed, interunit collaboration is difficult to achieve and poorly perceived.
A similar view is expressed in the paper “A Framework for Creating Value through
16
a framework that aims at conceptualize collaboration, defining ways to reduce its barriers and paving the way to value creation. The three elements of the framework are
Four Barriers to Interunit Collaboration, Management Levers to Promote Collaboration and Value Creation from Interunit Collaboration. The authors’ research
on 107 companies showed that companies are frequently responsible for the barriers that prevent workers from engaging into collaborative activities. For instance, companies fail to promote interaction across departments, understanding of other people’s work and transfer of knowledge. Moreover, the research shows that the sources of this failure are diverse and inherent to the circumstances of each company. Therefore, the best way to identify the reason for the existence of such barriers is to ask employees to answer an internal questionnaire.
On the other hand, the authors conceptualize potential management lever to reduce these barriers into three categories: leadership, values and goals; human resources procedures; and lateral cross-unit mechanisms. The first category, argues that if leaders signal to employees the importance of collaboration cross units, expressing the values of teamwork and developing common goals, workers will likely to be motivated to seek and provide help. The research shows that companies particularly good at fostering powerful goals and impede myopic unit-focused behaviours will perform better.
The second category, human resources procedures argue that great effort should be put into the recruitment and promotion criteria. Indeed, by selecting candidate who present team-work characteristics and promoting employees who show collaborative behaviours, companies will ensure that its team will, over time, be composed of leaders who share collaborative behaviours.
Lastly, the compensation package should also be designed to compensate employees based on collaborative behaviours. For instance, some companies implemented annual performance systems that evaluate employees based on what and how were the goals accomplished. The “how” part evaluates workers collaborative behaviour across functions and units and thus, a lower grade will indicate that the employee did not collaborate enough even if he/she achieved individual targets.
The last category, lateral cross-unit mechanisms argues that the company should define best practices that promote interaction and a culture of strong professional relationships among employees.
17
The third category, Value creation from Interunit collaboration, mentions the impact of interunit collaboration on the firm’s value. Despite arguing that the extent to which collaboration benefits a company, varies across companies, the authors argue that a firm whose businesses are related tend to benefit more than big conglomerates. The benefits comprise five major categories: cost savings due to the transfer of best practices; better decision making process, increased revenues due to the sharing of expertise and products; innovation by cross-pollination of ideas; and enhanced capacity for collective action that involves many units.
Overall, I believe the framework presents powerful insights concerning the importance of promoting team-work behaviour within a company. Moreover, when applying the framework reviewed to the case of Santander Brasil, it is likely that the bank itself has been responsible for some of the barriers that prevent workers from collaborate and work as a team. Therefore, I believe that the bank should run a survey among employees to understand the barriers that prevent employees from different departments to work together. Additionally, the bank should adopt some of the measures suggested to reduce the barriers identified. Namely, reinforcing the values of the managers, selecting and promoting employees based on their ability to work as a team and finally and most important redesign the compensation package. Indeed, I believe that Santander’s current compensation package fails to engage employees into collaborative behaviours.
Finally, the third point aims at reviewing the possible alternatives for the bank to overcome the lack of alignment in its incentive schemes and simultaneously promote team-work. Therefore, my suggestions comprise a review of Santander’s incentives scheme in order to promote team work, by putting more weight on the variables that are hardly controlled by the employee and thus perceived as having a lower priority, it will incentive employees and departments to work with each other. Certainly, one can easily counter-argue this suggestion because it may have the adverse effect of de-motivating employees. The truth is that, if employees feel that only a small part is really engaged into working towards common goals, they may be inclined to free-ride as they would not have to work so hard and still reap out the benefits. The equilibrium of this game is surely not optimal as employees perceive the free-riders and adopt the same behaviour.
18
Consequently, I understand that my suggestion should not only comprise a review of the bank’s incentive scheme but also to put in practice some of the suggestions mentioned above.
In particular, as Herzberg argues in the two-factor theory of motivation, money alone does not provide enough of an incentive as a motivator for performance. The theory also argues that top managers must provide challenging jobs in order to motivate today’s high-skilled workers. Moreover, according to the theory since physical or material and social needs associated with jobs are already fulfilled, highly educated workers desire to reach a higher-level of needs as ego (esteem) and self-actualization. Surveys conducted on employees motivation show that growth opportunities and challenging projects will positively affect peoples’ motivation at work.
To conclude, it is my belief that perhaps until a certain extent, financial compensation will still create incentives to motivate employees. Therefore, the first step towards incentives aligned is undoubtedly the re-definition of the incentive system at Santander together with the encouragement of collaborative work.
3. Reflection on Learning
a. Previous Knowledge Masters’ Content Applied
Due to the nature of the products transitioned by these departments, the Business Project required deep knowledge about financial products as derivatives, forward contracts and trade finance loans. Indeed, in order to be able to select and manage the information given in the transactions’ database, it was absolutely necessary to understand how these products were structured and what are their pay-offs schemes. Even though, derivatives, forward contracts and trade finance loans may all be classified as financial products, they share significantly different characteristics which make the analysis of their performance quite challenging. Therefore, the content learned in the Investments, Applied Corporate Finance, Applied Corporate Governance and Banking courses was extremely important to successfully master the concepts of the project and developed an action plan. Indeed, the content of these courses allowed not only the understanding of the structure and pay-off scheme of these products (Investments), but
19
also the understanding of how they affect the bank’s income statements and balance sheet (Banking) and how companies make use of these products as a way of hedging its exposure to foreign currencies (Applied Corporate Finance).
Moreover, the incentives and compensation systems’ approached and deeply analyzed during the Applied Corporate Governance course were also of great use when dealing with the incentives of the bank’s employees particularly working for different departments. Indeed, one of the recommendations suggested by the team concerned a revision of the bank’s incentive scheme as the team considered it inappropriate.
Finally, despite the specificities of the Brazilian market concerning the regulation on the financial products, the knowledge developed in these courses allowed an instantaneous understanding of the bank’s problem. Indeed, the project coaches were pleased with the fact that the team managed the concepts and was able to raise pertinent questions. Masters’ Content Adjusted
Indeed, I believe that the knowledge I developed during the Masters was of great applicability in this project. Although I may mention two situations in which I had to adjust the contents learns to better fit the circumstances faced. For instance, the regulatory issues concerning the Brazilian market and the real-life issues faced on communicating the action plan.
Oppositely to the European and the US tax systems, in Brazil, the rules that regulate the taxes on the financial products analyzed are more complex and its understanding is time-consuming. Moreover, similar products may be taxed differently which implies that each product should be analyzed differently. Therefore, our analysis and action plan proposal should take into consideration that, because of tax reasons, companies may not even consider holding the financial products that better fit their needs as it would represent an additional effort on dealing with the tax issues and increase the chances of error.
On the other hand, because it was the team’s objective to propose a realistic and applicable action plan, the team had to adapt the practices suggested in the literature for Santander’s specific circumstances. Indeed, the literature consulted suggested that in order to successfully implement cross-selling activities within the bank, the different departments should share a common client and transactions database. This would allow an easy follow-up of the clients’ transactions with the bank and avoid missing selling
20
opportunities. However, such a suggestion would not be applicable to Santander as the different departments will not be willing to share information that could be used against its own benefit through the cannibalizing of its sales.
b. New Knowledge
Methodologies and Frameworks
The Business Project was quite enriching in terms of new knowledge, mainly considering the methodologies and frameworks behind the concept of cross-selling. Therefore, I learnt that one of the most important ideas behind cross-selling is to identify customers buying habits. Moreover, according to (Jarrar and Neely, 2001) it is important to understand “what customers are buying, what they would buy, what products they buy from other companies, and what market segments clients are in?” Therefore to support our analysis, the team applied a methodology known as “acquisition pattern analysis” that has often been applied in order to answer the questions mentioned above. The main idea is to analyse customers past behaviour as a basis to predict future actions (Jarrar and Neely, 2001). Kamakura (2007) further developed this model as he correlated customers past behaviour with comparable clients who haven’t bought the same product yet. These clients were than bundled in a cross-selling target group and its possible acquisitions were inferred.
On the other hand, as mentioned above, one of the Business Project’s biggest challenges and consequently a powerful learning was the understanding of the regulatory and taxation systems in Brazil. Indeed, because these differences influence a product’s demand, the team had to study and consult experts on this matter.
c. Personal Experience Key Strengths & Weaknesses
When reflecting on the final result of the Business Project, there are several aspects concerning my contribution to the success of the project that are worth mentioning. For instance, in the beginning of the project, when developing the work procedure, I pro-actively defined a set of objectives and goals to be achieved under a pre-established time schedule which later allowed the team to discuss the results with the project coaches before the final presentation, giving the team time to incorporate last-minute suggestions or necessary changes.
21
Additionally, I believe I was able to manage the data, defining a database structure that allowed the team to make the pre-defined analysis without limiting the possibility of performing further analysis. Moreover, I believed that my background in finance was crucial on the development of the project because the project required in-depth knowledge about financial markets.
On the other hand, I believe my weaknesses were mostly related to the development of the action plan, as it required a deeper understanding of the sales’ manager/client relationship. Indeed, I felt the need to read some literature about customer relationship management which I found quite interesting.
Finally, I also believe that, at the beginning of the project, I had superior knowledge of the concepts being discussed due to my finance background. Oppositely, my colleague whose background is in International Management, had trouble understanding and mastering the concepts regarding the financial instruments (as swaps, options and forwards). Moreover, particularly at the beginning of the projects, I was not able to understand that he was having trouble understanding these concepts. Therefore, I believe I could have helped him dealing with the concepts in order to ease his learning process and avoid misapprehension.
Develop Areas of Improvement
The main weaknesses that I identified concerning my contribution to the development of the Business Project were mainly related to the lack of knowledge concerning the best practices of sales managers, namely concerning their relationship with clients, and the failure to understand that my colleague was struggling to understanding concepts that for me were clear and straight-forward because of my background. Thus, I believe that I should pay more attention to my colleagues, namely, trying to understand if the issues under discussion are completely mastered by everybody. Indeed, in this case I could have helped him understanding the major concepts beforehand. Therefore, the next time I had to perform a team work I would suggest the team to meet in order to discuss if everybody is familiar with the subject of the project under analysis.
On the other hand, concerning the lack of knowledge on customer relationship management, I am planning to dig into the subject by reading some literature and perhaps attend some lecture of a CRM course.
22
d. Benefit of Hindsight
I truly believed that the simplicity of the approach developed and the applicability of the action plan suggested were the key successful factors of the Business Project. Indeed, I believe the team was able to understand not only the problem exposed by the project coaches’ but also perform an analysis that was not expected by the project coaches but that is determinant for the successful implementation of the developed action plan. Indeed, by segmenting the client’s base, the team gave important insights regarding the client’s characteristics and needs to the three sales’ desks. These insights will allow the sales’ managers to offer the products that better suit to the client needs. Moreover, it will also allow a better customization of products depending on each client profile and needs which is proved to enhance revenues and profitability. In fact, despite not being deeply analyzed, the ability to anticipate customer’s needs increase customer’s satisfaction and loyalty.
Finally, I regret not to have taken full advantage of the availability of the project coaches to develop more knowledge regarding the derivatives’ operations and the day-to-day challenges faced by them. Indeed, the Business Project gave the students the opportunity to contact with very senior managers of the bank. This fact not only gave the team and the CEMS program great visibility but most importantly, allowed the team to learn from experienced and skilled professionals.
23
4. Appendix
Figure 1-Santander’s operating profit by geographic segments (Q1 2013)
24
Figure 3-Santander’s Project 3.1 Strategic Priorities
Figure 8- Trade Finance Volume by Product from 2010-2012
13 152 8 10 68 17 208 116 274 Pré-Pagamento a Exportação 1.047 Loans Asset 687 Financiamento a Importação 1.115 BNDES Exim Adiantamento a Exportação 1.130 +34,1% 2012 2011 2010
25
Figure 9 - Trade Finance Volume and Profit Margin by Industry in 2012
Figure 10 - Trade Finance Volume by Region from 2010-2012
Figure 11 - Trade Finance Volume by Region from 2010-2012
(R$ Million) 6.847 4.161 4.715 2.797 7.715 5.878 5.637 4.184 8.417 7.089 6.182 3.861 +10,9% +17,5% FC IMP +14,5% +30,5% FV EXP O E S T E 2011 2012 2010 14 58 12 98 18 194 54 157 56 64 9 196 743 360 351 15 MULTINACIONAIS SUL 1.163 SUDESTE SP 1.407 NORDESTE CENTRO OESTE NORTE 2012 2011 2010 (R$ Million) (R$ Million) 302 354 433 460 531 607 625 MÁQUINAS E EQUIPAMENTOS 4,0% TRANSPORTE E LOGÍSTICA 1,3% ALIMENTOS, BEBIDAS E FUMO 1,5% COMÉRCIO ATACADISTA 2,6% QUÍMICA E PETROQUÍMICA 4,8% USINAS 3,0% AGROPECUÁRIA 1,9% Revenues Margin Volume
26 386 692 450 582 431456 847 322 NORDESTE 4.235 CENTRO OESTE NORTE SP 5.146 MULTINACIONAIS 3.265 SUL 3.987 3.274 4.126 2.840 4.470 SUDESTE 1.085 5.615 4.131 6.688 2012 2011 2010 (R$ Million)
Figure 12 - Foreign Exchange Volume and Profit Margin by Industry in 2012
Figure 13 - Foreign Exchange Volume by Region from 2010-2012
Figure 14 - Derivatives clients’ performance by Product from 2010 to 2012
(R$ Million) 12.678 13.175 26.670 12.779 7.663 5.015 7.592 6.652 5.539 +48,5% -17,9% 2012 39.440 2011 26.554 2010 32.347 OPÇOES TERMO SWAP SWAP CDI PROTEGIDO
(R$ Million) 1.297 1.437 1.561 2.054 3.636 2.446 E E
LOGÍSTICA EQUIPAMENTOS ÁQUINAS E
0,17% MINERAÇÃO 0,04% METALURGIA 0,06% CA E PETROQUÍMICA 0,07% ÉRCIO ATACADISTA 0,06% 0,11% Revenues Margin Volume
27
Figure 15 - Derivatives Volume by Industry in 2012
Figure 16 - Derivatives Volume by Region from 2010-2012
(R$ Million: %) 2.718 3.331 3.362 3.447 3.861 0,2% QUÍMICA E PETROQUÍMICA 0,2% ATIVIDADES FINANCEIRAS 13.001 0,1% ALIMENTOS, BEBIDAS E FUMO 0,2% USINAS 0,8% COMÉRCIO ATACADISTA 1,0% METALURGIA
Gross Profit Margin Revenues 3.611 MULTINACIONAIS 1.164 2.076 SULQUÍMI 7.165 3.872 4.749 SUDESTECOM 28.870 4.650 4.200 SPTRANSPORT 9.462 9.669 13.938 CENTRO 3.355 3.448 1.451 NORDESTE 2.763 2.845 2012 2011 2010 (R$ Million)(R$ Million)
28
Figure 17- Methodology Approach
3. Identify Cross Selling Potential missing correlatio n Common Clients FX Clients ∩ Derivative Clients TF Clients ∩ FX Clients 2. Exclusive Trade Finance Clients 2. Exclusive Derivative Clients 2. Exclusive FX Clients TF Clients ∩ Derivative Clients 1. 1. 1.
29
5. References
Hansen, T. M., Nohria, N., 2004. MIT Sloan Paper : How to build Collaborative Advantage.
Conyon, M. 2006. Cademy of management Perspectives: Executive Compensation and Incentives
Gottshalg, O., Meier, D., 2004. Research Paper: Interest Alignment and Firm Performance
Arnold, R. A., 2008. Economics. Mason: South – Western, Engage Learning.
Bandura, A., 1982. Self-efficacy mechanism in human agency. American Psychologist, 37.
Akcura, T. M., Srinivasan, K., 2005. Research note: Customer intimacy and cross- selling strategy. Management Science 51 (6).
Banco Central do Brasil, 2013A. Brasil Interest Rate. Available at:
http://www.tradingeconomics.com/brazil/interest-rate. (Accessed 10 June 2013) Banco Central do Brasil, 2013B. Inflation Reports. Available at:
http://www.bcb.gov.br/?INFLAREPORTFV. (Accessed 10 June 2013)
Banco Santander (Brasil) S.A., 2012. Case Study – 2012: How to improve the “Banco Santander Brasil” business model by analyzing opportunities of Cross Sell. Sao Paulo: Santander Publications.
Banco Santander S.A., 2013A. Financial Report 2013: January – March. Madrid: Santander Publications.
Banco Santander (Brasil) S.A., 2013. Case Study – 2012: How to improve the “Banco Santander Brasil” business model by analyzing opportunities of Cross Sell. Sao Paulo: Santander Publications.
Bishop, K., 2013. HSBC Bullish on Dollar as Currency War ‘Intensifies’. Available at: http://www.cnbc.com/id/100764271. (Accessed 11 June 2013)
30
Corona, B., 2012. Real world economics: Understanding the gross domestic product and the gross national product. New York: The Rosen Publishing Group, Inc.
Futrell, C. M., Berry, L. L., Bowers, M. R., 1984. An evaluation of sales training in the U.S. banking industry. Journal of Personal Selling & Sales Management, 4 (2).
Papaioannou, M., 2006. IMF Working Paper: Exchange Rate Risk Measurement and Management: Issues and Approaches for Firms. Waschington D.C.: IMF Publications. Jarrar, Y. F., Neely, A., 2001. Cross-selling in the financial sector: Customer
profitability
is key. Journal of Targeting, Measurement and Analysis for Marketing, 10 (3).
Kaishev, V. K., Nielsen, J. P., Thuring, F., 2013. Optimal customer selection for cross-selling of financial services products. Expert Systems with Applications, 40.
Kamakura, W. A., 2007. Cross-Selling: Offering the Right Product to the Right Customer at the Right Time. Journal of Relationship Marketing, 6 (3/4).
Kane, M., 2005. Why most cross-selling efforts flop. ABA Banking Journal, 97 (2). Kruse, D. L., Freman, R. B., Blasi, J.R., 2010. Shared Capitalism at Work: Employee Ownership, Profit and Gain Sharing, and Broad-Based Stock Options. London: The University of Chicago Press, Ltd.
Malms, O., Schmitz, C., 2011. Cross-Divisional Orientation: Antecedents and Effects on Cross-Selling Success. Journal of Business-to-Business Marketing, 18.
OECD, 2005. Glossary of Statistical Terms. Available at:
http://stats.oecd.org/glossary/detail.asp?ID=2739. (Accessed 10 June 2013)
Thuring, F., Nielsen, J.P., Guillén, M., Bolancé, C., 2012. Selecting prospects for cross-selling financial products using multivariate credibility. Expert Systems with
Applications, 39.
Johlke, M. C., Stamper, C. L., Shoemaker, M. E., 2002. Antecedents to boundary-spanner perceived organizational support. Journal of Managerial Psychology, 17 (2).
31
Reuters, 2013. Brazil opts for steeper rate hike, lifts Selic to 8 pct. Available at:
http://www.reuters.com/article/2013/05/29/brazil-economy-centralbank-idUSE5N0CY00B20130529. (Accessed at: 10 June 2013)
Shoemaker, M. E., 1999. Leadership practices in sales managers associated with the self-efficacy, role clarity, and job satisfaction of individual industrial salespeople. Journal of Personal Selling and Sales Management, 19 (4).
Wayne, S. J., Shore, L. M., Liden, R. C., 1997. Perceived organizational sup-port and leader-member exchange: A social exchange perspective. Academy of Management Journal, 40 (1).
Welbourne, M. T., Cable, M. D., 1995. Group Incentives and Pay Satisfaction: Understanding the Relationship Through an Identity Theory Perspective. Human Relations, 48 (6).
World Trade Organization, 2012. International Trade Statistics 2012. Geneva: WTO Publications.
Zboja, J. J., Hartline, M. D., 2010. Using Internal Relationship Marketing Activities to Enhance Cross-Selling Performance in Services. Journal of Relationship Marketing, 9.