To Noel October 09. To Jafar October 10. CHAPTER XX
SERVICE QUALITY STRATEGY
Implementation in Algarve Hotels
Carlos J. F. Cândido
Universidade do Algarve, Portugal
Abridgement: This chapter addresses the problem of service quality strategy
implementation and undertakes a tentative validation of three models. The first focuses
on service quality, as a function of quality gaps, while the second and third ones
examine strategy implementation. The models aim to help to explain how to implement
a service quality strategy that simultaneously avoids quality gaps and resistance to
change. Sample data has been collected through questionnaires distributed within the
population of four- and five-star hotels of the Algarve, Portugal. Descriptive statistics
and statistical tests do not provide evidence against the models and thus support their
validity, but raise concerns about some possible inconsistent management practices
during the implementation of a quality strategy. Keywords: strategy implementation;
total quality management; quality gap; Algarve; hotel sector
This is the author version, pre-print not the editor's version
INTRODUCTION
The purpose of this chapter is to discuss issues in implementing service quality strategies
in the hotel sector. The problem can be defined more precisely as how to implement a
strategy of quality which focuses on customers’ needs in a service organization or,
alternatively, as how to integrate coherently a successful, customer-centered service
quality strategy, while accounting for the requirements and idiosyncrasies of
operationalization. The nature and scope of this research topic is based in the confluence
of the areas of service quality and of strategy implementation. Thus, addressing this
problem naturally requires a review of the literature on both subjects. An examination of
service quality reveals firstly that it is conceptualized as a function of service quality gaps
(SQGs); secondly, that there are several models discussing such gaps; and thirdly that
there are several types of SQGs reported in the literature which are not included in
existing models, thus suggesting the need for developing an encompassing synthesized
model. The chapter considers the existing SQG models and other quality inconsistencies
to propose a comprehensive model (Cândido and Morris 2000).
Further, a review of the literature of strategy implementation reveals a lack of clear,
detailed, and general strategy implementation models, and that those available can be
separated into two distinct types - static and dynamic models. Both these types of models
differ considerably in the number and nature of the implementation dimensions included,
thus suggesting a need for an integrative effort. This discussion consequently considers
several existing models to propose new synthesized static and dynamic ones (Cândido and
Morris 2001).
Together the new static and dynamic models developed here can be taken to show what
two models can also be combined with SQGs to propose a map of the pattern of the
quality gaps occurring at each implementation stage; the organizational variables that can
be manipulated at each stage to prevent and eliminate the gaps; and thus identify
implications for practicing managers (Cândido 2001; Cândido and Morris 2001).
These static, dynamic and SQGs models are tentatively validated using data from a
sample of four and five-star hotels of the Algarve (FFSHA), Portugal. The same data has
also been used elsewhere to describe how FFSHA are implementing service quality
strategies; how they prevent and eliminate SQGs; how management practices differs
according to hotel ownership (international and Portuguese chains and independent
hotels); and what can be learned from the differences in ownership (Cândido 2001, 2003).
SERVICE QUALITY STRATEGY IMPLEMENTATION
Andrews, Learned, Christensen and Guth (1969:19) have defined strategy implementation
as “comprised of a series of subactivities which are primarily administrative”. Such
administrative subactivities include the allocation or reallocation of resources (funds,
equipment, personnel) and the adjustment of the organizational structure (Chandler 1962).
More recently, however, other management activities have also been recognized as having
substantial relevance in the implementation of strategy. These are related to individual and
organizational behavior—namely, to internal resistance and barriers to the changes that are
introduced as a consequence of the new strategy content. Ansoff and McDonnell (1990)
have defined implementation as a process that establishes a desired organizational
behavior, in accordance with the strategy content. “Implementation is the process of
causing the firm to behave in accordance with the purposes, guidelines and strategies”
Johnson and Scholes (1999) offer a definition that captures both administrative and
behavioral aspects of implementation. This chapter adopts this and hence defines
implementation as the execution of a new strategy, which entails a sequence of actions
involving (almost) every organizational department/resource in a coordinated way. Such
execution results in actual changes in the direction of the organization. Implementing
strategy means giving a different shape to what is already being done, or introducing
substantial modifications of, for instance, competencies, activities, processes, norms,
products, and services. Strategy content specifies what should be done, how, and for
whom; implementation makes it a reality.
Resistance to change is always a serious hindrance; it is one of the most important
strategy implementation obstacles, but not the only one. Alexander (1985), for instance,
identifies at least ten frequent problems. Given such a large number of potential problems
that can occur, it is not surprising that researchers have estimated a rate of strategy
implementation failure of between 50 and 90% (Cândido and Santos 2008, 2009).
Consequently, over the last four decades researchers have tried to understand why strategy
fails so frequently and to provide better change management models that can help
administrators to overcome this high failure rate.
Static Models
To change the behavior of an organization, all of its fundamental aspects and
circumstances have to be studied (Lewin 1947). Some models have been proposed that
capture these fundamental aspects at a particular point in time. Since these models are like
photographs, they may be called “static models”. There are several, emphasizing specific
the 7-S model (Peters, Waterman & Phillips 1980), Irons’ (1991) organizational factors,
Hussey’s (1996a) strategy implementation dimensions, Ansoff and McDonnell’s (1990)
organizational architecture, and Johnson and Scholes’ (1999) cultural web. A common
feature of these models is that they identify the fundamental variables which managers
should take into consideration when implementing strategy.
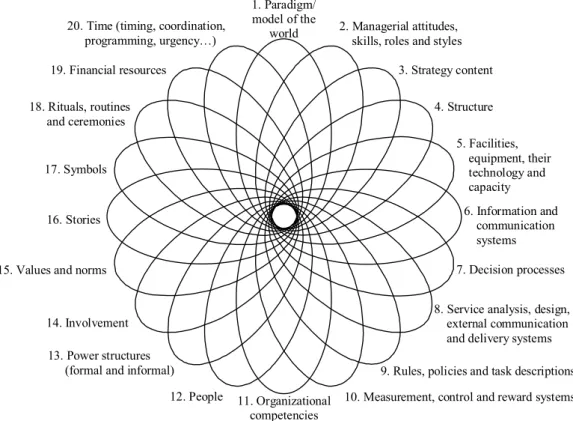
A summary of these models has been synthesized, and is shown in Figure 1. By listing
20 essential dimensions, represented as ellipses, overlapping each with every other ellipse,
the model emphasizes the diversity of dimensions that can be involved in strategy
implementation and the intricacy of their interrelationships. Definitions are not provided
here, but have been compiled from the references given above and other sources and can
be seen in Cândido (2001).
<Figure 1 here>
The 20 dimensions included in this model are, simultaneously, elements which can be
manipulated and have to be coordinated and aligned coherently (Hussey 1996b; Peters et
al 1980); which must be monitored through information collection and distribution; which
may be in a zone of uncomfortable organizational debate, because of vested interests,
bases of power, attitudes, and beliefs (Johnson and Scholes 1999); and are interdependent
and when changed affect all the others. Some of these effects will be helpful or
compensatory, others will be harmful or retaliatory (Leavitt 1964; Leavitt, Dill and Eyring
1973).
These 20 dimensions and their relationships can determine the success or failure of any
strategic change (Hussey 1996b; Johnson and Scholes 1999). Thus, they have been
1984); to stimulate thinking, and to assess the extent of change necessary in each
dimension (Johnson and Scholes 1999); and to help in planning for change. Essentially,
the model aims to provide a list of all basic dimensions that can constitute important areas
for management intervention during strategy formulation and implementation.
Dynamic Models
Dynamic models are generic processes of strategy formulation and implementation. They
indicate and define the steps that can be followed to successfully implement a strategy
which significantly modifies the current situation of an organization on most or all of its
dimensions. What distinguishes these dynamic models from traditional strategic
decisionmaking processes (Gore, Murray and Richardson 1992) is a higher concern for
overcoming implementation difficulties. Traditional strategic decisionmaking processes
suffer from employees’ resistance to change, because they leave to the end the persuasion
of those who have to implement the strategy, whereas dynamic models are developed to
overcome resistance (Johnson and Scholes 1999)
Examples of dynamic models in the literature are those by Lewin (1952), Schein (1964),
Ansoff and McDonnell (1990), Hussey (1996a), Galpin (1997), and Johnson and Scholes
(1999). These are not based on coercion, slow adaptation, or crisis management but adopt
managed change methods (Johnson and Scholes 1999), also called managed resistance
strategic change methods (Ansoff and McDonnell 1990). Such dynamic models vary
significantly in the number and nature of the stages they include, which suggests the need
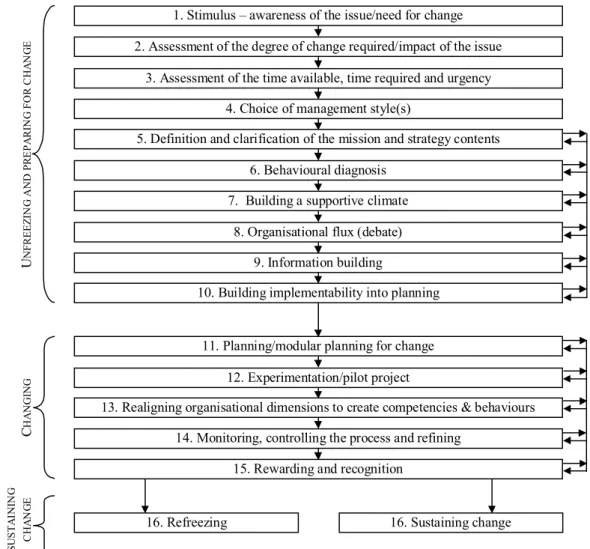
for an integrative effort. Figure 2 represents such a synthesis. Detailed descriptions of each
stage are not provided here, only a brief explanation of the three main groups of stages:
each stage).
<Figure 2 here>
Unfreezing is the disturbance of the current cognitively and emotionally stable
equilibrium of individuals in the organization (Lewin 1952; Schein 1964) to make them
aware of the need for individual and organizational changes (Johnson and Scholes 1999).
Support for undesired old attitudes is removed, whereas support for desired new attitudes
is maximized (Schein 1964). Unfreezing includes three important stages which are
ignored by traditional strategic decisionmaking processes: behavioral diagnosis of the
organization, particularly of the forces pro and against change; development of a
supportive climate for change; and development of implementability features that
facilitate planning and implementation.
Changing entails moving to a new standard of group behavior (Lewin 1952). It requires
a presentation of the direction for change, planning it, and the “actual process of learning
new attitudes” (Schein 1964:335). Involving people in planning the details of change gives
them the opportunity to help forge the new strategy and to learn through problem solving.
Changing must also include the execution of actions that lead to a new external
competitive positioning and to the development of a new organizational capability (Ansoff
and McDonnell 1990), as well as monitoring, measuring, refining, and rewarding.
Refreezing is a period of stabilization of the new standards of behavior (Lewin 1952). It
validates, confirms, and institutionalizes the changes already made and the new
organizational model that has been instituted (Johnson and Scholes 1999). Refreezing may
require some additional changes and is completed only when “the new culture and power
structure are [fully] supportive of the new strategy” (Ansoff and McDonnell 1990:415).
change continually.
The process in this dynamic model has been disaggregated into 16 stages as shown in
Figure 2. The particular sequence of these stages may be contestable, as the sequence of
steps and the definitions given for each stage, varies in the six models that have been
studied and are not easily reconciled. This suggests that there is no one best method for all
organizations, and that the model synthesized here may have to be adjusted according to
circumstances. The sequence of stages is also difficult to establish because some stages
may be interrupted and resumed later or may occur more than once, in an iterative cycle.
For instance, information building and organizational debate may occur more than once.
Some stages may also overlap with others. For example, modular planning may overlap
with experimentation or realignment (Ansoff and McDonnell 1990). These stages are,
however, separated and individualized because they are sufficiently important parts of the
process and because of their identifiable, distinct nature.
Service Quality Gaps
Some of the most influential models in the service management literature (Grönroos 1990)
focus on the concept of a service quality gap (SQG). Parasuraman, Zeithaml and Berry
(1985) define a pioneering model with five SQGs, the concepts of which are further
developed in the model of Brogowicz, Delene and Lyth (1990). The latter has five types of
gaps: those related to information and feedback, design, implementation, communication,
and customers’ perceptions and expectations. Other authors (Brown and Swartz 1989)
have also identified relevant SQGs that have not been considered previously. This chapter
integrates previous models and a group of SQGs dispersed through the literature into a
<Table 1 here>
To develop this model, references to possible service quality inconsistencies, some of
which explicitly formalized as SQGs, were collected and integrated as explained in greater
detail in Cândido and Morris (2000). A link can be drawn between the model and the
stages of a strategy process, emphasizing the SQGs’ impact on the process.
Basic Assumption of a Mixed Model
The idea of a mixed model seems to be implicit in some assumptions of static models. For
instance, Hussey (1996a:7) states that the elements of the static model “should be
examined each time there is a change in strategy” and “at each critical stage of the
implementation process”. The need for this constant vigilance results from another “static”
assumption; that some changes will have “secondary effects” which are not desirable or
not even anticipated by managers (Leavitt 1964).
Because of unanticipated secondary effects, strategy implementation must involve the
simultaneous monitoring, decisionmaking, and manipulation of the organizational
dimensions of the static model at all of the different stages of the dynamic process. Hence,
the methodological assumption that the combination of both models can contribute to the
understanding of strategy implementation.
A similar argument, but with different results, has been elucidated by Hrebiniak and
Joyce (1984). They noted that the activities of planning and organizing had been discussed
separately in the literature as two distinct fields, although planning and organizing had
implications for each other. They suggest that both (planning and organizing) are
important for successful strategy implementation and that their relationships should also
decisionmaking processes (dynamic model) in isolation, the linkages between them must
also be examined (Cândido 2001 offers a detailed discussion on this topic).
Therefore, the main proposition or basic assumption of the mixed model is defined as
follows: in the process of strategy formulation and implementation, each organizational
dimension (such as facilities, competencies, values, norms, information system) goes
through a succession of several distinct states, until its desired final state is achieved.
During this process, a dimension might be monitored continuously and “manipulated”
several times, in different stages, according to its relevance to strategy and to progress of
the change (Cândido 2001)
Study Objectives and Methods
The objectives of this chapter are to:
1. Assess the synthesized models;
2. Examine the importance of eliminating each individual SQG;
3. Examine the importance of managing each organizational dimensions of the static
model;
4. Examine the importance of each stage of the dynamic model;
5. Examine the order or sequence of those stages;
6. Determine the validity of the basic assumption underlying the mixed model;
7. Examine the organizational dimensions that can be manipulated, at each stage of
the strategy process, to prevent and eliminate SQGs; and
8. Determine the relevance of the implications for managers deduced from the
models.
the number of questions necessary to achieve all these objectives would make one
questionnaire too extensive and unattractive for managers to complete, the relevant
questions were divided into two different surveys which were administered at different
times, separated by a considerable period. This period of approximately five months was
necessary to ensure that hotel managers would be willing to answer all questions and was
not considered to influence the data collected in any other way. The times for interviewing
also had to coincide with the low season. The first questionnaire addressed objectives 1, 2
and 3 and the second, objectives 1 and 4 to 8.
Both questionnaires were initially sent by post, together with accompanying letters of
introduction; one letter from the author, one letter from the author’s faculty, and another
letter from the influential Algarve Hotel and Tourism Enterprise Association. Both
questionnaires were subsequently administered through face-to-face interviews. To secure
the latter, personal appointments with each manager were made by telephone, just a few
days after posting the questionnaires. This choice of interviewing method provided a
better response rate, avoided item non-response, and allowed the respondent to ask for
additional information or to clarify complex questions.
A 5-point Likert scale was used in several questions, with numeral 1 meaning
“unimportant”, 3 “average importance”, and 5 “highly important”. Several types of
fixed-alternative questions were also used, including a special category of question that related
the concepts of one model (such as the static model), to the concepts of another model
(like the dynamic model or the SQG model). In order to ensure comparability between
samples, only the managers interviewed for the first questionnaire were chosen for the
Characterization of Respondents
Table 2 exhibits the frequencies of four- and five-star hotels in the population of the
Algarve hotel sector. There are 9 five-star (24%) and 28 four-star hotels (76%),
composing a total of 37 (other categories of hotels were not considered in this study).
Table 2 also shows the frequency of four- and five-star hotels in the samples. The first
sample has 6 five-star (23%) and 20 four-star hotels (77%), for a total of 26 (100%). The
second sample has 4 five-star (22%) and 14 four-star hotels (78%), composing a total of
18 (100%). The first sample represents 70% of the population of FFSHA. It includes 67%
of the five-star and 71% of the four-star hotels in Algarve. The second sample is smaller
but still represents 49% of the population of FFSHA. It includes 44% of the five-star and
50% of the four-star hotels in Algarve.
<Table 2 here>
Table 2 shows that the distribution of hotels according to their category in the samples is
similar to that of the population. Compared with the population, the first sample contains
only 1% more of four-star and 1% less of five-star hotels, whereas the second sample
presents only 2% more of four-star and 2% less of five-star hotels. These figures suggest
that the samples are representative of the population, or at least that the figures do not
provide evidence of a lack of sample representativeness.
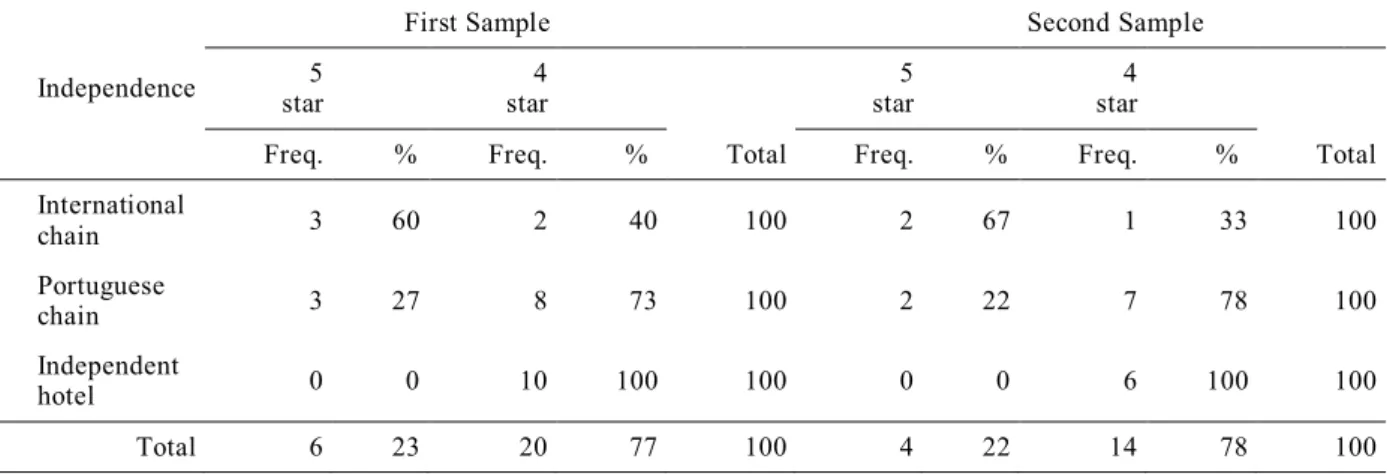
Another important characteristic of the population is hotel dependence/independence.
Some hotels belong to chains, while others are independent. Differences on this
characteristic can have an important effect on the ways they are managed and on their
performances. Table 3 indicates the results for the samples on this important dimension. It
<Table 3 here>
As Table 3 shows, for both samples, the majority of international chain hotels are
five-star hotels, whereas most Portuguese chain hotels are four-five-star. All five five-stars are chain
properties and all independents are four stars. The distributions and percentages, in the
table, corresponding to both samples, are very similar (just as in Table 2), indicating that
the relative compositions of the two samples are almost identical. Thus the samples are
comparable and there is no evidence of a lack of representativeness. Parenthetically, the χ2
goodness of fit test is not used, as some of the cell frequencies in Table 3 are very small or
null.
A Tentative Validation of the Models
The proposed models have been tested using the data collected from the samples, and the
results do not provide evidence against the models. A summary of how the data supports
the validity of the models is given below.
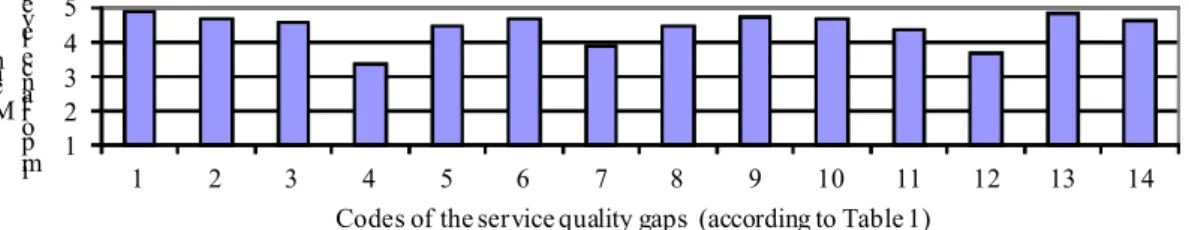
Service Quality Gap Model. A 5-point Likert scale, as noted earlier, was used to assess
the managers’ opinion of the importance of each gap. All descriptive statistics computed
suggest that managers are unanimous in considering all SQGs as very important—for
most gaps, the mean answer is higher than 4 (Figure 3).
Binomial tests were also performed for each gap. For this purpose, the Likert scale was
turned into a dichotomous scale, by joining together into one category, answers 1, 2 and 3,
regarded as the “small and medium importance” answers, and into the other category,
answers 4 and 5, regarded as the “high importance” answers. This was necessary, because
the sample distributions of the answers for each gap are neither normally distributed nor
Results from the binomial tests suggest that more than half (>51%) of the hotel
managers perceived 12 of the 14 gaps as having a high importance level (answers 4 and 5
in the second category). Similar tests suggest that between 35% and 51% of hotel
managers considered the remaining two gaps very important (answers 4 and 5). Together,
the descriptive statistics and the statistical tests provide strong support for the relevance of
the 14 SQGs that constitute the gap model, particularly in the FFSHA. Nevertheless, this
is merely a first and a tentative validation. A stronger case for the model would require
additional research
<Figure 3 here>
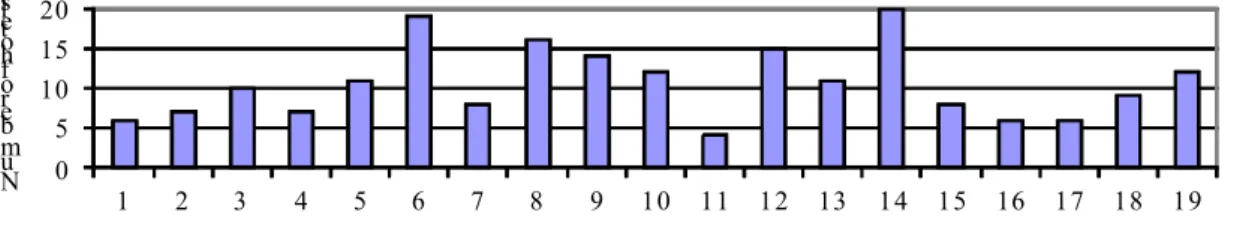
Static Model. For each dimension of the static model, a “yes” or “no” response was used
in order to assess the number of managers that consider it relevant to deal with them. The
descriptive statistics computed make it plausible to conclude that all dimensions are
relevant to hotels implementing a service quality strategy or trying to eliminate SQGs
(Figure 4). Statistical binomial tests have also been performed, providing strong evidence
that all dimensions in the static model are manipulated by a significant proportion of hotel
managers in the population of FFSHA. These proportions may vary from dimension to
dimension, but the tests indicate that they are higher than 10% and lower than 85%. This
means that all dimensions in the model are relevant to managers taken as a group.
However, the descriptive statistics also suggest that, when taken individually, most
managers seem to manipulate only a limited group of variables. On average, each manager
manipulates a limited set of around nine variables only.
Together, the data does not provide evidence against the static model, and further
managers are not exploiting all the kinds of direct impacts that they could obtain from
manipulating every dimension. The managers are either ignoring many of the
organizational dimensions that can be managed or relying on the indirect effects that can
be produced through interactions among dimensions. Such confidence in indirect effects
does not seem appropriate, since these effects can be either insufficient or indeed opposed
to the changes that are intended. Consequently, managers should try to expand the number
of dimensions that they handle instead of relying only on their personal management
experience with a limited set of variables.
<Figure 4 here>
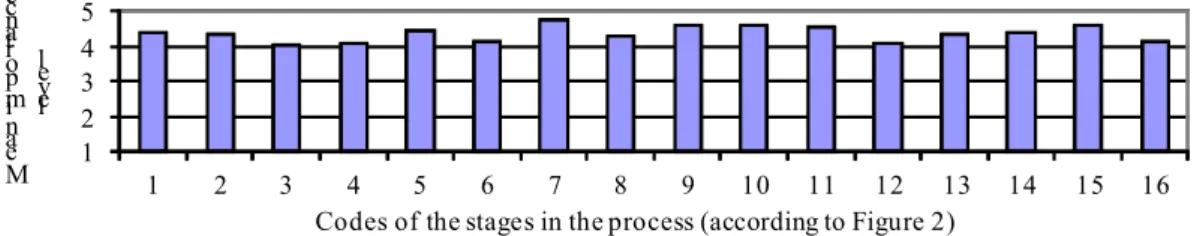
Dynamic Model. A 5-point Likert scale, as stated before, was used to assess the
importance of each stage of the dynamic model (in managers’ opinions). All descriptive
statistics computed indicate that managers consider every stage as very important—for all
stages, the mean answer is higher than 4 (Figure 5). Managers do not feel the need to add
any other stage to those already included in the model and the great majority of them
agreed with the order of those stages. Binomial tests were also performed for each stage.
The tests suggest that more than half (>51%) of the hotels consider 14 of the 16 stages as
having a high importance level. Similar tests suggest that between 35% and 51% of hotel
managers, considers the remaining two stages very important. In sum, the descriptive
statistics and the statistical tests provide strong support for the relevance and order of the
stages that constitute the dynamic model, particularly in the FFSHA. Again, this is merely
a first and a tentative validation.
Combination of the Static and Dynamic Models. The basic premise of the mixed
model is that in the process of strategy formulation and implementation, each
organizational dimension (facilities, competencies, values, norms, information system,
etc.) goes through a succession of several distinct states, until the desired final state is
achieved. During this process, a dimension can be monitored continuously and
“manipulated” several times, in different stages, according to its relevance to strategy and
to progress of the change.
The great majority of the managers (82%) agree with this assumption. Only 6%
expressed disagreement and the remaining 12% expressed slightly different opinions,
which are not in total contradiction with the assumption. Hence, the basic assumption of
the mixed model is not rejected by the great majority of the FFSHA, thus receiving
supporting evidence (Table 4).
<Table 4 here>
Link between the Mixed and the Gap Models. A table was developed, using
managers’ responses, linking the gaps to the mixed model. The results indicate, for each
stage, the gaps associated with each organizational dimension and exhibit a distribution of
the gaps different from that predicted in previous work (Cândido 2001; Cândido and
Morris 2001). In spite of the differences, the most important features of the tables are
basically coincident with that predicted. Thus, the theoretical conclusions extracted from
the predicted table and the corresponding implications for managers are supported by the
sample data. These findings and implications are several. One, SQGs occurring during the
strategy implementation process can affect it and may become embedded in the
Two, when this happens, subsequent organizational activity will be severely affected; the
implementation process will probably be considered unsuccessful; and the organization’s
competitiveness will be diminished.
Three, being aware of the SQGs that might occur can help in preventing them and in
limiting their broader consequences. More generally, the challenge of implementation
requires that managers are aware of the character and importance of each organizational
dimension; of the eventual unanticipated behavior of organizational dimensions; of each
stage of the dynamic strategy process; and of SQGs’ pervasiveness, character, and
behavior during the process. The proposed models can contribute to raising understanding
of these factors. The models can also be adapted to specific organizations and be used to
anticipate what SQGs might occur at each implementation stage, what organizational
dimensions might be affected, and what organizational dimensions might be managed at
each stage to eliminate the gaps.
Four, when a SQG does occur, and is recognized, it should not be underestimated by the
manager for three reasons. One, the gap may not stand in isolation, but might coexist with
others, making the problem much more complex than it seems. Two, manipulation of one
organizational variable alone may be insufficient to eliminate any one gap—the
elimination of which may require an integrated and coherent approach. Three, even if an
existing gap has been dealt with and eliminated; it may reappear, at some later stage, for
the same or for different reasons, making constant surveillance mandatory.
CONCLUSION
Validation of the four models developed elsewhere (Cândido and Morris 2000, 2001)
evidence that in fact supports their validity. Moreover, the features of the table linking the
models and the resulting implications for managers are also supported by sample data.
These include several features and implications:
SQGs can affect the strategy process and become embedded in the organization.
Subsequent organizational activities and competitiveness will be severely affected.
The challenge of implementation requires that managers understand every stage of
the strategy process, every organizational dimension, and their possible
unanticipated and inconsistent behavior during the process. An understanding of
each SQG and of resistance to change is fundamental. The proposed models can
help raising this understanding and should help to successfully implement any
strategy. For instance, they would help in anticipating what organizational
dimensions will be most affected by SQGs and by resistance, at each stage of the
process, and what variables can be used to prevent and eliminate gaps and
resistance.
Managers should not underestimate SQGs, because a gap may not stand in
isolation; because manipulation of one organizational variable alone may be
insufficient to eliminate it; and because any gap may reappear, at some later stage.
This study concludes that individual managers, in the FFSHA, manipulate only a limited
group of organizational variables. On average, each manager manipulates only nine of the
variables in the static model, and hence is not exploiting all kinds of direct positive
impacts that they can obtain. They are either ignoring many of the dimensions that can be
managed or relying on the indirect effects that can be produced through interactions
among dimensions. Such confidence in indirect effects does not seem appropriate, since
important implication from this conclusion is that managers should try to expand the
number of dimensions that they manage instead of relying only on their personal
experience with a limited set of variables. This study’s data is examined further elsewhere,
revealing additional management recommendations (Cândido 2001, 2003).
Acknowledgements—The author expresses profound gratitude to D. S. Morris for his
invaluable contribution to this paper. He also acknowledges the funding support provided
by the Portuguese/E.U. Programme “Sub-Programa Ciência e Tecnologia do 2º Quadro
Comunitário de Apoio”; by Fundação para a Ciência e a Tecnologia
(SFRH/BSAB/863/2008); by Faculdade de Economia, Universidade do Algarve; and by
Newport Business School, University of Wales.
REFERENCES
Alexander, L.
1985 Successfully Implementing Strategic Decisions. In Turning Strategy into Action, K. Irons, ed., pp. 9-15. Oxford: Pergamon Press.
Andrews, K., C. Christensen, E. Learned, and W. Guth
1969 Business Policy, Text and Cases, (revised ed.).Homewood: Irwin. Ansoff, H., and E. McDonnell
1990 Implanting Strategic Management. New York, NY: Prentice Hall International. Brogowicz, A., L. Delenem, and D. Lyth
1990 A Synthesised Service Quality Model with Managerial Implications. International Journal of Service Industry Management 1(1):27-46.
Brown, S., and T. Swartz
1989 A Gap Analysis of Professional Service Quality. Journal of Marketing 53(2):92-98. Cândido, C.
2001 Implementation of a Service Quality Strategy: Application to the Algarve Hotel Industry. PhD thesis in Management, Sheffield Hallam University, UK. Sourced <ethos.bl.uk>.
2003 Contrasting Portuguese and International Service Quality Management in the Algarve Hotel Industry. The International Journal of Applied Management 4:37-54. Cândido, C., and D. Morris
2000 Charting Service Quality Gaps. Total Quality Management 11(4/5/6):S463-S472. 2001 The Implications of Service Quality Gaps for Strategy Implementation. Total
Quality Management 12(7/8):825-833. Cândido, C., and S. Santos
2008 Strategy Implementation: What is the Failure Rate? In SLADE 2008 –2º Encontro Luso Brasileiro de Estratégia, F. Serra, M. Almeida and J. Esperança, eds. Lisboa: ISCTE. Sourced < www.elbe2008.org>.
2009 Taxa de Insucesso na Implementação da Estratégia Empresarial: Uma Questão Controversa. Revista Portuguesa e Brasileira de Gestão 8(2):10-18.
Chandler, A.
1962 Strategy and Structure: Chapters in the History of the American Industrial Enterprise. Cambridge, MA: The MIT Press.
Galpin, T.
1997 Making Strategy Work: Building Sustainable Growth Capability. San Francisco, CA: Jossey-Bass Publishers.
Gore, C., K. Murray, and W. Richardson
1992 Strategic Decision-Making. London, United Kingdom: Cassell. Grönroos, C.
1990 Service Management and Marketing: Managing the Moments of Truth in Service Competition. MA: Lexington Books.
Hrebiniak, L., and W. Joyce
1984 Implementing Strategy. New York, NY: Macmillan. Hussey, D.
1996a A Framework for Implementation. In The Implementation Challenge, D. Hussey, ed., pp. 1-14. Chichester: Wiley.
1996b Introduction. In The Implementation Challenge, D. Hussey, ed., pp. ix-xi. Chichester: Wiley
Irons, K.
1991 Turning Strategy into Action. In Turning Strategy into Action, K. Irons, ed., pp. 1-5. Oxford: Pergamon.
INE – Instituto Nacional de Estatística
1999 List of the hotel names, categories, addresses and other relevant information, provided by INE on special request. Lisbon: INE.
Johnson, G., and K. Scholes
1999 Exploring Corporate Strategy: Text and Cases. Prentice Hall. Leavitt, H.
1964 Applied Organization Change in Industry: Structural, Technical, and Human Approaches. In New Perspectives in Organization Research, W. Cooper, H. Leavitt and M. Shelly. New York: Wiley.
Leavitt, H., W. Dill, and H. Eyring
1973 The Organizational World: A Systematic View of Managers and Management. New York: Harcourt Brace Jovanovich.
Lewin, K.
1947 Frontiers in Groups dynamics. In Field Theory in Social Science: Selected Theoretical Papers, K. Lewin, ed., pp. 188-237. London: Tavistock.
1952 Field Theory in Social Science: Selected Theoretical Papers. London: Tavistock. Parasuraman, A., V. Zeithaml, and L. Berry
1985 A Conceptual Model of Service Quality and Its Implications for Future Research. Journal of Marketing 49:41-50.
Peters, T.
1984 Strategy Follows Structure: Developing Distinctive Skills. California Management Review 26(3):111-125.
Peters, T., R. Waterman, and J. Phillips
1980 Structure is not Organization. Business Horizons 23(3):14-26. Schein, E.
1964 Management Development as a Process of Influence. In Readings in Managerial Psychology, H. Leavitt and L. Pondy, eds., 331-351. Chicago: The University of Chicago Press.
1. Paradigm/ model of the
world 2. Managerial attitudes, skills, roles and styles
3. Strategy content 4. Structure 5. Facilities, equipment, their technology and capacity 6. Information and communication systems 7. Decision processes 8. Service analysis, design,
external communication and delivery systems 9. Rules, policies and task descriptions 10. Measurement, control and reward systems 11. Organizational
competencies 12. People
13. Power structures (formal and informal) 14. Involvement 15. Values and norms
16. Stories 17. Symbols 18. Rituals, routines
and ceremonies 19. Financial resources
20. Time (timing, coordination, programming, urgency…)
Figure 1 Static Model: Fundamental Dimensions of Strategy Implementation. Source: Cândido and Morris (2001).
11. Planning/modular planning for change 12. Experimentation/pilot project
13. Realigning organisational dimensions to create competencies & behaviours 14. Monitoring, controlling the process and refining
15. Rewarding and recognition
16. Refreezing 16. Sustaining change 7. Building a supportive climate
8. Organisational flux (debate) 9. Information building
10. Building implementability into planning
5. Definition and clarification of the mission and strategy contents 6. Behavioural diagnosis
1. Stimulus – awareness of the issue/need for change 2. Assessment of the degree of change required/impact of the issue
3. Assessment of the time available, time required and urgency 4. Choice of management style(s)
U NFREEZ IN G AND PR E P A RIN G F O R C HA N G E C H A N GING R EFREEZING OR SU S TA ININ G C HA N G E
Figure 2 Dynamic Model: Strategy Implementation Avoiding Resistance to Change. Source: Cândido and Morris (2001).
1 2 3 4 5 1 2 3 4 5 6 7 8 9 10 11 12 13 14 M e a n im p o rt a n ce l e v el
Codes of the service quality gaps (according to Table 1)
Figure 3 Mean Importance Level of the Gaps on a 5-point Likert Scale (Note: number of respondents: 26).
0 5 10 15 20 1 2 3 4 5 6 7 8 9 10 11 12 13 14 15 16 17 18 19 N u m b e r o f h o te ls
Code s of the dim ensions (according to Figu re 1)
Figure 4 Number of Hotels Manipulating each Organizational Dimension. (Notes: The 20th dimension, time, is not considered here, as it is included in the dynamic model. Number of respondents: 24).
1 2 3 4 5 1 2 3 4 5 6 7 8 9 10 11 12 13 14 15 16 M e a n i m p o rt a n ce le v e l
Codes of the stages in the process (according to Figure 2)
Figure 5 Mean Importance Level of the Stages in the Dynamic Model. (Note: number of respondents: 18).
Table 1. The 14 Service Quality Gaps in the Model
1. Management perceptions 2. Service quality strategy
3. Service design and service quality specifications in terms of customers’ expectations
4. Quality supportive financial function 5. Internal communications
6. Integration/coordination
7. Coordination of other people and/or organizations in the value system
8. Selection, training, and adequate levels of autonomy, power and rewards to personnel
9. Service delivery 10. External communications
11. Contact personnel perceptions of customers’ expectations
12. Contact personnel perceptions of customers’ experiences
13. Customer perceptions 14. Service quality evaluation
Table 2. Category of the Hotel
Category
Populationa First Sample Second Sample
Freq. % Freq. %. % of the
population Freq. % % of the population 5 star 9 24 6 23 67 4 22 44 4 star 28 76 20 77 71 14 78 50 Total 37 100 26 100 70 18 100 49 a
Table 3. Independence and Category of the Hotels in the Samples
First Sample Second Sample
Independence 5 star 4 star 5 star 4 star
Freq. % Freq. % Total Freq. % Freq. % Total International chain 3 60 2 40 100 2 67 1 33 100 Portuguese chain 3 27 8 73 100 2 22 7 78 100 Independent hotel 0 0 10 100 100 0 0 6 100 100 Total 6 23 20 77 100 4 22 14 78 100
Table 4. Intermediate States during Change in an Organizational Dimension
Manager Opinion Perce
ntage There are intermediate states. They deserve monitoring, deliberation and manipulation. 82% Whether there are or not any intermediate states, they are not important from a
management point of view. Eventual intermediate states need neither monitoring nor manipulation.
6%
Other opinion 12%