multi-scale line and edge coding
R.J.R. de Sousa, J.M.F. Rodrigues and J.M.H. du Buf Vision Laboratory, Institute for Systems and Robotics (ISR/IST), University of the Algarve (ISE and FCT), 8005-135 Faro, PortugalAbstract. Face-to-face communications between humans involve emo-tions, which often are unconsciously conveyed by facial expressions and body gestures. Intelligent human-machine interfaces, for example in cog-nitive robotics, need to recognize emotions. This paper addresses fa-cial expressions and their neural correlates on the basis of a model of the visual cortex: the multi-scale line and edge coding. The recognition model links the cortical representation with Paul Ekman’s Action Units which are related to the different facial muscles. The model applies a top-down categorization with trends and magnitudes of displacements of the mouth and eyebrows based on expected displacements relative to a neutral expression. The happy vs. not-happy categorization yielded a correct recognition rate of 91%, whereas final recognition of the six ex-pressions happy, anger, disgust, fear, sadness and surprise resulted in a rate of 78%.
1
Introduction
Currently, one of the most investigated topics of image analysis is face detec-tion and recognidetec-tion [23, 11]. There are several reasons for this trend, such as the wide range of commercial vigilance and law-enforcement applications. Al-though state-of-the-art recognition systems have reached a certain level of ma-turity, their accuracy is still limited when imposed conditions are not perfect: all possible combinations of illumination changes, pose, beards, different facial ex-pressions, etc. Solving the problem of facial expression recognition by using the same approach as used for face recognition [18] will solve part of the problem: the detected expression can be morphed to a neutral one for more robust face recognition.
Furthermore, intelligent interaction between humans and computers is an emerging research area related to interfaces and robots. Since face-to-face com-munications between humans involve emotions and what they convey [15], facial expressions are also important in advanced human-machine interfaces. The Fa-cial Action Coding System or FACS [4] is probably the most well-known study about the coding of facial actions. FACS measures the behavior of the facial activity, and facial expressions are described by 44 Action Units (AUs), of which 30 are related to the contraction of muscles, 12 in the upper part of the face and 18 in the lower part.
Pantic and Rothkrantz [16] used color images with frontal as well as profile views of faces. By detecting 10 positions of the profile views and 19 of the frontal views, describing 32 AUs, they obtained a correct recognition rate of emotions of 86%. Barlett et al. [14] created a system which detects 20 AUs in frontal views of persons in realtime video sequences. Each frame was decomposed using Gabor filters, an AdaBoost classifier was used to extract relevant AUs, and a SVM classifier yielded a recognition rate of 93%. Feitosa et al. [21] used the same database that we will use in this paper, i.e., well-framed images in order to simplify face detection. They extracted emotion features using PCA and with neural networks they achieved a recognition rate of almost 72%. Gama [7] applied the Haar transform in a cascaded classifier to segregate facial images. Using Bayesian classifiers, she achieved a recognition rate of 80% in the case of happy vs. not happy, and 55% in the case of five different expressions: anger, happy, neutral, sadness and surprise. Kumano et al. [22] proposed a method for pose-invariant expression recognition in video sequences. By using a variable-intensity template for describing different expressions, they achieved a rate of over 90% for vertical faces with a rotation range of±40 degrees from the frontal view.
In this paper we present an approach which, like the one of Barlett et al. [14], employs Gabor filters. However, our goal is to develop more advanced models of the visual cortex. In cortical area V1 there are simple and complex cells, which are tuned to different spatial frequencies (scales) and orientations, but also disparity (depth) because of the neighboring left-right hypercolumns [9]. These cells provide input for grouping cells which code line and edge information and which probably attribute depth information to these. In V1 there also are end-stopped cells which, with complex inhibition processes, allow to extract keypoints (singularities, vertices and points of high curvature). Recently, models of simple, complex and end-stopped cells have been developed, e.g. [5], providing input for keypoint detection [5, 19] and line/edge detection [8, 20], including disparity extraction [6, 17]. On the basis of these models and neural processing schemes, it is now possible to create a cortical architecture for figure-ground segregation, Focus-of-Attention, including object and face categorization and recognition [20]. In this paper we focus on a cortical model for the recognition of facial expres-sions. This model only employs the multi-scale line/edge representation based on simple and complex cells. The line and edge coding is explained in Section 2. Section 3 deals with the model devoted to facial expressions, i.e., the extraction of cortical AUs, expression classification and the cortical architecture. In Sec-tion 4 experimental results are presented and we conclude with a discussion in Section 5.
2
Multi-scale line and edge coding
In order to explain the model for facial expressions in relation to the model for face recognition [18], it is necessary to explain briefly how our visual system can reconstruct, more or less, the input image. Image reconstruction can be based on one lowpass filter plus a complete set of bandpass filters, such that the
frequency domain is evenly covered. This concept is the basis of many image coding schemes; it could also be used in the visual cortex because simple cells in V1 are often modeled by complex Gabor wavelets. These are bandpass filters [5], and lowpass information is available through special retinal ganglion cells with photoreceptive dendrites [2]. Activities of all cells could be combined by summing these in one cell layer that would provide a reconstruction or brightness map. But then there is a problem: it is necessary to create yet another observer of this map in our brain.
The solution is simple: instead of summing all cell activities, we can assume that the visual system extracts lines and edges from simple- and complex-cell responses, which is necessary for object recognition, and that responding “line cells” and “edge cells” are interpreted symbolically. For example, responding line cells along a bar signal that there is a line with a certain position, orientation, amplitude and scale, the latter being interpreted by a Gaussian cross-profile which is coupled to the scale of the underlying simple and complex cells. The same way a responding edge cell is interpreted, but with a bipolar, Gaussian-truncated, error-function profile; for more details and illustrations see [18, 20].
Responses of even and odd simple cells, corresponding to the real and imag-inary parts of a Gabor filter, are denoted by REs,i(x, y) and ROs,i(x, y), i being the orientation (we use 8 orientations). The scale s is given by λ, the wave-length of the Gabor filters, in pixels. We use 10 ≤ λ ≤ 27 with Δλ = 1. Re-sponses of complex cells are modeled by the modulusCs,i(x, y) = [{REs,i(x, y)}2+
{RO
s,i(x, y)}2]1/2.
The basic scheme for line and edge detection is based on responses of simple cells: a positive (negative) line is detected where RE shows a local maximum (minimum) andROshows a zero crossing. In the case of edges the even and odd responses are swapped. This gives four possibilities for positive and negative events. An improved scheme [20] consists of combining responses of simple and complex cells, i.e., simple cells serve to detect positions and event types, whereas complex cells are used to increase the confidence. Lateral and cross-orientation inhibition are used to suppress spurious cell responses beyond line and edge terminations, and assemblies of grouping cells serve to improve event continuity in the case of curved events.
Figure 1 (top row) shows one person of the JAFFE database [10] that we used in our experiments with, from left to right, anger, disgust, fear, happy, sadness and surprise. The middle row shows the neutral expression and its line and edge coding at five scales:λ = {10, 14, 18, 23, 26}. Different levels of grey, from white to black, show detected events: positive/negative lines and positive/negative edges, respectively. As can be seen, at fine scales many small events have been detected, whereas at coarser scales more global structures remain that convey a “sketchy” impression. The bottom row in Fig. 1 shows detected events of the non-neutral expressions (top row) at λ = 16 after applying a multi-scale stability criterion; see [20] for details. Stabilization leads to the elimination of events which are not stable over neighboring scales, and therefore to less but more reliable events.
Fig. 1. Top (left to right): anger, disgust, fear, happy, sadness and surprise. Middle: neutral expression with its line/edge coding at fine (left) to coarse (right) scales;λ =
{10, 14, 18, 23, 26}. Bottom: results at scale λ = 16, after multi-scale stabilization, for
each expression on the top row.
3
Cortical facial expression classification model
Because of the multi-scale line/edge representation with deformations at coarse scales (Fig. 1) it is necessary to introduce new AUs to classify each facial ex-pression. Therefore, three regions of interest (ROI) are defined, two covering the eyebrows and one covering the mouth. These ROIs actually correspond to the Focus-of-Attention regions as used in face recognition [18], but here we use rectangular ROIs to simplify the analysis.
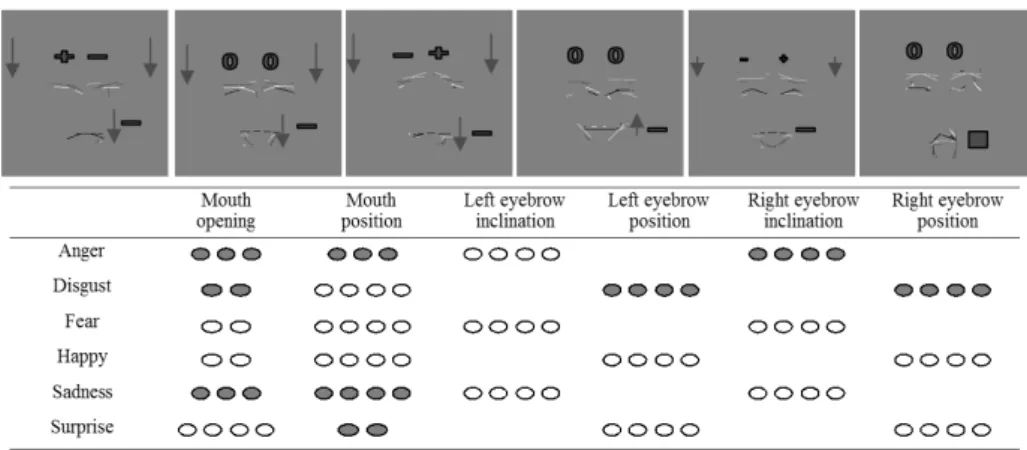
Knowing the AUs involved in the different expressions [24], it is possible to estimate the positions of the line/edge events in each ROI relative to those of the neutral expression. Figure 2 (top) shows the expected movements, where + and − represent inclinations and 0 is the same as the neutral expression. The square indicates an open mouth and the arrows global trends of the events. In the bottom part of Fig. 2, the open/solid dots represent up/down trends and the number of dots the magnitudes.
3.1 Extraction of cortical AUs
All face images in the JAFFE database are already normalized. For dealing with unnormalized face images, a cortical normalization scheme based on keypoints (end-stopped cells) can be applied [3]. The three ROIs are defined using the line/edge maps of the neutral faces. In the analysis of facial expressions, the same processing is applied as in the human visual system [13]: information at coarse scales is used for a first estimation of the expression, after which information at increasingly finer scales is added to confirm or correct the result. The basic approach is illustrated in Fig. 3: keypoints (yellow) detected at the corners of
Fig. 2. Top: movements of line/edge events relative to those of a neutral expression; left to right: anger, disgust, fear, happy, sadness and surprise. Bottom: table of movements and their magnitudes in the ROIs.
Fig. 3. Left: expressions neutral and surprise. Third image: keypoints (yellow crosses) at corners of mouth and eyebrows in the neutral face activate clusters of grouping cells (in red) which detect line or edge events in the non-neutral face (right image).
the mouth and eyebrows in the neutral face (third image) activate clusters of grouping cells (red) which combine line or edge events in the non-neutral face (at right).
Positive and negative line events at any scale consist of excitatedL+andL− cells at positions (x, y) with output one (cell is active) or zero (cell is not active). Likewise, outputs of edge cellsE+andE−are also binary. Outputs of clusters of such cells are combined (summed) by grouping cells with specific dendritic fields, the outputs of which therefore correspond to the number of active cells in their fields. In the ROI of the mouth, coarse scales are screened for a negative line matching a closed mouth and for a positive line matching an open mouth; see the left two columns of Fig. 4. This is achieved by defining grouping cellsS+and
S− with horizontal and very elongated (linear, elliptical) fields at neighboring
vertical (yi) positions. The two cells S+(y1) andS−(y2) with maximum output are selected using non-maximum suppression, and of these two the one with the largest response yields the state of the mouth: open (S+) or closed (S−). This processing is applied at six coarse scales and at least four scales must yield the
Fig. 4. First two columns: coarse scale λ = 23 (top) and fine scale λ = 10 (bottom) of a person with closed and open mouth. Third an fourth column: the ROI of the mouth with all events at scaleλ = 12 (top) and only edges (bottom). Fifth column: the same as the previous two columns, but the ROI of an eyebrow and only negative lines at the bottom.
same result for defining the state of the mouth. If the result is not convincing, medium and fine scales are added.
At medium and fine scales, see Fig. 4 (bottom, first two columns) the edges of the lips, i.e., the transitions between lips and skin, are relevant. The figure shows in detail (3rd and 4th column) an open and a closed mouth at scaleλ = 10. The analysis as described above is applied using only edge cells E+ and E−, and grouping cellsS±atyi, with horizontal elliptical dendritic fields, which combine both edge polarities. The outputs of the cells S± are thresholded and the two cells at the lowest and highest position y in the mouth’s ROI yield the size of the mouth (magnitude of opening) as well as the vertical position of the mouth. In each of both ROIs of the eyebrows, the processing is similar to the one for detecting the size of the mouth, but there are in each ROI two clusters of grouping cells in order to determine the inclination angle: one vertical cluster at the left and another vertical cluster at the right of the ROI. Figure 4 (last column) shows a detail image. Here we need to analyse a finer scale (λ = 10) be-cause of the relatively thin eyebrows and only responses ofL−cells are summed. In each cluster of grouping cells the cell with maximum response is selected by non-maximum suppression, and the two selected cells on both sides of the ROI code the inclination angle as well as the eyebrow’s vertical position.
In summary, the ROI of the mouth produces the state of the mouth, open or closed, and the vertical position on the mouth. The ROI of each eyebrow yields the inclination angle plus the vertical position.
3.2 Classification schemes
Two classification schemes were tested: (1) a direct classification of the six groups anger, disgust, fear, happy, sadness and surprise [24], plus two group combina-tions; and (2) a classification with pre-categorization levels as previously applied
Fig. 5. Examples of images from the JAFFE [10] database.
to other, non-face objects [1, 20]. The pre-categorizations consisted of the follow-ing levels. The first level discriminates happy and not-happy. At the second level, the not-happy group is further divided into anger, sadness and fear, whereas the happy group is split into happy and surprise. At the last classification level, the fear group is split into fear and surprise, and the anger group into anger and disgust. Please note that surprise is classified twice, in opposite groups, because this expression can have two contexts. The above group divisions are based on previous work by other authors. Gama [7] proposed a separation of expressions into two groups, happy and not-happy. Kumano et al. [22] proposed four groups: anger, sadness, surprise and happy. Our own scheme is slightly different because we also added the group fear which the other authors, apart from Zhang [24], left out.
4
Experimental results
As mentioned above we used the JAFFE database [10] and selected seven ex-pressions (neutral plus anger, disgust, fear, happy, sadness and surprise) of 10 women; see Fig. 5. The extracted facial features were processed using a Bayes minimum-distance classifier, i.e., without more advanced statistical methods like PCA, because this is a first test of the developed multi-scale method. Apart from the schemes described in the previous sub-section, we tested three feature combi-nations (C1–C3), taking into account that all features are relative to the features of the same woman with a neutral expression: (C1) the agreement of the trends of the features when compared to Fig. 2 (bottom); (C2) comparing only the
magnitudes of the trends; and (C3) the combination of both.
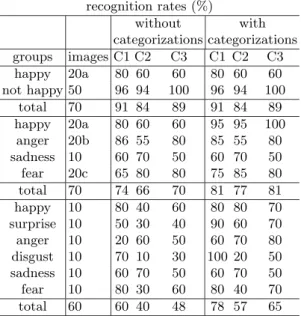
Table 1 presents the results of our experiments, without pre-categorizations, i.e., direct classification of the groups of expressions, and with the three catego-rization levels, all with feature combinations C1, C2 and C3.
Results without and with pre-categorization into happy and not-happy are obviously equal and quite good: 91% using C1 (only trends), 84% using C2 (only magnitudes), and 89% using C3 (both). This means that one can and should
recognition rates (%) without with categorizations categorizations groups images C1 C2 C3 C1 C2 C3 happy 20a 80 60 60 80 60 60 not happy 50 96 94 100 96 94 100 total 70 91 84 89 91 84 89 happy 20a 80 60 60 95 95 100 anger 20b 86 55 80 85 55 80 sadness 10 60 70 50 60 70 50 fear 20c 65 80 80 75 85 80 total 70 74 66 70 81 77 81 happy 10 80 40 60 80 80 70 surprise 10 50 30 40 90 60 70 anger 10 20 60 50 60 70 80 disgust 10 70 10 30 100 20 50 sadness 10 60 70 50 60 70 50 fear 10 80 30 60 80 40 70 total 60 60 40 48 78 57 65
Table 1. Overview of all results. Notes: a – happy also includes surprise; b – anger also includes disgust; c – fear also includes surprise.
use generic information at coarse scales [13]. In the categorization happy-anger-sadness-fear the results are similar, which indicates that we need more detailed information at finer scales, but the use of the first pre-categorization level (happy vs. not-happy) leads to better results if compared to direct classification: 74, 66 and 70% against 81, 77 and 81%. The same trend can be seen after final recognition of all six expressions anger, disgust, fear, happy, sadness and surprise: 60, 40 and 48% against 78, 57 and 65%. Remarkable is the fact that in almost all cases the use of only binary trends (C1) yields better results than using only magnitudes (C2) and even the combination of both (C3), which requires further analysis in order to optimize the results, i.e., the relative weighting of binary and non-binary features. Comparing our first results with those of other groups who used the JAFFE database, Feitosa et al. [21] achieved a best rate of 73% for the same six facial expressions, where our method achieved 78%. Zhang and Ji [24], who used another database with the same six expressions, achieved only 72% (see Introduction). Clearly, results can and must be improved by finetuning the algorithms.
5
Discussion
The scheme for expression recognition will be part of an integrated architecture for object and face recognition with two data streams, one devoted to general objects which can be arbitrarily rotated in 3D, and the other devoted to faces which are normally seen upright and with near frontal view. In case of general
ob-jects, the multi-scale line/edge and keypoint representations of canonical views are stored as templates in memory, keypoints are used to route dynamically keypoints of an input object to a template in memory, and the same routing is applied to lines and edges for object recognition. Dynamic routing is necessary for position, size and rotation invariance, and coarse-to-fine-scale processing is applied for successive (pre-)categorizations until final recognition; see [20]. In case of faces, the same processing is applied for face detection and normalization using keypoints [3], after which faces can be recognized together with their ex-pression using the line/edge codes. It is likely that exex-pression is extracted before recognition, i.e., if face normalization using keypoints at eyes, nose and mouth also normalizes the expression to neutral. This is subject of ongoing research.
The framework for expressions presented in this paper is based on their neural correlates relative to the line/edge coding of neutral faces. To this purpose new AUs were defined because of the multi-scale representation with coarse-to-fine-scale processing, which allows us to apply a few categorization levels for refining the analysis. Multi-scale stabilization of the line and edge features proved to be important, because the most reliable features are used whereas other ones caused by minor variations are discarded. As expected, the positions and polarities of the lines and edges in the ROIs, combined with the AUs as proposed by Matsumoto and Ekman [12] (Fig. 2), yielded encouraging results. The use of mainly coarse-scale information in the first two-group categorization, which is very stable by definition, yielded a recognition rate of 91%. Using additional information in the subsequent four-group categorization yielded 81%, and final six-group recognition still 78%. Ongoing research addresses a detailed analysis of the data and refinement of the method, i.e., a systematic use of scales by starting with coarse scales only and then adding successively finer scales [1, 20]. In addition, tests with a database of Caucasian faces are conducted, with the possibility of creating generic templates with a neutral expression, both Japanese and Caucasian.
Acknowledgements
This research is partly supported by the Foundation for Science and Technology FCT (ISR/IST pluri-annual funding) through the POS-Conhecimento Program which includes FEDER funds, and by the FCT projects PTDC/EIA/73633/2006 (SmartVision: active vision for the blind) and PTDC/PSI/67381/2006 (Neural correlates of object recognition).
References
1. A. Oliva et al. Top-down control of visual attention in object detection. IEEE
Proc. Int. Conf. Image Processing, 1:253–256, 2003.
2. D. Berson. Strange vision: ganglion cells as circadian photoreceptors. TRENDS
3. J. Cunha, J. Rodrigues, and J.M.H. du Buf. Face normalization using multi-scale cortical keypoints. Proc. 13rd Portuguese Conf. on Pattern Recogn., page 2, 2007. 4. P. Ekman and W. Friesen. Facial action coding system (FACS): Manual. Palo
Alto: Consulting Psychologists Press, 1978.
5. F. Heitger et al. Simulation of neural contour mechanisms: from simple to end-stopped cells. Vision Res., 32(5):963–981, 1992.
6. D.J. Fleet, A.D. Jepson, and M.R.M. Jenkin. Phase-based disparity measurement.
CVGIP: Image Understanding, 53(2):198–210, 1991.
7. S. Gama. Facial emoticons: Reprodu¸c˜ao de informa¸c˜ao associada a express˜oes faciais por via do seu reconhecimento. Master Thesis, IST Lisbon, 100 pp., 2009. 8. C. Grigorescu, N. Petkov, and M.A. Westenberg. Contour detection based on
nonclassical receptive field inhibition. IEEE Tr. IP, 12(7):729–739, 2003. 9. D.H. Hubel. Eye, brain and vision. Scientific American Library, 1995.
10. M. Kamachi, M. Lyons, and J. Gyoba. Facial expression database: Japanese female facial expression (JAFFE) database. http://kasrl.org/jaffe.html, February 2009. 11. T. Massimo, B. Manuele, and G. Enrico. Dynamic face recognition: From human
to machine vision. Image Vision Comput., 27(3):222–232, 2009.
12. D. Matsumoto and P. Ekman. Facial expression analysis. Scholarpedia, 3(5):4237, 2008.
13. B. Moshe. A cortical mechanism for triggering top-down facilitation in visual object recognition. J. Cognitive Neuroscience, 15(4):600–609, 2003.
14. M.S. Bartlett et al. Fully automatic facial action recognition in spontaneous be-havior. IEEE Proc. 7th Int. Conf. on Automatic Face and Gesture Recognition, pages 223–230, 2006.
15. D. Neth and A. M. Martinez. Emotion perception in emotionless face images suggests a norm-based representation. Journal of Vision, 9(1:5):1–11, 2006. 16. M. Pantic and L.J.M. Rothkrantz. Facial action recognition for facial expression
analysis from static face images. IEEE Tr. on Systems, Man, and Cybernetics, 34(3):1449–1461, 2004.
17. J. Rodrigues and J.M.H. du Buf. Visual cortex frontend: integrating lines, edges, keypoints and disparity. Proc. Int. Conf. Image Anal. Recogn., Springer LNCS Vol. 3211:664–671, 2004.
18. J. Rodrigues and J.M.H. du Buf. Face recognition by cortical multi-scale line and edge representations. Proc. Int. Conf. on Image Analysis and Recognition, Springer LNCS 4142:329–340, 2006.
19. J. Rodrigues and J.M.H du Buf. A cortical framework for invariant object catego-rization and recognition. Cognitive Processing, 10(3):243–261, 2009.
20. J. Rodrigues and J.M.H du Buf. Multi-scale lines and edges in v1 and beyond: brightness, object categorization and recognition, and consciousness. BioSystems, 95:206–226, 2009.
21. R.Q. Feitosa et al. Facial expression classification using RBF and back-propagation neural networks. Proc. 6th Int. Conf. on on Information Systems Analysis and
Synthesis, pages 73–77, 2000.
22. S. Kumano et al. Pose-invariant facial expression recognition using variable-intensity templates. Int. J. Comput. Vision, 83(2):178–194, 2009.
23. W. Zhao et al. Face recognition: A literature survey. ACM Comput. Surv.,
35(4):399–458, 2003.
24. Y. Zhang and Q. Ji. Facial expression understanding in image sequences using dynamic and active visual information fusion. IEEE Proc. 9th Int. Conf. on


![Fig. 5. Examples of images from the JAFFE [10] database.](https://thumb-eu.123doks.com/thumbv2/123dok_br/18879584.932315/7.892.207.720.162.385/fig-examples-images-jaffe-database.webp)