2015/2016
An integrated use of Macroalgae as bioproducts source and
biosorbent for environmental applications
J
OÃOA
LBANO DAC
UNHAO
LIVEIRADissertation submitted for the degree of MASTER ON ENVIRONMENTAL ENGINEERING
President of the jury: Professor Manuel Fernando Ribeiro Pereira Associated Professor of the Chemical Engineering Department of the Faculty of
Engineering of the University of Porto
___________________________________________________________ Supervisor at the University: Professor Cidália Maria de Sousa Botelho Auxiliary Professor of the Chemical Engineering Department of the Faculty of
Engineering of the University of Porto
Supervisor at the hosting institution: Professor Irina Volf
Associated Professor of the Environmental Engineering and Management Department of the “Gheorghe Asachi” Technical University of Iasi, Romania
III
Acknowledgements
To Professor Cidália Botelho, I would like to express my most sincere gratitude for the motivation and guidance she provided me, as well as valuable ideas, which was essential to be able to complete this master thesis.
To Professor Irina Volf, for the support that she provided me during my mobility at Faculty of Chemichal Engineering and Environmental Protection of the “Gheorghe Asachi” Technical University of Iasi.
To PhD graduate Gabriela Ungureanu, for the availability and patience she has shown to me and for all the knowledges provided during the experimental work.
To my laboratory colleagues, Catalina Filote and Adina Lefter, which facilitated my setting to a new country and culture. Their friendship and help were very important during my mobility period.
To my colleagues from the Environmental Engineering Master’s program, for making the five years spent together an pleasing journey.
To my closest friends, that supported me in various ways, their friendship has a special role in my life.
To my girlfriend, Filipa, for the great support she gave me and for that unconditional love and friendship we share.
To my sisters and grandmothers, for all the caring that they gave me in all the chapters of my life.
But most of all, to my parents. For the belief they have in me and the strength they offer me. For the patience and education, for the love they give me every day with no restrictions. For them, specifically to my mother, I hope this graduation is an extra motivation for the future battles that she will have to face.
V
Abstract
Marine macroalgae are available in large quantities in many regions of the world and have been widely investigated as potential biosorbents for the removal of metals in wastewaters. However, few studies have been published on the biosorption of metals with seaweeds waste after the extraction of bioactive compounds.
This dissertation presents the study about: 1) the valorisation of macroalgae biomass based on the biorefinery concept giving rise to added-value byproducts like polyphenols and polysaccharides, and 2) the use of the produced waste to remove Cu(II) from contaminated wastewaters.
Chemical characterization of the two seaweeds studied, Ascophyllum nodosum and Ulva rigida, was performed. A.nodosum presented a higher percentage of ashes (13.8 ± 0.1 %) than U.rigida (10.9 ± 0.2 %). Regarding the percentage of polysaccharides,
A. nodosum presented a lower percentage (45 ± 2 %) than U. rigida (48.7 ± 0.1 %). About
the polyphenolic content, A. nodosum presented a higher value (0.95 mg GAE g-1) than
U.rigida (0.33 mg GAE g-1).
FTIR analyses of Ascophyllum nodosum, before and after Cu(II) biosorption, identified some of the main functional groups that play a key role in metal biosorption: carboxyl functional group – COOH and alcohol functional group - OH. FTIR analyses of
Ascophyllum nodosum were performed before and after extraction of polyphenols,
indicating that the lack of this bioactive compounds reduced the hydroxyl stretches. Preliminary biosorption tests for Cu(II) removal by Ascophyllum nodosum before and after extraction of polyphenols, present best results with A. nodosum virgin at pH values of 4 and 5. The adsorbed amount values obtained were in a range between 2.13-2.25 mg g-1.
The biosorption kinetics was found to be fast, with more than 50% of Cu(II) maximum adsorption equilibrium capacity attained within 15 minutes and equilibrium reached after 30 minutes. This kinetic data was fitted to pseudo first-order and pseudo second-order models.
VII
Resumo
As macroalgas estão disponíveis em grandes quantidades em muitas regiões do mundo e têm sido amplamente investigadas como possíveis biossorventes para a remoção de metais em águas residuais. No entanto, poucos estudos têm sido publicados sobre a biossorção de metais com resíduos de algas após a extração de compostos bioativos.
Esta dissertação apresenta o estudo sobre: 1) a valorização de macroalgas baseado no conceito de bio-refinaria dando origem a subprodutos de valor acrescentado, como polifenóis e polissacarídeos; 2) a utilização do resíduo obtido, após extração, para remover Cu(II) de efluentes contaminados.
Foi feita a caracterização química das duas macroalgas estudadas, Ascophyllum
nodosum e Ulva rigida. A alga A.nodosum apresentou uma maior percentagem de cinzas
(13,8 ± 0,1%) do que a alga U.rigida (10,9 ± 0,2%). Relativamente à percentagem de polissacarídeos, a alga A. nodosum apresentou uma percentagem menor (45 ± 2%) do que a alga U. rigida (48,7 ± 0,1%). Em relação aos polifenóis, a alga A. nodosum (0.95 mg GAE g-1) apresentou um valor mais alto do que a alga U. rigida (0.33 mg GAE g-1).
Realizou-se a análise FTIR da alga Ascophyllum nodosum, antes e depois da biossorção de Cu (II), onde foram identificados alguns dos principais grupos funcionais que desempenham um papel fundamental na biossorção de metais: COOH de carboxilo e C-OH de álcool. A análise FTIR da alga Ascophyllum nodosum antes e depois da extração de polifenóis, permitiu identificar que a falta deste composto bioactivo reduziu os grupos funcionais hidroxilo.
Os testes preliminares de biossorção de Cu(II) pela alga Ascophyllum nodosum antes e após a extração de polifenóis, apresentaram melhores resultados com alga A.
nodosum virgem nos valores de pH 4 e 5. Obteve-se quantidades adsorvidas na gama
2,13-2,25 mg g-1.
No estudo cinético da biossorção de Cu(II) verificou-se que mais de 50% da capacidade de biossorção da alga é preenchida nos primeiros 15 minutos e que o equilíbrio se atingiu após 30 minutos. Estes dados cinéticos foram representados adequadamente pelos modelos de pseudo primeira-ordem e de pseudo segunda-ordem.
IX
Table of Contents
1. Introduction... 1 1.1. Algae biomass ... 1 1.2. Macroalgae bioproducts ... 2 1.3. Metals ... 4 1.4. Biosorption ... 52. State of the art ... 7
2.1. Macroalgae ... 7
2.2. Bioproducts extracted from Macroalgae ... 8
2.3. Biosorption ... 10
2.3.1. Biosorbents ... 11
2.3.2. Macroalgae as biosorbent ... 12
2.3.3. Macroalgae wastes... 13
2.3.4. Comparative approach of the biosorption capacity ... 14
3. Materials and Methods ... 15
3.1. Macroalgae treatment ... 15
3.2. Macroalgae biomass chemical characterization... 15
3.2.1. Determination of humidity ... 15
3.2.2. Determination of total ash ... 16
3.2.3. Determination of total polysaccharides ... 17
3.2.3. Determination of polyphenolic content ... 19
3.2.4. FTIR spectra ... 20
3.3. Biosorption studies ... 21
3.3.1. Preliminary biosorption tests ... 21
3.3.2. pH effect tests ... 22
3.3.3. Biosorption kinetics studies ... 23
3.3.4. Biosorption isotherms studies ... 23
3.3.5. Analytical procedure ... 24
4. Results and discussion ... 25
4.1. Chemical characterization ... 25
4.1.1. Moisture ... 25
X
4.1.3. Total polysaccharides ... 26
4.1.4. Total Polyphenolic content ... 26
4.1.5. FTIR analysis ... 27
4.3. Preliminary biosorption tests ... 29
4.3.2. pH effect tests ... 29
4.4. Biosorption kinetics studies ... 31
4.4.1. Statistical comparison of the models ... 35
4.5. Biosorption equilibrium studies ... 36
5. Conclusions and future work suggestions ... 38
5.1. General conclusions ... 38
5.2. Future work suggestions ... 39
6. References ... 40
7. Attachments ... 49
7.1. Other works performed ... 49
XI
List of tables
Table 1 - Macroalgae division, biochemical characteristics and examples (Suganya et al.
2016). ... 7
Table 2 - Maximum biosorption capacities for copper removal from aqueous solutions at room temperature... 14
Table 3 - Standard parameters for the analysis of the glucose concentration. ... 18
Table 4 - Standard parameters for the analysis of the gallic acid concentration. ... 20
Table 5 - Technical parameters of spectrophotometer GBC Avanta. ... 24
Table 6 - Dominants stretching frequencies in seaweeds FTIR spectra. ... 28
Table 7 - Parameters for kinetics models (value ± interval for 95% confidence). ... 32
Table 8 - Pseudo first order model parameters others found in literature. ... 32
Table 9 - Pseudo second order model parameters found in literature. ... 33
Table 10 - Comparison of kinetic models (Pseudo first and second order) by F-test (confidence level 95%). ... 35
Table 11 - Parameters from the equilibrium model fitting Langmuir (value ± interval for 95% confidence). ... 37
XII
List of figures
Figure 1 - The main producers of seaweeds (Ghadiryanfar et al. 2016). ... 8
Figure 2 - RADWAG moisture analyser. ... 16
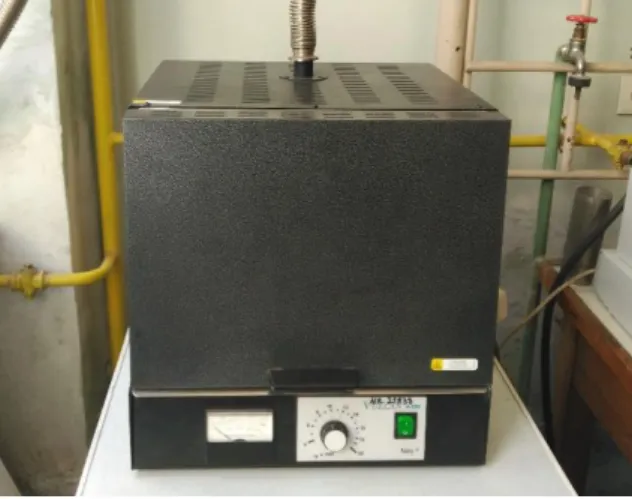
Figure 3 - Vulcan A-550, a muffle furnace. ... 16
Figure 4 - Hydrolization equipment with an ascending cooler and an heating mantle. 17 Figure 5 - Jasco V-550, an UV/VIS Spetrophotomer. ... 18
Figure 6 - Bandelin Sonomex ultra-sound bath. ... 19
Figure 7 - Digilab SCIMITAR Series equipment. ... 21
Figure 8 - GFL shaking incubator 3031 equipment. ... 22
Figure 9 - Flame atomic adsorption spectrometry, mod. GBC Avanta. ... 24
Figure 10 - FTIR spectra of ANv and ANw before and after copper biosorption. ... 27
Figure 11 - Adsorbed quantity of Cu (II) by ANw and URw using 25 mg L-1 metal solution, 10 g L-1 algae dosage at pH 2 and 5. ... 29
Figure 12 - Adsorbed quantity of Cu (II) by ANv and ANw using 25 mg L-1 Cu solution, 10 g L-1 algae dosage and pH 3,4,5. ... 30
Figure 13 - Kinetics for Cu(II) biosorption on ANv at pH 5 (initial concentration: 25 mg L -1 Cu solution; 10 g L-1 alga dosage): experimental data and modelling. ... 34
Figure 14 - Kinetics for Cu(II) biosorption on ANw at pH 5 (initial concentration: 25 mg L-1 Cu solution; 10 g L-1 alga dosage): experimental data and modelling... 34
Figure 15 -Equilibrium isotherm for Cu (II) biosorption on ANv and ANw at pH 5 (initial concentration: 100 mg L-1 Cu solution; 0.5,1,2,3 g L-1 alga dosage): experimental data and modelling ... 36
XIII
Notation
Acronyms
AAS Atomic adsorption spectroscopy
ANv Ascophyllum nodosum virgin ANw Ascophyllum nodosum waste
EAE Enzyme-Assisted Extraction
FTIR Fourier Transform Infrared Spectroscopy
GAE Gallic acid Equivalent
GVW-AC Green Vegetable Waste derived Activated Carbon
MAE Microwave-Assisted Extraction
PLE Pressurized Liquid Extraction
SE Standard Error
SFE Supercritical Fluid Extraction
TPC Total Polyphenolic content
UAE Ultrasound-Assisted Extraction
URw Ulva Rigida waste
Symbols
C0 Initial adsorbate concentration in the liquid phase (mg L-1)
Ce Equilibrium concentration (mg L-1)
Cs Sorbent dosage (g L-1)
Fc(0.05) Tabulated critical value of F for the probability level of 95%
Fcalc Calculated value of F
k1,ad Kinetic constant of the pseudo first order model (min-1)
k2,ad Kinetic constant of the pseudo second order model (g mg-1 min-1)
KL Langmuir constant (L mg-1)
q Amount of metal adsorbed (mg g-1)
qe Biosorbed amount in equilibrium (mg g-1)
XIV
R2 Determination coefficient (adimensional)
s2 Variance (mmol2 g-2)
T Temperature (ºC)
t time (s or min)
1. Introduction
Nowadays, the preservation of the environment is an issue widely discussed in order to avoid a sustainability crisis. The impact of industrial and other anthropogenic activities, not only in environment, is worrying due to a whole range of consequences that are already being felt such as climate change, pollution and crescent contamination in water and soil. While sustainability is about the future of our society, for today’s industries and businesses, it is also about commercial success. The directive to transform businesses to respect environmental limits while fulfilling social wants and needs has become an unparalleled platform for innovation on strategy, design, manufacturing and brand, offering massive opportunities to compete and to adapt to a rapidly evolving world (Sustainability 2016).
Thus, it is clear to many industry sectors that there is an enormous need to promote the use of biotechnology for the creation of bioproducts. Obtained from natural sources, bio-based products prevail over conventional fossil-based products in reinforcing energy security and reducing green-house gas effects (CO2,CH4,N2O, CFC’s) and other air pollutants. Bioproducts are considered sustainable, renewable and environment friendly products and are an emerging solution for sustainability issues faced by industries. Such requirements are met by algae biomass, an available natural resource with a very low cost and the capacity to produce vast array of high-value bioactive compounds (Suganya et al. 2016).
1.1. Algae biomass
Algae are photosynthetic aquatic organisms. They may be unicellular (microalgae) or multicellular (macroalgae). Macroalgae or “seaweeds” are an abundant multi-cellular plants that can be found in a salt or fresh water. Chemical composition of macroalgae species is significantly different from terrestrial plants. They include lower contens of carbon, hydrogen and oxygen and higher contents of nitrogen and sulfur than that of land-based, lignocellulosic biomass (Ghadiryanfar et al. 2016). According to their
2
pigmentation, they are divided into three broad groups: Brown (Phaeophyta), Red (Rhodophyta) and Green (Chlorophyta). Algae are known as a rich source of bioactive compounds and the properties of these compounds are used in various branches of industry, such as chemical, pharmaceutical, human food, and animal feed production and integrated systems of plant cultivation.
1.2. Macroalgae bioproducts
Algae can be processed in different ways to obtain a wide spectrum of products. These products can be divided into bioproducts and biofuels, based on their potential usage. The principal bioproducts, in other words, non-energy products from algae are polysaccharides, pigments, proteins, lipids and phenolic compounds.
Marine algae contain large amounts of polysaccharides, such as starch, glucose, cellulose, dietary fibres, alginates, carrageenans, agar, fucoidan, mannitol and laminarin (Holdt and Kraan 2011). The major polysaccharide constituents of red algae are galactans such as carrageenans and agars. Major sugars, present in the brown macroalgae are laminarin, mannitol and alginate (Trivedi et al. 2015; Holdt and Kraan 2011). Algal polysaccharides represent a class of high-value compounds with many downstream applications in food, cosmetics, textiles, stabilizers, emulsifiers, lubricants, thickening agents and clinical drugs (Trivedi et al. 2015).
Besides chlorophyll, the most relevant algae pigments are phycobiliproteins and carotenoids. Phycobiliproteins are macromolecules that function as components of the photosynthetic apparatus in red algae and they have the potential as natural colorants for food, cosmetics and pharmaceuticals (Suganya et al. 2016). Carotenoids are isoprenoid molecules that are photosynthesized by plants, fungi and algae. Brown algae species contain β-carotene, violaxanthin and fucoxanthin, whereas red algae species contain manly α- and β-carotene, lutein and zeaxanthin. β-carotene, lutein, violaxanthin, neoxanthin and zeaxanthin are present in green algae species (Kadam et al. 2013). Carotenoids have anti-tumor and cancer preventive activity and they are also widely used as food colorants and supplements for human and animal feeds (Suganya et al. 2016).
3
Proteins can be used for different purposes such as animal/fish feeds, fertilizers, industrial enzymes, bioplastics and surfactants (Trivedi et al. 2015). The protein content of seaweeds differs according to species. Generally, the protein fraction of brown seaweeds is lower compared to that of green or red seaweeds (Holdt and Kraan 2011). Most seaweed species contain all the essential amino acids and are a rich source of the acidic amino acid, aspartic acid and glutamic acid. Essential amino acids such as histidine, leucine, isoleucine and valine are present in many seaweeds (Kadam et al. 2013).
Lipids are a broad group of naturally occurring molecules which includes fatty acids, sterols, fat-soluble vitamins (A, D, E and K), phospholipids and glycolipids. Red seaweed species contain significant quantities of polyunsaturated fatty acids. All the three types of macroalgae have a substantial content of sterols (Holdt and Kraan 2011).
Phenols are a class of chemical compounds consisting of a hydroxyl group (-OH) bonded directly to an aromatic hydrocarbon group, which may confer different and often stronger biological activities. Polyphenols in algae are phenolic acids, tannins, flavonoids, catechins and pholorannins and are present in most algal groups (Kadam et al. 2013). Green and red seaweed have low concentrations of phenols compared to brown seaweed species, which have high concentrations of the phenol group pholoratannin (Holdt and Kraan 2011). Purified polyphenolic compounds exhibit many activities such as antioxidant, anti-radical, UV-protection, metal- chelation (e.g. copper) and anti-fouling (Suganya et al. 2016).
The production of biofuels and biobased chemicals from algae is one of the most interesting topics in the sector of the biorefineries. The biorefinery concept integrates processes and technologies for an efficient biomass conversion using all components of a feedstock. The term “biorefinery” was created to describe the production of biofuels as well as high value co-products from biomass by the integration of bioprocessing and appropriate low environmental impacting chemical technologies in a cost-effective and environmentally sustainable manner (Trivedi et al. 2015). All processes during the biorefinery should be resource-efficient, and environmental impacts should be minimized or avoided (Jung et al. 2013). Advantages of macroalgae as biofuel feedstock includes atmospheric CO2 mitigation, entrapment of HCO3- in the water bodies by
4
reducing their acidic nature and acid rain hazards, promoting green fuel for green earth (Bharathiraja et al. 2015). Examples of biofuels obtained from algae are biodiesel, biogas, bioethanol and biojet fuel (Trivedi et al. 2015).
1.3. Metals
The metallurgical and energy production industries, as well as agriculture is responsible for the release of various pollutants into aquatic environment, such as metals, non-biodegradable dyes and detergents, pesticides and other organic pollutants. Metals are recognized as one of the most toxic groups and their occurrence in water causes great threats to humans and other living organisms.
The most common metals found in contaminated surface water, ground water and industrial wastewater are: Lead, mercury, chromium, arsenic, cadmium, zinc, copper and nickel (He and Chen, 2014).
Copper (Cu) is a transition metal that is stable in its metallic state and is most commonly present in the earth's crust as copper-iron-sulfide and copper sulfide minerals, e.g. chalcopyrite (CuFeS2), bornite (CusFeS4) and chalcocite (CuS). Metallic copper is malleable, ductile and a good thermal and electrical conductor. It has many commercial uses because of its versatility. Copper is used to make electrical wiring, pipes, valves, fittings, coins, cooking utensils and building materials. Needed only in trace amounts, the human body contains approximately 100 mg. Though an essential micronutrient for man, Cu is toxic at high levels and can cause adverse health effects like gastrointestinal bleeding, haematuria, intravascular haemolysis, hepatocellular toxicity and acute renal failure. Copper is found in surface water, groundwater, seawater and drinking-water and in water bodies can damage a variety of fishes and invertebrates. A provisional guideline value of 2 mg L-1 for drinking water was established to be protective against the adverse effects of copper (WHO 2004). In Portugal, 2 mg L-1 of copper is also the limit value for drinking water (Decreto-Lei n.o 306/2007). These metals are not biodegradable and therefore their elimination in wastewater is extremely important for public health.
5
1.4. Biosorption
Biosorption is a term that describes the removal of heavy metals by the passive binding to non-living biomass from an aqueous solution. Comparing with conventional methods for removing toxic metals from industrial effluents, the biosorption process offers the advantages of low operating cost, minimization of the volume of chemical and/or biological sludge to be disposed of, high efficiency in detoxifying very dilute effluents and no nutrient requirements (Kratochvil and Volesky 1998). Different kinds of natural biomass have been used to remove toxic metals from solution, such as, bacteria, fungi, green algae, red algae, brown algae, etc.
Algae are of special interest in search for and the development of new biosorbents materials due to their high sorption capacity andtheir availability in almost unlimited quantities in the seas and oceans. Seaweeds possess a high metal-binding capacity with the cell wall playing an important role in binding. This is due to the presence of various functional groups such as carboxyl, amino, sulfonic, and hydroxyl groups, which can act as binding sites for metals (Murphy et al. 2007).
Within this context, the aim of this work is to propose an alternative valorisation of macroalgae biomass based on the biorefinery concept giving rise to added-value byproducts. The waste produced from the bioactive compounds (particularly polyphenols compounds) extraction process will be used to remove metals from water by biosorption.
7
2. State of the art
2.1. Macroalgae
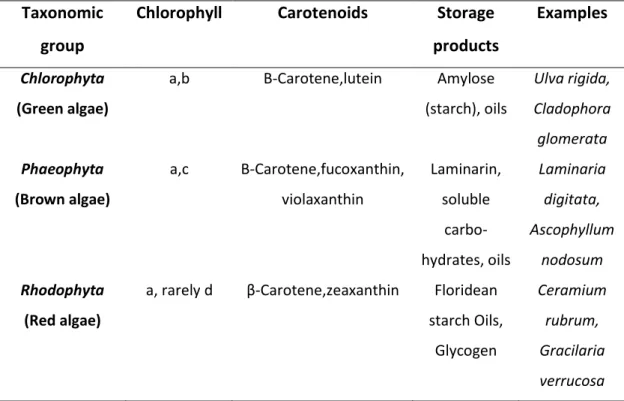
Macroalgae has also some unique constituents, including carrageenan, mannitol, agar, laminarin, mannan, ulvan, fucoidin, and alginate, all of which are not found in microalgae biomass (Jung et al. 2013). In the next table, is shown the biochemical characteristics and examples of the three major groups of macroalgae.
Table 1 - Macroalgae division, biochemical characteristics and examples (Suganya et al. 2016).
Taxonomic group
Chlorophyll Carotenoids Storage products
Examples
Chlorophyta (Green algae)
a,b Β-Carotene,lutein Amylose (starch), oils Ulva rigida, Cladophora glomerata Phaeophyta (Brown algae) a,c Β-Carotene,fucoxanthin, violaxanthin Laminarin, soluble carbo- hydrates, oils Laminaria digitata, Ascophyllum nodosum Rhodophyta (Red algae)
a, rarely d β-Carotene,zeaxanthin Floridean starch Oils, Glycogen Ceramium rubrum, Gracilaria verrucosa
The use of macroalgae is based essentially on the composition of the cell wall. Algae cell wall is constituted by different components such as polysaccharides, proteins and lipids. Brown algae cell walls are composed mainly by cellulose, alginic acid, polysaccharides and polymers complexed with light metals such as sodium, potassium, magnesium, calcium. The predominant active groups are alginate and sulphate. Green algae have mainly cellulose, while high percentage of the cell wall is protein bonded to polysaccharides. Proteins contain functional groups such as amino, carboxyl, sulphate, and hydroxyl, which participate significantly on the biosorption process. Red algae contain cellulose in cell wall, but their biosorption capacities can be mainly attributed on the presence of sulphated polysaccharides made of galactans (He and Chen 2014).
8
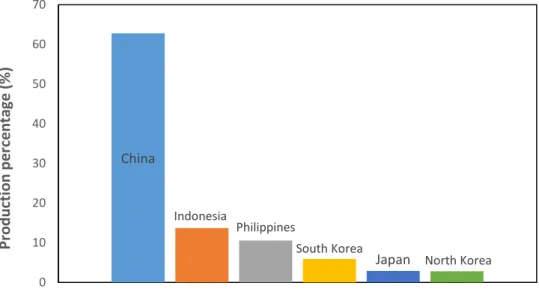
The global harvest of seaweeds for food and algae products is over 3 million tons annually, with potential harvests estimated at 2.6 million tons for red algae and 16 million tons for brown algae (He and Chen 2014). The most dominant producers of seaweeds are shown in the next chart.
2.2. Bioproducts extracted from Macroalgae
Extraction technologies such as enzyme-assisted extraction (EAE), microwave-assisted extraction (MAE), ultrasound-microwave-assisted extraction (UAE), pressurized liquid extraction (PLE) and supercritical fluid extraction (SFE) have been successfully used in food and pharmaceutical applications for extraction of bioactive compounds from macroalgae biomass (Kadam et al. 2013).
EAE is a high bioactive yielding technology by which unnecessary components from cell walls are removed and desired bioactives compounds are released. Is a eco-friendly and nontoxic method that suits well to the extraction of phlorotannins and other phenolic compounds from seaweeds, as it assists in breaking the complex bonding between phenolics and proteins in seaweed (Kadam et al. 2013). Wang et al. (2010) showed that enzyme-assisted extraction was effective in enhancing the recovery of polyphenols and other hydrophilic antioxidant compounds from the red algae Palmaria
palmata. Billakanti et al. (2013) demonstrated the extraction of lipids containing
China
Indonesia
Philippines
South Korea
Japan North Korea
0 10 20 30 40 50 60 70 Pr o d u cti o n p er ce n ta ge ( %) Seaweeds producers
9
polyunsaturated fatty acids and fucoxanthin from brown algae Undaria pinnatifida using an EAE process followed by dimethyl ether extraction. This process achieve almost the complete extraction of lipids and fucoxanthin.
MAE uses microwave energy to heat solvents in contact with a sample, rapid internal heating brings about effective cell rupture, releasing the analytes into the solvent (Vázquez-Delfin et al. 2013). The mechanism of MAE process has some advantages over traditional solvent extraction techniques such as improved extraction rate, lower use of solvents and improved extraction yield. The results obtained by Yuan and D. Macquarrie (2015) demonstrate that sulphated polysaccharides (fucoidans) could be successfully extracted from Ascophyllum nodosum by microwave assisted extraction technology in a much faster process compared with conventional extraction methods. Vázquez-Delfin et al. (2013) concluded that MAE could be an adequate procedure for carrageenan extraction from red algae Hypnea musciformis. Sousa et al. (2010) demonstrated that applying MAE in the extraction of agar from red algae
Gracilaria vermiculophylla, higher yields and reproducibility were obtained, when
compared to conventional extraction methods.
UAE is a simple and cost-effective method, that facilitates the extraction of heat-sensitive compounds with minimal damage. Benefits of using this process include an increase of extraction yield and faster kinetics. There are two main types of ultrasound equipment that can be employed for extraction purposes: an ultrasonic water bath, which was the method used to extract the polyphenols in this study, and an ultrasonic probe system fitted with horn transducers (Kadam et al. 2013). Wang et al. (2015) studied the UAE of taurine from red algae Porphyra yezoensis. Application of ultrasound improves the efficiency of the extraction process, required less extraction time and lower operating temperatures to obtain a taurine yield comparable to that obtained from conventional extraction. Kadam et al. (2015) studied UAE for the extraction of total phenolics, fucose and uronic acid from Ascophyllum nodosum. It was demonstrated that UAE can be employed to enhance extraction of bioactive compounds from seaweed.
PLE is a sample preparation technique that combines elevated temperature and pressure with liquid solvents to achieve fast and efficient extraction of the analytes from
10
the solid matrix (Shang et al. 2011). This method significantly reduces the quantity of solvents used and is a much faster technique than other solvent extraction techniques (Kadam et al. 2013). The results by Shang et al. (2011) demonstrated that statistical strategy was successfully applied for optimization of PLE method for fucoxanthin extraction from brown algae Eisenia bicyclis. This study concluded that PLE can be a powerful method, due to a extraction in a relatively short time with a non-toxic solvent. Anaélle et al. (2013) demonstrated the application of PLE and SFE in the extraction of polyphenols, using the brown algae Sargassum muticum as model. In particular, PLE seemed the most promising for the extraction of polyphenols that are endowed with useful antioxidant potential.
SFE is an eco-friendly technology with minimal or no use of organic solvents, that offers a fast extraction rate and high yield. This method has been widely employed in the food, pharmaceutical, pesticide and fuel industries (Kadam et al. 2013). In the work developed by Fabrowska et al. (2016), SFE has been employed to obtain extracts from 3 green algae: Cladophora glomerata, Ulva flexuosa and Chara fragilis. Bioactive compounds like fucoxanthin, lutein, chlorophyll α and astacene were successfully extract by SFE.
2.3. Biosorption
Metals and similar elements, as metalloids, are a big concern, considering their high toxicity. Three kinds of metals are of concern, including toxic metals (such as Hg, Cr, Pb, Zn, Cu, Ni, Cd, As, Co, Sn, Sb), precious metals (such as Pd, Pt, Ag, Au, Ru) and radionuclides (such as U, Th, Ra, Am) (J. Wang and Chen 2009). These elements should be treated when present in waste water and groundwater, because they can be a threat to public health when consumed above certain concentrations.
As mentioned previously, biosorption is a process resulting in the removal of substances from solution by non-living biological material (Gadd 2008).
The biosorption process therefore involves a solid phase, known as biosorbent (for example algae) and a liquid phase, solvent (normally water), containing the dissolved or suspended species to be sorbed (sorbate). The interaction of metal ions with the algae solution occurs in two steps: the first step involves biosorption on the cell
11
surface and occurs shortly after contact between the body and the metal ion. In the cell walls are the major biosorption sites which correspond to the functional amine groups, amide, hydroxy, carboxyl and phosphate among others (Vidotti and Rollemberg 2004).
2.3.1. Biosorbents
Nowadays, biosorption is a mature technology for removal of heavy metals due to the new discoveries of several biosorbents of different origins.
Vijayaraghavan and Balasubramanian (2015) mention that the performance of a biosorbent not only depends on the chemical composition of the biosorbent and the nature of solutes, but is also strongly influenced by operational parameters such as pH, temperature, ionic strength, co-ion concentration, sorbent size, reaction time, sorbent dosage and initial solute concentration. Among the different operational parameters, pH is the most important one which significantly influences the biosorbent characteristics and solution chemistry. The binding site functional group of a biosorbent, which plays a vital role in biosorption, strongly depends on the solution pH (Vijayaraghavan and Balasubramanian 2015).
A large quantity of materials has been investigated as biosorbents for the removal of metals. The tested biosorbents can be basically classified into the following categories: bacteria, fungi, yeast, algae, industrial wastes, agricultural wastes and other polysaccharide materials.
Several investigators used low-cost industrial and agricultural wastes for heavy metal biosorption (Sud et al. 2008; Abdolali et al. 2014). Among these wastes, crab shell, activated sludge and rice husk deserves particular consideration.
Grimm et al. (2008) compared the removal of copper ions from diluted water solutions with three types of biomass: birch wood Betula sp., marine brown alga Fucus vesiculosus, and terrestrial moss Pleurozium schreberi. The maximum sorption capacities determined from the experimental equilibrium isotherms by applying the Langmuir model showed that the algae had the best copper-binding ability, followed by the moss and the sawdust.
Sabela et al. (2016) demonstrated that green vegetable waste derived activated carbon (GVW-AC) could be used as an effective biosorbent for the treatment of
12
wastewater containing copper(II) ions. The isotherm study indicated that adsorption data correlated well with Langmuir isotherm model. When compared with activated carbons derived from other biosorbents, this study concluded that GVW-AC is better in terms of cost-effectiveness.
J.-Y. Wang et al. (2016) studied the biosorption of copper(II) from aqueous solutions by rice straw treated with Aspergillus niger, namely fermented rice straw. The obtained data suggested that the microbiologically-treated rice straw could become a promising biosorbent.
According to Blázquez et al. (2012), pine cone shell (PCS) was shown to be a promising biosorbent for Cu(II) removal from aqueous solutions. The biosorption capacity of PCS for Cu(II) was determined with the Langmuir model as 6.81 mg g-1.
2.3.2. Macroalgae as biosorbent
Marine algae have been the focus of numerous biosorption studies and their excellent metal-binding capacity has been well documented.
Based on a statistical review on biosorption, algae have been used as biosorbent material 15.3% more than other kinds of biomass and 84.6% more than fungi and bacteria (Anastopoulos and Kyzas 2015).
He & Chen (2014) mention that the maximum biosorption capacities (qmax in the Langmuir isotherm) for Cu(II) uptake with several types of brown algae are quite high. Among various brown algae, the Fucus sp. seems to better perform in copper uptake. The performance of brown algae is the best among the three macroalgae (brown, green and red).
Freitas (2007) concluded that the maximum biosorption capacity of Cu(II) by A.
nodosum is 78.2 mg g-1 at room temperature, pH 5.0 and 150 mg L-1 of initial Cu(II) concentration.
Karthikeyan et al. (2007) investigated the biosorption of Cu(II) with two different marine algae: Ulva fasciata (green algae) and Sargassum sp. (brown algae). Equilibrium isotherms and kinetics were studied to evaluate the relative ability of the two algae to sequester Cu(II) from aqueous solutions. The maximum biosorption capacity obtained was 73.5 mg g-1 for U. fasciata and 72.5 mg g-1 for Sargassum sp. at pH 5.5.
13
The capacity of marine green algae Helimeda gracilis for biosorption of Cu(II) ions from an aqueous solution was studied by Jayakumar et al. (2014). The biosorption followed the Langmuir model with the maximum sorption capacity of 38.5 mg g-1.
Mata et al. (2008) examined the recovery of cadmium, lead and copper with the brown alga Fucus vesiculosus. The metal uptakes deduced from the pseudo-second order kinetic model and the Langmuir isotherm model followed this sequence: Cu > Cd > Pb. According to the equilibrium constants of the isotherm model, the affinity of metals for the biomass followed this order: Pb > Cu > Cd.
2.3.3. Macroalgae wastes
The use of algal waste for biosorption processes is very promising due to the fact that large quantities of algal waste are generated every year and can be reused as adsorbent for metals before final disposal. On the other hand, the waste material is cheaper that other commercially available adsorbents.
Vilar et al. (2008) concluded that algae Gelidium biomass, algal waste from agar extraction, were able to remove and accumulate Cu(II) from aqueous solutions. For low metal concentration in solution the algal waste and algae Gelidium had similar uptake capacity, which is an important result due to the economic and ecological advantage that the waste has relatively to the algae. When compared with other waste materials, the algal waste showed a good adsorption capacity.
Bulgariu and Bulgariu (2012) investigated the biosorption of Pb(II), Cd(II), and Co(II) from aqueous solution on green algae waste. The green algae waste biomass was obtained from marine green algae after extraction of oil and, by the results, can be successfully used for the biosorption of the metals studied. The biosorption followed the Langmuir model with the maximum biosorption capacity of 74.6 mg g-1 for Pb(II) (initial concentration = 133 mg L-1) 39.4 mg g-1 for Cd(II) (initial concentration = 68 mg L-1) and 17.1 mg g-1 for Co(II) (initial concentration = 37 mg L-1) at pH 5.0 for all the metals.
Roberts et al. (2014), demonstrate that iron-based sorbents, which are a promising tool for the removal of Selenium from wastewater, can be produced from the
14
waste biomass that remains after the commercial extraction of agar from farmed seaweed Gracilaria edulis.
2.3.4. Comparative approach of the biosorption capacity
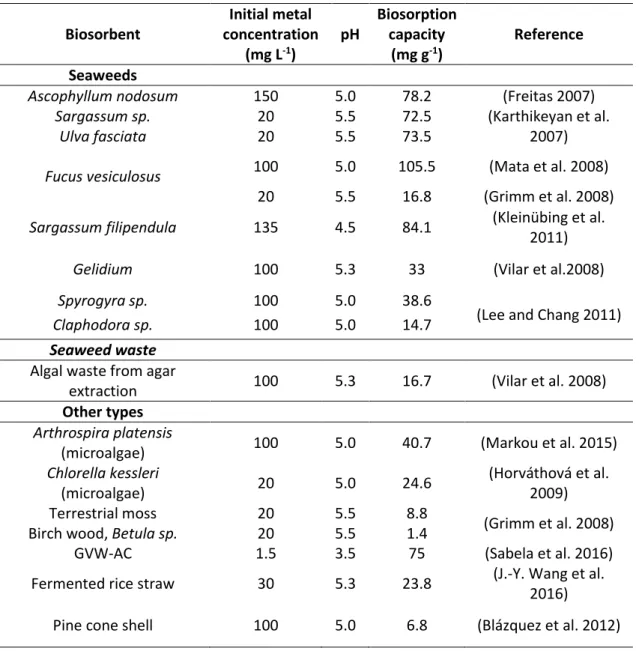
Table 2 describes the maximum biosorption capacities reported in the literature for seaweeds and other types of biosorbents. Along with these values, two other important aspects are documented to evaluate the potentiality of a biosorbent, the initial copper concentration and pH value.
Table 2 - Maximum biosorption capacities for copper removal from aqueous solutions at room
temperature. Biosorbent Initial metal concentration (mg L-1) pH Biosorption capacity (mg g-1) Reference Seaweeds
Ascophyllum nodosum 150 5.0 78.2 (Freitas 2007)
Sargassum sp. 20 5.5 72.5 (Karthikeyan et al.
2007)
Ulva fasciata 20 5.5 73.5
Fucus vesiculosus 100 5.0 105.5 (Mata et al. 2008)
20 5.5 16.8 (Grimm et al. 2008)
Sargassum filipendula 135 4.5 84.1 (Kleinübing et al.
2011)
Gelidium 100 5.3 33 (Vilar et al.2008)
Spyrogyra sp. 100 5.0 38.6
(Lee and Chang 2011)
Claphodora sp. 100 5.0 14.7
Seaweed waste Algal waste from agar
extraction 100 5.3 16.7 (Vilar et al. 2008)
Other types Arthrospira platensis
(microalgae) 100 5.0 40.7 (Markou et al. 2015)
Chlorella kessleri (microalgae) 20 5.0 24.6 (Horváthová et al. 2009) Terrestrial moss 20 5.5 8.8 (Grimm et al. 2008)
Birch wood, Betula sp. 20 5.5 1.4
GVW-AC 1.5 3.5 75 (Sabela et al. 2016)
Fermented rice straw 30 5.3 23.8 (J.-Y. Wang et al. 2016)
15
3. Materials and Methods
3.1. Macroalgae treatment
In this study, two different macroalgae were used: Ascophyllum nodosum and
Ulva rigida. The A. nodosum was collected on the Portugal North coast of Atlantic Ocean.
On the other hand, U. rigida was collected on the Romania Southeast coast of Black Sea. The seaweeds were washed firstly with tap water in 3 to 4 washing cycles of 30 minutes and after with distilled water in 10 to 12 washing cycles of 30 minutes, until the washing water reached a conductivity value of less than 10 μS cm-1. The purpose of this is to remove the impurities and epiphytes present in the seaweeds. The conductivity was measured using a DIST conductivity meter by Hanna Instruments.
After the washing process, the seaweeds were dried in the oven at 50º C for a minimum of 24 hours. The next step was to grind the algae to smaller particle size (approximately ≤ 0.5 cm). The grinder used was a RETSCH Grindomix GM200.
3.2. Macroalgae biomass chemical characterization
3.2.1. Determination of humidity
Once the drying process was complete, the next step was to determine the moisture (humidity) and ash content of the seaweeds.
For the determination of total moisture, 3 samples of 1 g, approximately, of each macroalgae have been analysed. The samples were prepared in a crucible and weighted in a Precisa XT 120 analytical balance. The analysis was run by a RADWAG moisture analyser, presented in the Figure 2.
16
3.2.2. Determination of total ash
The determination of ash was carried out using a muffle furnace Vulcan A-550, equipment shown in the Figure 3. The analysis of the samples was carried out in triplicate. Thus, depending on the density of the dried material, approx. 1-3 g dry algae were weighted in a Precisa XT 120 analytical balance and then placed in crucibles. The crucibles containing the biomass were heated at 600° C in the muffle furnace for 18 hours performing weighings at 5, 10, 14 and 18 hours, respectively until reaching a constant weight. The empty crucibles have been weighted after calcination at 600° C.
The determination of the ash percentage was calculated by the following equation: %𝐴𝑠ℎ = ( 𝑊𝑒𝑖𝑔ℎ𝑡𝑊𝑒𝑖𝑔ℎ𝑡𝑐𝑟𝑢𝑐𝑖𝑏𝑙𝑒 𝑎𝑓𝑡𝑒𝑟 𝑐𝑎𝑙𝑐𝑖𝑛𝑎𝑡𝑖𝑜𝑛− 𝑊𝑒𝑖𝑔ℎ𝑡𝑐𝑟𝑢𝑐𝑖𝑏𝑙𝑒 𝑒𝑚𝑝𝑡𝑦
𝑐𝑟𝑢𝑐𝑖𝑏𝑙𝑒 𝑤𝑖𝑡ℎ 𝑑𝑟𝑖𝑒𝑑 𝑠𝑎𝑚𝑝𝑙𝑒− 𝑊𝑒𝑖𝑔ℎ𝑡𝑐𝑟𝑢𝑐𝑖𝑏𝑙𝑒 𝑒𝑚𝑝𝑡𝑦 ) ×100 (1)
Figure 2 - RADWAG moisture analyser.
17
3.2.3. Determination of total polysaccharides
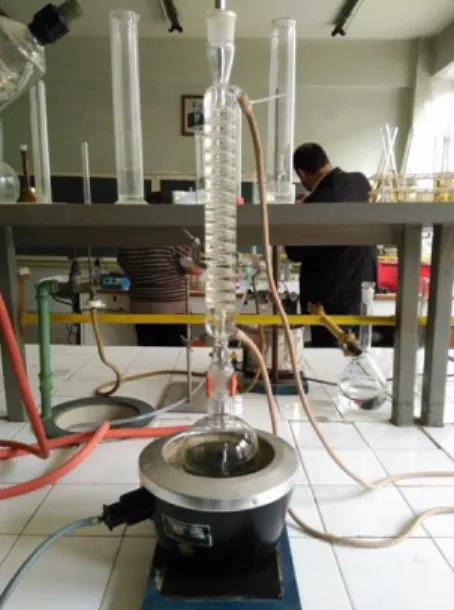
To determine the polysaccharides that can be easily hydrolised, two samples of 2.5 g A. nodosum and two 5 g samples of U. rigida were weighted and added to H2SO4 (2,5%) solution. For A. nodosum the volume of H2SO4 used was 100 mL and for U. rigida was 200 mL. All the mixtures were boiled for 5 hours on a heating mantle with an ascending cooler shown in Figure 4 (Rozmarin et al. 1984).
After the hydrolysis finished, the solution was filtered using filter crucibles (size G4), and the residue was washed with hot water until neutral reaction of the rinse waters, using pH paper stripes. After cooling, the rinse waters and the filtrate were collected together in a 500 mL Erlenmeyer flask, and distilled water was added to make up the volume. The residue was dried in the oven at 50º C for a minimum of 24 hours and weighted for the determination of hydrolization losses.
In order to determine the concentration of glucose in each solution (Ghose 1987), firstly 200 mL of Dinitrosalicylic Acid (DNS) was prepared with the following compounds:
150 mL distilled water; 1,9876 g of NaOH;
1,0069 g of 3,5 DNS (solid);
30,2009 g of Rochelle salts (Na-K tartarate);
18
0,8439 g of Phenol;
0,8266 g of Na metabisulfite.
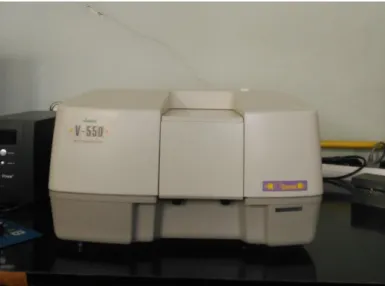
2 mL of the hydrolysed sample was placed in a test tube together with 3 ml of DNS reagent and with 1 mL of NaOH. The latter was added with the purpose to neutralize the sample. Subsequently, the test tubes were boiled for 5 minutes using a water bath and then cooled to ambient temperature. The concentrated samples were diluted 5 times to obtain the results in the working range. The analysis of the samples was done by a Jasco V-550 UV/VIS Spetrophotomer (Figure 5), with the parameters presented in Table 3 (Ghose 1987).
Table 3 - Standard parameters for the analysis of the glucose concentration.
Parameter Value
Photometric mode Abs
Working range 0.4 – 4 g L-1
Wavelength 540 nm
Band Width 0.5 mm
Scanning speed 400 m min-1
Start 900 mm
End 190 mm
Nºcycles 1
Data pitch 0 – 1 mm
19
The amount of easily hydrolysable polysaccharides was calculated by using the following equation (Rozmarin et al. 1984):
𝑃𝑜𝑙𝑦𝑠𝑎𝑐𝑐ℎ𝑎𝑟𝑖𝑑𝑒𝑠 (%) =
𝐶.𝑉.𝐾𝑔 (2) where:
g – mass of dried biomass (g);
C – the concentration of the reducing substances, obtained from calibration curve present in attachments (g L-1);
V – total volume of the hydrolisate in ml (500 ml);
K – coefficient for monosaccharides transformation in polysaccharides equal to 0.89 (Rozmarin et al. 1984).
3.2.3. Determination of polyphenolic content
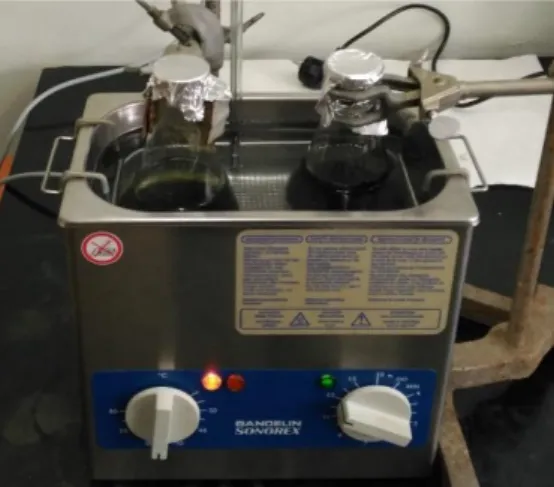
In order to determine the polyphenolic content of the algae, 25 g of each algae were weighted (A.nodosum and U.rigida) and placed in an Erlenmeyer flask. Then 250 mL of 70% ethanol was added to the flask. The mixture was placed in an Bandelin Sonomex ultra-sound bath (as shown in Figure 6) for 45 min at 60 °C. The liquid present in the bath was distilled water. After the process, the samples were filtrated (Lazar et al. 2016). The biomass left was dried in the oven at 50º C for a minimum of 24 hours and kept for the adsorption tests and will be further designed as Ascophyllum nodosum
waste (ANw) and Ulva Rigida waste (URw).
20
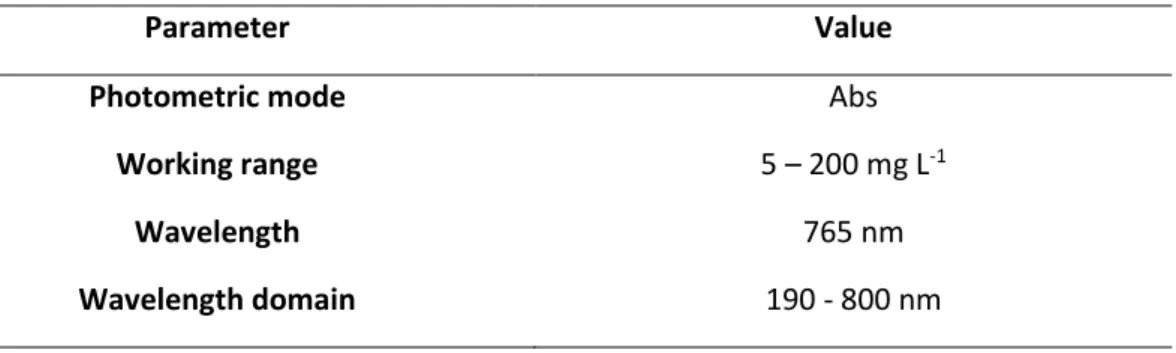
Total polyphenolic content (TPC) was determined using the Folin–Ciocalteu method, based on the colorimetric reaction of the sample with the Folin–Ciocalteu reagent. For all analyses 1 mL of extract was mixed with 0.5 mL Folin–Ciocalteu reagent, 2 mL Na2CO3 (100 g L-1) and 5 mL of distilled water, and kept in dark at room temperature for 90 min. The analysis of the samples was done by an UV-VIS spectrophotometer (GBS Avanta), with the parameters presented in Table 4. TPC, expressed as mg gallic acid equivalents per grams of algae (mg GAE g-1), was calculated by the following equation (Lazar et al. 2016):
𝑇𝑃𝐶 (𝑚𝑔 𝐺𝐴𝐸 𝑔−1) = 𝐶 ×𝑉
𝑀 (3) where:
C – Concentration of the reducing substances, obtained from the calibration curve present in attachments (mg L-1);
V – Volume of solution brought to a pre-defined value after the extraction (L); M – Quantity of initial biomass used in the TPC analysis (g).
Table 4 - Standard parameters for the analysis of the gallic acid concentration.
Parameter Value
Photometric mode Abs
Working range 5 – 200 mg L-1
Wavelength 765 nm
Wavelength domain 190 - 800 nm
3.2.4. FTIR spectra
In order to identify the predominant functional groups, present on the algae surface, FTIR analyses were performed in 4 samples: ANv and ANw before and after copper biosorption. These analyses were conducted using a Digilab SCIMITAR Series IR Spectrophotemeter, shown in Figure 7.
21
Figure 7 - Digilab SCIMITAR Series equipment.
3.3. Biosorption studies
3.3.1. Preliminary biosorption tests
In order to decide which is the better algae residue to remove copper from contaminated waters, biosorption tests were conducted with ANw and URw for Cu(II). These biosorption tests were performed in 100 mL Erlenmeyer flasks containing 25 mL of 25 mg L-1 metal Cu solution, at pH 2 and 5, and 25 mg of ANw and URw accurately weighed. The samples were stirred in an GFL shaking incubator 3031 (Fig. 8) at 120 rpm, under room temperature (22ºC ± 1). pH was monitored regularly and if necessary readjusted using HNO3 and NaOH aqueous solutions, in order to maintain a constant value (±0.5).
22
Figure 8 - GFL shaking incubator 3031 equipment.
After a 4h contact time, the samples were centrifuged in an Hettich Rotofix 32 A at 4000 rpm for 15 min. The concentrations of Cu (II) in liquid phase were analysed by AAS. The amount of Cu(II) adsorbed (mg g-1) was calculated by a mass balance equation:
𝑞 =𝐶0− 𝐶 𝐶𝑠
(4)
where C0 is the initial Cu concentration in the liquid phase (mg L-1), C is the concentration after adsorption (mg L-1) and Cs is the sorbent dosage (g L-1).
3.3.2. pH effect tests
Based on the results of preliminary biosorption tests, the algae ANw was selected for further kinetics and equilibrium studies.
In order to found the optimum pH for the biosorption process, tests were performed using Ascophyllum nodosum virgin (ANv) and Ascophyllum nodosum waste (ANw) for Cu(II) uptake. These biosorption tests were performed in 100 mL Erlenmeyer flasks containing 25 mL of 25 mg Cu L-1 solution, at pH 3, 4 and 5, and 25 mg of ANv and
ANw accurately weighed. The samples were stirred at 120 rpm, under room
temperature (22ºC ± 1). pH was monitored regularly and if necessary readjusted using HNO3 and NaOH aqueous solutions, in order to maintain a constant value (±0.5).
23
After a 4h contact time, the samples were centrifuged (Hettich Rotofix 32 A) at 4000 rpm for 15 min. Concentrations of Cu(II) in liquid phase were analysed by AAS and adsorbed amounts calculated by Equation (4).
3.3.3. Biosorption kinetics studies
In order to discover the behaviour of the biosorption process along time and the time needed to reach the biosorption equilibrium, a kinetic study was made. This procedure was performed in 100 mL Erlenmeyer flasks containing 25 mL of 25 mg Cu(II) L-1 solution at pH 5, and 25 mg of ANv and ANw accurately weighed. During the time of the assay, samples from each flask were collected at different time stamps (5 min; 10 min; 15 min; 30 min; 1 h; 3 h; 5 h). The samples were stirred at 120 rpm, under room temperature (22ºC ± 1). The pH was monitored regularly and if necessary readjusted using HNO3 and NaOH aqueous solutions, in order to maintain a constant value (±0.5). The amount of Cu(II) removed from the solutions by algal material was determined by calculating the difference between the initial metal concentration and the final metal concentration, measured by AAS and calculated with Equation (4).
3.3.4. Biosorption isotherms studies
Experiments were performed in 100 mL Erlenmeyer flasks containing 50 mL of a 100 mg Cu L-1 solution at pH 5. This procedure was made in duplicate for both ANv and ANw, with crescent concentrations of alga: 0,5 g L-1; 1 g L-1; 2 g L-1; 3 g L-1. The samples were stirred at 120 rpm, under room temperature (22ºC ± 1). The pH was monitored regularly and if necessary readjusted using HNO3 and NaOH aqueous solutions, in order to maintain a constant value (±0.5). The quantity of Cu (II) adsorbed from the solutions by algal material was determined by calculating the difference between the metal concentration in solution before and after the biosorption process, measured by AAS and calculated with Equation (4).
24
3.3.5. Analytical procedure
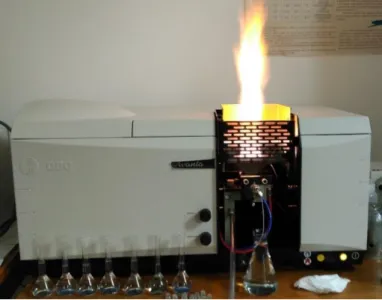
The analytical method used to determine the concentration of copper in aqueous solutions was Atomic Adsorption Spectrometry (AAS; spectrophotometer GBC Avanta) presented in Figure 9. Analyses were done using the technical parameters present in Table 5.
Figure 9 - Flame atomic adsorption spectrometry, mod. GBC Avanta.
Table 5 - Technical parameters of spectrophotometer GBC Avanta.
Metal Flame type Lamp current
(mA) Working range (mg L-1) Wavelength (nm) Slit Width (nm) Cu Air-Acetylene 3.0 0.12 – 30.0 217.9 0.20
25
4. Results and discussion
4.1. Chemical characterization
4.1.1. Moisture
The determination of moisture, after the seaweeds were dried in the oven at 50º C for 24 hours, allows to quantify the content of water present in the two macroalgae studied. The algae U. rigida presents a higher moisture content (7.6 ± 0.4 %) than
A.nodosum (4.9 ± 0.7 %). Both values are lower than 10 %, which represents a good
amount of moisture for the determination of polysaccharides, once the excess moisture could interfere with appropriate acid (H2SO4) concentrations (Wychen and Laurens 2013).
4.1.2. Total ash
Inorganic materials are present in algal biomass samples. In addition to contributing significantly to total mass closure, inorganic material may interfere with acid hydrolysis in the determination of total polysaccharides (Wychen and Laurens 2013). The determination of total ash (inorganic residue obtained after calcination) was calculated by Eq.1 described in section 3.2.2. of this study. The algae A. nodosum presents a higher percentage of non-volatile matter (13.8 ± 0.1 %) than U.rigida (10.9 ± 0.2 %), which is confirmed by Ross et al. (2008), that reported that brown seaweeds have in general, a higher ash content than other types of seaweeds. Yuan & Macquarrie (2015) and Blanco-Pascual et al. (2014) reported values of 18.6 % and 15.4 %, respectively, for the ashes in A. nodosum, which are higher than the obtained in this study. Regarding U. rigida, the ash content (10.9%) was lower than that reported of some seaweed species of the same genus, i.e. U. lactuca (19.6%) and U. armoricana (15.9%) (Yaich et al. 2011 and Hardouin et al. 2016).
26
4.1.3. Total polysaccharides
Polysaccharides are present in the cell wall of the three broad groups of macroalgae (Brown, Green and Red). The biosorption capacities of this seaweed are attributed mainly to their cell wall and, therefore, to the presence of polysaccharides (He and Chen 2014). The determination of polysaccharides was calculated by Eq. 2 present in section 3.2.3. The brown algae A. nodosum presented a lower percentage of polysaccharides (44.7 ± 1.2 %) than the green algae U.rigida (48.7 ± 0.1 %). These values are in agreement with ones found in the literature. Morrissey et al. (2001) reported for
A. nodosum a range of total polysaccharides from 42 to 64 % and for U.rigida a range
from 42 to 46 %, which is just a slightly lower for the green algae.
Another aspect that is important to mention in this sub-chapter is the percentage of sample that was hydrolysed. For A. nodosum, 62.2 ± 2.6 % of sample mass was hydrolysed, while for U. rigida it was 75.3 ± 1.1 %. These values were calculated based on the following equation:
% ℎ𝑦𝑑𝑟𝑜𝑙𝑖𝑠𝑎𝑡𝑖𝑜𝑛 𝑙𝑜𝑠𝑠𝑒𝑠 =𝑆𝑎𝑚𝑝𝑙𝑒 𝑑𝑟𝑦 𝑚𝑎𝑠𝑠−𝑅𝑒𝑠𝑖𝑑𝑢𝑒 𝑚𝑎𝑠𝑠 𝑎𝑓𝑡𝑒𝑟 ℎ𝑦𝑑𝑟𝑜𝑙𝑦𝑠𝑖𝑠
𝑆𝑎𝑚𝑝𝑙𝑒 𝑑𝑟𝑦 𝑚𝑎𝑠𝑠 ×100 (5)
4.1.4. Total Polyphenolic content
The polyphenolic compounds have been suggested to possess several bioactivities including antioxidant, anti-inflammatory, anti-diabetic, anti-proliferative or antibacterial effects (Macías-Sánchez et al. 2009).
The determination of the total polyphenolic content (TPC) was calculated by Eq.3 present in section 3.2.4. The brown algae presented a higher value of TPC (0.95 mg GAE g-1) than the green algae (0.33 mg GAE g-1). These values are lower than the ones found in literature. Macías-Sánchez et al. (2009) reported that brown algae Sargassum
muticum present a total polyphenolic content of 47.6 mg GAE g-1, when using ethanol and water as extracting solvent. Fabrowska et al. (2016) obtained a value of 2.7 mg GAE g-1 in green algae Ulva flexuosa, which is much higher than the value achieved for U.
27
4.1.5. FTIR analysis
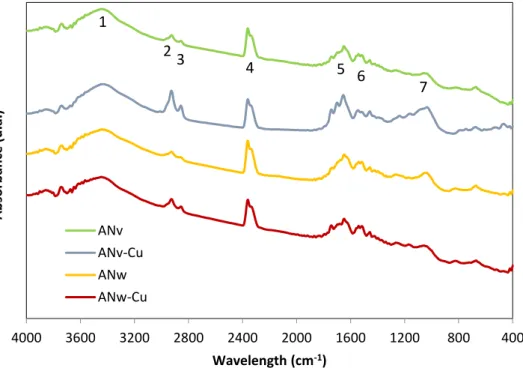
FTIR spectra of ANv and ANw before and after copper biosorption is shown in Figure 10.
Figure 10 - FTIR spectra of ANv and ANw before and after copper biosorption.
A H-bonded stretch identified in the range of 3200-3600 cm-1 (1) with a strong, broad intensity of band indicates, for all spectrums, the presence of the O-H functional group of glucose and the N-H groups of proteins, constituents of the cell wall (Ungureanu et al., 2015). Based on the relative intensity of the band, ANv seems to have a higher amount of these groups than ANw, which indicates that the extraction of polyphenols reduced the hydroxyl stretches.
The two peaks (2 and 3) observed between 2850-3200 cm-1 are assigned to C-H stretching of alkyl groups, asymmetrical and symmetrical, respectively (Silverstein et al.,1981; Freitas, 2007). For the band of 2900 cm-1 (2), it is possible to notice for both samples, that higher bands are obtained after contact with copper, suggesting that C-H stretch was involved in the copper biosorption. The same result was also observed by Sheng et al. (2004) for the Padina sp. and Sargassum sp. seaweeds.
According to Onyancha et al. (2008), the band observed in the range 2400 cm-1 is due to alkyl groups (-CC triple bond). These authors showed the presence of this
1 400 800 1200 1600 2000 2400 2800 3200 3600 4000 Wavelength (cm-1) A b sor b an ce (u .a. ) ANv ANv-Cu ANw ANw-Cu 23 4 5 6 7 1
28
groups in the green seaweeds Spirogyra condensata and Rhizoclonium hieroglyphicum. Regarding the intensity of each sample, no significant differences were observed between samples, indicating that these functional groups weren’t affected by the extraction of polyphenols and weren’t involved in copper biosorption.
Around the range 1700-1600 cm-1, it is visible the existence of two bands, a small one detected at about 1733 cm-1 (5) and other at 1626 cm-1 (6), which corresponds to the distension of C=O chelate and C=O stretching of the carboxyl groups (Silverstein et al., 1981; Freitas 2007). Comparing the intensity of the band at 1626 cm-1 (6), the ANv band after biosorption has a higher intensity, which also was confirmed by Freitas (2007) and indicates the involvement of the carboxyl group in copper biosorption.
The C-O bond in the alcohol functional group is indicated for all spectrums by a stretching bond in the 1000-1100 cm-1 (7) range with a strong intensity. Freitas et al. (2009) reported that this band is due to the presence of carbohydrates in seaweeds. The intensity of this band increased in ANv after biosorption, indicating that this functional group is involved in copper biosorption.
Table 6 summarizes the identified functional groups.
Table 6 - Dominants stretching frequencies in seaweeds FTIR spectra.
Band Frequency (cm-1) Symbol of
functional groups Name of functional groups 1 3200-3600 O-H Hydroxyl 2 2900 C-H Methyl 3 2850 C-H Methyl 4 2360 C-C Alkyl 5 1733 C=O Carboxyl 6 1626 C=O Carboxyl 7 1000-1100 C-O Alcohol
29
4.3. Preliminary biosorption tests
Preliminary biosorption tests were carried out in order to compare the performance of algae for Cu(II) biosorption after the extraction of polyphenols.
Figure 11 represents the adsorbed quantity of Cu(II) from algae samples ANw and URw at pH 2 and 5.
These preliminary tests show better results for Cu(II) biosorption at pH 5. Between the two macroalgae, the difference is insignificant and ANw was selected to further kinetics and equilibrium studies, due to the high quantity available, higher than URw.
4.3.2. pH effect tests
This section presents the results of Cu(II) biosorption for pH optimization. Figure 12 shows the results of preliminary pH tests performed with A. nodosum virgin and A.
nodosum waste for pH 3, 4 and 5. Higher pH values have not been tested due to Cu(II)
precipitation as metal hydroxide. 0.0 0.5 1.0 1.5 2.0 2.5
ANw pH 2 URw pH 2 ANw pH 5 URw pH 5
q ( m g/ g) Copper
Figure 11 - Adsorbed quantity of Cu (II) by ANw and URw using 25 mg L-1 metal solution, 10 g L-1
30
Figure 12 - Adsorbed quantity of Cu (II) by ANv and ANw using 25 mg L-1 Cu solution, 10 g L-1 algae
dosage and pH 3,4,5.
Adsorbed Cu(II) amounts by ANv (Fig. 12) are within the range 2.13-2.25 mg g-1.
ANw presents an adsorption capacity between 2.15-2.26 mg g-1.
From figure 12, it is possible to conclude that there are no significant differences in adsorbed Cu(II) amounts by ANw for pH values 4 and 5. Thus, pH 5 was chosen for further kinetics and equilibrium studies, because it gives more stable pH values, showing insignificant fluctuations in the pH during the experiment, and also because the initial copper solution was at pH 5 and it was not necessary to correct the pH. Regarding pH 3 and 4, it was observed that in the first 30 minutes of contact with seaweed the solution pH became more basic, requiring the addition of HNO3 to return to the initial values and diluting the solution.
Freitas et al. (2009) showed that the best results for the biosorption of Cu (II) by
A. nodosum were achieved at higher levels of pH (5.0) with a maximum uptake capacity
of approximately 70 mg g-1, for an initial Cu(II) concentration of 150 mg L-1 and seaweed dosage of 1 g L-1. The authors also concluded that the biosorption capacity decreases with pH.
Romera et al. (2007)reported that pH 4 was the optimum for the biosorption of Cu(II) by A. nodosum. At this pH value, the authors obtained an uptake capacity of 58.8 mg g-1 with an initial Cu(II) concentration of 50 mg L-1 and biomass concentration of 0.5 g L-1. 0 0.5 1 1.5 2 2.5 3 4 5 q (mg /g) pH ANwaste ANvirgin
31
In the study conducted by Freitas (2007) it was concluded that the maximum capacity of copper biosorption by A.nodosum was 69.3 mg g-1 at pH 5, at 25ºC, 150 mg L-1 initial Cu(II) concentration and a seaweed dosage of 1 g L-1.
In the present work lower adsorption capacities were obtained due to the low values of initial Cu(II) concentrations and the high biomass dosages. Freitas (2007) concluded that the biosorption is highly dependent of the initial metal concentration in solution and increases with the raise of initial metal concentration. The same author determined that the use of high quantities of biomass will affect negatively the biosorption. Due to the low values of adsorbate concentrations in solution and the high number of available active sites, adsorption occurs only on the higher affinity sites of the adsorbent reducing the amount of metal adsorbed by gram of biomass.
4.4. Biosorption kinetics studies
The kinetics adsorption study allows the determination of the rate at which copper (II) ions are adsorbed onto the surface of the algae samples. This is one of the main aspects to be considered in the evaluation of the adsorption efficiency because low adsorption rates limit practical applications of the process.
In this study, pseudo 1st and pseudo 2nd order models were used to describe adsorption kinetics. The pseudo 1st order, or Lagergen model (1898), is represented by the following equation:
𝑞 = 𝑞𝑒 (1 − 𝑒−𝑘1,𝑎𝑑𝑡) (6)
where q (mg g-1) is the biosorption capacity for a determined contact time t (min), qe (mg g-1) is the biosorption capacity in equilibrium and k1,ad (min-1) is the kinetic
constant.
The pseudo 2nd order model (Ho & McKay 1999), is given by:
𝑞 =
𝑘2,𝑎𝑑 𝑞𝑒2 𝑡1+ 𝑘2,𝑎𝑑 𝑞𝑒 𝑡
(7)
where k2,ad (g mg-1 min-1) is the second order kinetic constant.Pseudo 1st and pseudo 2nd order models were fitted to experimental kinetic data by non-linear regression using CurveExpert software. In Table 7, are presented the obtained parameters for the models. It was found that the models of pseudo 1st order
32
and pseudo 2nd order represent adequately the experimental results, with coefficients of determination values (R2) exceeding 0.95. Pseudo 1st order model presented the best determination coefficients (0.99), it predicted also qe values closer to the experimental ones.
Table 7 - Parameters for kinetics models (value ± interval for 95% confidence).
Pseudo first order Pseudo second order
Algae qe (mg g-1) k (min-1) SE qe (mg g-1) k (g mg-1 min-1) SE
ANvirgin 2.4 ± 0.2 0.08 ± 0.02 0.11 2.6 ± 0.4 0.04 ± 0.04 0.22 ANwaste 2.32 ± 0.08 0.10 ± 0.02 0.05 2.5 ± 0.3 0.06 ± 0.04 0.15
The parameters obtained in this kinetic study can be compared with some other reported in the literature, presented in Table 8 and 9.
Table 8 - Pseudo first order model parameters others found in literature.
Metal ion Biosorbent Dosage (g L-1) Initial metal concentration (mg L-1) pH qe (mg g-1) k (min-1) Reference Cu(II) A.nodosum 4 200 4.0 34.0 0.04 Freitas (2007) S.muticum 4 200 4.0 29.7 0.1 Ulva fasciata 3.3 100 5.0 5.13 0.37 Kumar et al. (2006)
Gelidium 2 102 5.3 17.3 0.31 Vilar et al. (2008) Ni(II) A.nodosum 4 200 4.0 25.8 0.07 Freitas (2007) Cr(II) 4 200 4.0 26.1 0.09 Pb(II) 4 200 4.0 49.4 0.09
33
Table 9 - Pseudo second order model parameters found in literature.
Metal ion Biosorbent Dosage (g L-1) Initial metal concentration (mg L-1) pH qe (mg g-1) k (g mg-1 min-1) Reference Cu(II) A.nodosum 4 200 4.0 34.2 0.001 Freitas (2007) Sargassum sp. 1 10 5.5 9.93 0.01 Karthikeya n et al. (2007) Ulva fasciata 1 10 5.5 9.81 0.01 Cd(II) A.nodosum 2.5 250 4.8 -5.6 71.9 0.005 Lodeiro et al. (2005) 4 200 4.0 35.9 0.002 Freitas (2007) Zn (II) A.nodosum 4 200 4.0 24.6 0.003
From tables 8 and 9, it is possible to conclude that the values of k, for both models studied, are similar to those obtained in this study. The major difference is related to the biosorption capacity and to the biomass dosage, whose explanation has already been given in the previous sub-chapter.
After the application of these models, figures 13 and 14 present the experimental results obtained from this kinetic study of Cu(II) biosorption by ANv and