Vol.52, n. 4: pp.841-847, July-August 2009
ISSN 1516-8913 Printed in Brazil BRAZILIAN ARCHIVES OF
BIOLOGY AND TECHNOLOGY
A N I N T E R N A T I O N A L J O U R N A L
Evaluation of Protein Quality from Genetically Modified
and Organic Soybean in two Consecutives Generations of
Wistar Rats
Julio Beltrame Daleprane
1,2*, Juliana Tomaz Pacheco
1and Gilson Teles Boaventura
21
Universidade Federal Fluminense; Rio de Janeiro – RJ – Brasil. 2Laboratório de Nutrição Experimental; Departamento de Nutrição e Dietética; Universidade Federal Fluminense; Rua Mário Santos Braga, 30, 5º andar; 24020-140; Niterói - RJ - Brasil
ABSTRACT
The aim of this study was to evaluate the cumulative effects of using genetically modified and organic soybean in two generations of rats. Two consecutive generations of 64 Wistar rats denominated F0 and F1 were used. The animals from each generation were divided into three groups (n=8) and fed chow made of organic soybean, genetically modified soybean and casein. The PER, NPR and CAE were determined. ANOVA was applied to the results. In both the generations, a statistically significant (p<0.05) difference was found between the experimental groups and the control group. The organic soybean supplement with L-cystine provided a better use of this protein in comparison to the genetically modified soybean protein, which demonstrated that the soybean maintained its protein use, although always inferior to casein. Thus, soybean should be used with caution during the growth stages because even with supplements, it remained inferior in relation to the casein group.
Key words: soybeans, Wistar rats, protein quality, generations
* Author for correspondence: [email protected]
INTRODUCTION
Soybean has received a great deal of attention from the scientific community, especially due to its profile of nutrients. It has complex carbohydrates, protein, soluble and insoluble fibers, oligosaccharides and phytochemicals. Some authors describe the soybean as a rich source of proteins since its composition is comprised on average of 30 to 45% proteins, 20 to 25% carbohydrates and 15 to 25% lipids. It also contains minerals such as Iron (Fe), Zinc (Zn), Magnesium (Mg), Potassium (K), Calcium (Ca), Manganese (Mn), and Selenium (Se) and vitamins such as retinol, thiamine, riboflavin, pyridoxine and folic acid (Anderson et al., 1999).
and growth (Miura et al., 2001; Monteiro et al., 2004). This can lead to hypertrophy of the pancreas due to the increased need for gastric, trypsin and chemotrypsin enzyme production to digest the proteins (Vasconcelos et al., 2001). At present, the thermal treatment has been used as a means to alleviate the antinutritional factors and improve the nutritional use of soybeans (Sgarbieri et al., 1982). It also helped improving the development of genetically modified varieties lacking these inhibitors (Vasconcelos et al., 2001; Carpentieri-Pípolo et al., 2000).
The improvement in digestibility with the treatment is attributed not only to the reduction in antinutritional factor activity but also to the structural alterations in soybean protein, since these have a more stable configuration, with a larger number of peptide linkages, increasing the susceptibility to enzyme hydrolysis (Deshpande & Damodaram, 1980; Carbonaro et al., 1992; Yokomizo & Vello, 2003).
Due to the great demand for soybean by the national food industry and export, Brazil has become the second largest soybean producer in the world (Santos et al., 2006). Thus, genetic improvement programs have emerged through biotechnology for the creation of genetically modified cultivars, which provide higher yield levels and reduced losses, increasing the productivity. RoundUp Ready (RR), for instance, was developed to be resistant to the herbicide
called Roudup®. Once the
5-enolpyruvylshikimate-3-phosphate synthase (CP4 EPSPS) protein, which acts in the shikimate pathway, is inserted, aromatic amino acids, which are essential to plant growth, are produced (Bollman et al., 2004).
An opposite view of genetically modified foods is the organic agriculture. It uses natural resources in order to keep the integrity and to maintain the productivity. In Brazil, the opening of the market for the organic products is recent. This movement began with support from the media and acceptance by the population. Today, there is a large niche for these products since there is great rejection by the population in relation to acquiring and consuming certain conventional products due to the use of agrotoxins, as well as to consuming the products derived from some type of new biotechnology (Borguini et al., 2003).
The objective of this study was to evaluate the cumulative effect of genetically modified and organic soybean (Glycine Max L Merril)
consumption in the growth and development of the two generations of Wistar rats.
MATERIAL AND METHODS
Animal and diets
This study was approved by the Ethics Committee of the Antônio Pedro University Hospital, Federal Fluminense University (protocol # 57/02) and followed the norms of the Brazilian College of Animal Experimentation.
In this study sixty-four recently weaned, male, Wistar, Rattus norvergicus from the Experimental Nutrition Laboratory (LabNE) Department of Nutrition and Dietetic, School of Nutrition at the Federal Fluminense University-Niterói, RJ, were used. The test was divided into two phases and the first one was denominated generation F0. In this
phase, specific groups were formed and fed with organic soybean, genetically modified soybean and casein. When they reached fertility (90 days), these animals mated, giving place to the second phase called generation F1, in which the same
groups were formed as in generation F0.
Experimental groups
The experimental groups received the following denominations: Organic Soybean Group, which received organic soybean based chow (GOF0 and
GOF1); Genetically Modified Soybean Group,
which received genetically modified soybean based chow (GGF0 and GGF1); Casein Group,
which received casein based chow (GCF0 and
GCF1).
These groups received their specific chow throughout their lives in both the generations (F0
and F1). The aproteic group (protein free) was also
formed in each generation (GAF0 and GAF1),
using the protein-free and isocaloric chow. All the animals received water and ad libitum chow and were kept confined in individual polypropylene cages in an environment with a constant temperature (24ºC ± 2ºC) and adequate illumination (light and dark cycles of 12 in 12 h).
Biological determination of protein
weight gain of the test group in relation to test group protein consumption. The Coefficient of Alimentary Effectiveness (CAE) was determined by taking the weight gain of the test group, after 28 days, in relation to the test group chow consumption, according to Angelis (1995).
To prepare the different kinds of chow, both the varieties of soybeans underwent thermal treatment,
according to Soares et al. (2005), aiming to reduce the antinutritional factors. Chow composition (Table 1) was based on American Institute of Nutrition (AIN) recommendations (Reeves et al., 1993), according to which, all diets had on average 10% protein (1.75% nitrogen) and 363.95 Kcal/100g.
Table 1 - Composition of the diets used for the assay (g/100g). Food (g/100g) Casein
1
(GCF0 and GCF1)
Organic soy2
(GOF0 and GOF1)
Transgenic soy3 (GGF0 and GGF1)
Aproteic (GA)
Protein 11.54 20.96 20.28 0.00
Starch4 61.41 57.23 58.04 72.95
Refined sugar5 10.00 10.00 10.00 10.00
Mineral mix6 3.50 3.50 3.50 3.5
Vitamin mix7 1.00 1.00 1.00 1.00
Soy oil8 7.00 2.81 2.94 7.00
Cellulose9 5.00 3.95 3.99 5.00
Choline bitartrate10 0.25 0.25 0.25 0.25
Cysteine10 0.30 0.30 0.00 0.00
Total 100.00 100.00 100.00 100
1
Caseína-Comercial Rhosther Industria e Cormécio LTDA. 2Jasmine Alimentos LTDA, 3Bunge Alimentos.,4Maisena, 5União,
6
Preparada segundo a AIN-93 (Rhosther), 7Preparada segundo a AIN-93 (Rhosther), 8Liza®, 9Macrocel®, Blanver LTDA,
10
Rhosther
Chemical Composition Methods
The protein, lipid, ash and carbohydrate contents were determined after preparing the chow. This was carried out according to the Association of Official Analytical Chemists (AOAC, 1984) methods.
Statistical Analysis
The One Way ANOVA (Analysis of Variance) was applied to the results for the multiple analyses of variables at the p≤0.05 level. When statistical significance was detected, the Scheffe two-average
test was applied, using the Bonferroni Coefficient, describing them in averages.
RESULTS AND DISCUSSION
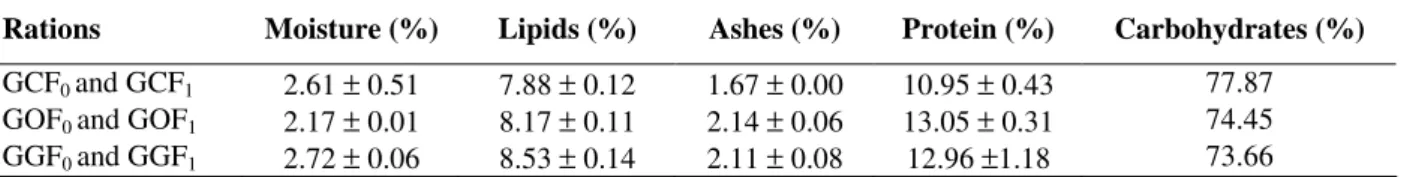
Table 2 shows the composition of the different kinds of chow prepared for the test in hundredths. It was observed that the protein content varied from 10.95% to 12.96%, carbohydrates from 73.66 to 77.87%, lipids from 7.88 to 8.53%, moisture from 2.17 to 2.72% and ashes from 1.67 to 2.14%. The values shown in this table characterized the kinds of chow with equal composition in the hundredths.
Table 02 - Chemical composition of diets (g/100g).
Rations Moisture (%) Lipids (%) Ashes (%) Protein (%) Carbohydrates (%)
GCF0 and GCF1 2.61 ± 0.51 7.88 ± 0.12 1.67 ± 0.00 10.95 ± 0.43 77.87
GOF0 and GOF1 2.17 ± 0.01 8.17 ± 0.11 2.14 ± 0.06 13.05 ± 0.31 74.45
GGF0 and GGF1 2.72 ± 0.06 8.53 ± 0.14 2.11 ± 0.08 12.96 ±1.18 73.66
Results are present as mean ± standard. GC – chow of control group; GO – chow of organic soy group; GG – kinds of chow of transgenic soy group.
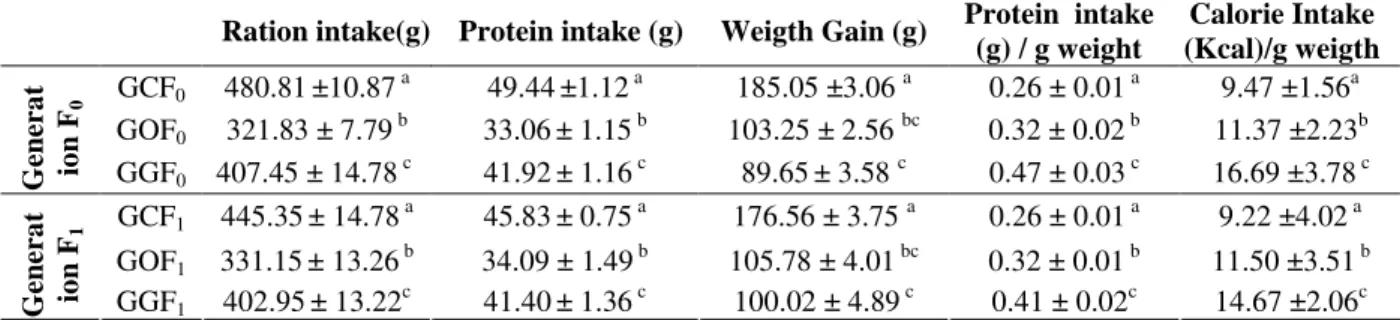
When evaluating chow intake (Table 3), a similarity was observed in the same groups in different generations, in which the GGF0 and GGF1
had a lower (p≤0.003) value in comparison to the GOF0 and GOF1 in both the generations, and this
and GCF1. Since these kinds of chow are
isocaloric and isoproteic, the protein intake is a reflection of the chow intake. Therefore, protein consumption was proportional to chow consumption in all the groups for both the generations.
Sarwar et al. (1989) and Sgarbieri (1996) suported that the lipooxygenase enzyme (LOX) present in the soybean quickly oxidized the polyunsaturated fatty acids generating fatty acid peroxides, which was broken into aldehydes and volatile cetones. This caused the formation of the beany flavor and the consequent alteration in chow palatability. It could thus, be suggested that the lower consumption of the soybean based groups in relation to the control group could be related to the alteration in flavor caused by the enzyme action. Knowing that there is a variation in total body protein caused by differences in diet protein quality, it is important to observe the variation in
body weight as an overall reflection of ingested protein action (Angelis, 1995). In this study from one generation to the next, the variation in weight was not enough to identify a significant difference within the same group in different generations (Table 3). The GGF0 and GGF1 had values which
were similar to the ones of the GOF0 and GOF1
and both were less than (p<0,0005) the GCF0 and
GCF1 ones.
When were compare protein intake and the variation in body weight, it was observed that the GGF0 and GGF1 consumed a higher amount of
protein compared to the GOF0 and GOF1 in both
the generations, although it had a smaller weight variation in both the generations (Table 3). Sarwar et al (1989), found that cystine supplementation in balanced diets for the animals promoted better growth due to the improved incorporation of ingested protein.
Table 3 - Ration and protein intake, weight gain, protein intake (g)/weight (g) ratio and calorie intake (Kcal)/ weight (g) ratio.
Ration intake(g) Protein intake (g) Weigth Gain (g) Protein intake
(g) / g weight
Calorie Intake (Kcal)/g weigth
GCF0 480.81±10.87 a 49.44±1.12 a 185.05 ±3.06 a 0.26 ± 0.01 a 9.47 ±1.56a
GOF0 321.83 ± 7.79 b
33.06± 1.15 b 103.25 ± 2.56 bc 0.32 ± 0.02 b 11.37 ±2.23b
G
en
er
a
t
io
n
F
0
GGF0 407.45 ± 14.78 c 41.92± 1.16 c 89.65± 3.58 c 0.47 ± 0.03 c 16.69 ±3.78 c
GCF1 445.35± 14.78 a
45.83± 0.75 a 176.56 ± 3.75 a 0.26 ± 0.01 a 9.22 ±4.02 a GOF1 331.15± 13.26 b 34.09 ± 1.49 b 105.78 ± 4.01 bc 0.32 ± 0.01 b 11.50 ±3.51 b
G
en
er
a
t
io
n
F1
GGF1 402.95± 13.22c 41.40± 1.36 c 100.02 ± 4.89 c 0.41 ± 0.02c 14.67 ±2.06c
Results are present as mean ± standard. Numbers followed by diferent superscript letter are statistically significant (p≤0,05, ANOVA followed by Scheffé and Boferroni tests).
According to Leung & Rogers (1975)and Miller & Payne (1964), both the lack and the overabundance of one or more amino acids implled a dynamic protein disequilibrium resulting in growth delays and organic alterations. Krajcovicova & Dibak (1980) suported that in situations where there was amino acid disequilibrium in the diets, the organism will have to metabolized the endogenous proteins to obtain the limiting amino acids, with accentuated wasting on the organism.
It is important to emphasize that GGF0 and GGF1
did not receive the L-cistine supplement, so there would be no interference in protein use for the chow based on this variety of soybean, since it is a genetically modified organism. When working with this same soybean, Soares et al. (2005) did not find differences in weight variation for the rats
which were up to 291 days old. In the present study, it was observed that when dealing with the growth and development period, supplements become essential.
The Kcal/g body weight ratio (Table 3) was higher (p<0.004) for GGF0 and GGF1 in comparison to
GOF0 and GOF1, respectively. The control group
maintained a lower ratio (p<0.01) than the experimental groups, regardless of the generation. Thus, the genetically modified soybean based group revealed a consumption of 45 and 40% in generations F0 and F1, respectively, compared to
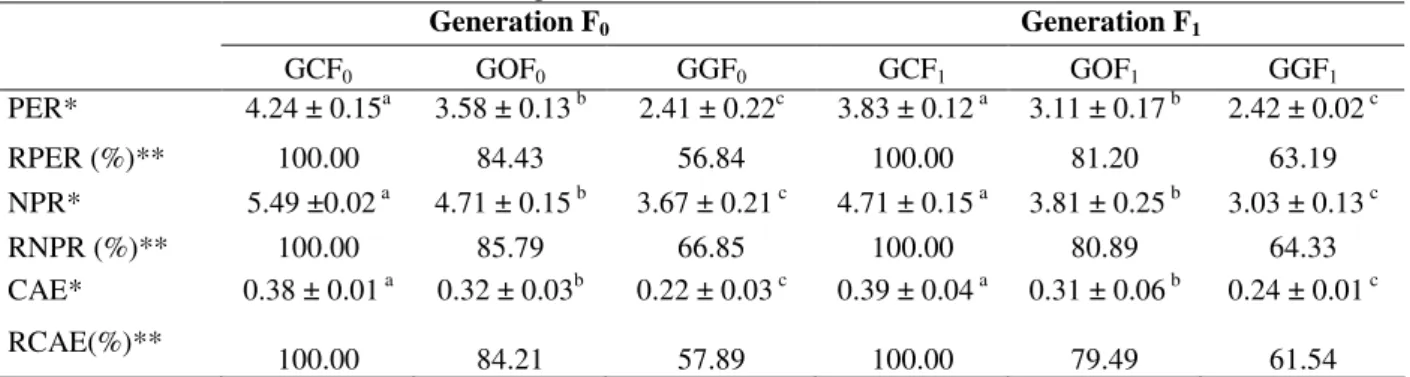
The values found for PER compared to casein (Table 4) varied in generation F0 from 84.43 to
56.84% for GOF0 and GGF0 respectively, and in
generation F1 from 81.20 for GOF1 and 63.19% for
GGF1. It showed the superiority (p<0.006) of
GOF0 and GOF1 compared to GGF0 and GGF1.
Bressani (1995) found PER values equal to 2.44 for the isolated soybean and a PER of 2.23 for soy flour, from which the grain was thermally treated. Monteiro et al. (2004) found an average PER of
1.3 when they studied the genetically modified soybean linkages without the Kuntz Trypsin inhibitor and the LOX enzyme.
Freidman (1996) reported that a PER value of over 2.00 was generally related to good quality protein and a PER value below 1.50 was usually related to poor quality protein. Although the PER values were higher than the above referenced values, the experimental groups still showed poorer results than the GC, in spite of the generation.
Table 4 - PER, NPR and CAE of F0 and F1 generations.
Generation F0 Generation F1
GCF0 GOF0 GGF0 GCF1 GOF1 GGF1
PER* 4.24 ± 0.15a 3.58 ± 0.13 b 2.41 ± 0.22c 3.83 ± 0.12 a 3.11 ± 0.17 b 2.42 ± 0.02 c
RPER (%)** 100.00 84.43 56.84 100.00 81.20 63.19
NPR* 5.49 ±0.02 a 4.71 ± 0.15 b 3.67 ± 0.21 c 4.71 ± 0.15 a 3.81 ± 0.25 b 3.03 ± 0.13 c
RNPR (%)** 100.00 85.79 66.85 100.00 80.89 64.33
CAE* 0.38 ± 0.01 a 0.32 ± 0.03b 0.22 ± 0.03 c 0.39 ± 0.04 a 0.31 ± 0.06 b 0.24 ± 0.01 c RCAE(%)**
100.00 84.21 57.89 100.00 79.49 61.54
*Results are present as mean ± standard. Numbers followed by diferent superscript letter re statistically significant (p≤0,05, ANOVA followed by Scheffé and Boferroni tests). **RPER = relative PER; **RNPR = relative NPR ; **RCAE = relative CAE; GC = Control goup; GO = Organic soy group; GG = transgenic soy group.
The NPR has the capacity of showing that the protein influenced the animal growth and maintenance (Angelis, 1995). The NPR values for the groups with soybean decreased from one generation to the next (Table 4). This reduction was more evident when the NPR was analysed compared to casein, where although the groups showed lower values in generation F0, these were
not sufficiently different for statistically significant differences. A lower yield for the GGF1 was
observed in comparison to the other groups. However, the GCF0 revealed a higher NPR than in
all other groups. Gomes et al. (2000) found an NPR value of 3.70 for soybean, whereas Sarwar et al (1985) found a value of 3.53.
These values were similar to those found in the present study from the soybean based groups in generation F1, from which the results were lower
when compared to generation F0.
The NPR values for soy flour based diets compared to casein were significantly different (p<0.0004), demonstrating that the quality of soy flour protein used as a protein source was not as effective as casein in order to promote the growth and maintenance of rats. It was observed that the thermal treatment used in soybeans was satisfactory since the values of biological
indicators described in the literature, in which the beans were thermally treated, matched the values found in the present experiment.
The CAE values were similar for the GOF0 and the
GOF1 in both the generations studied, presenting
CAE values compared to casein of 84.21% in generation F0 and 79.49% in generation F1. The
same was found for the GGF0 with values of
57.89% for this group in generation F0 and 61.54%
in generation F1, but with lower values (p<0.0002)
for this group compared to the GOF1 (Table 4).
Since it is an alternative source of protein, a soybean, like other legumes, has been broadly studied. Analyzing several types of the beans, Rosa et al. (1998) found similar CAE values between the legume and casein, a result which was not found in this experiment, since in both the phases of the test, the soybean was statistically inferior to casein.
Based on these results, it coud be concluded that the use of soybeans as a protein source for animals in growth stages must be done cautiously, because even when showing normal values, it would be important to draw attention to the legume’s limitation in sulfurated amino acids. It was confirmed that even with L-cystine supplements, organic soybean was unable to reach similar levels as the standard protein based group concerning the biological indicators.
ACKNOWLEDGEMENTS
This study was under the auspices of the State of Rio de Janeiro Research Assistance Foundation (FAPERJ), National Council for Scientific and Technological Development (CNPq). We thank the referees, as well as LabNE, for their helpful comments.
RESUMO
Este estudo objetivou avaliar os efeitos cumulativos da utilização das sojas geneticamente modificada e orgânica em duas gerações de ratos. Utilizaram-se 64 ratos Wistar, de duas gerações consecutivas denominadas F0 e F1. Os animais de
cada geração foram divididos em três grupos (n=8) alimentados com ração à base de soja orgânica, soja geneticamente modificada e caseína. Determinou-se o Quociente de Eficácia Protéica, Razão Protéica Líquida e Quociente de Eficácia Alimentar. Aos resultados aplicou-se ANOVA. Foi encontrada, em ambas as gerações uma diferença significativa (p<0,05) entre os grupos experimentais e o grupo controle. A suplementação dos grupos GOF0 e GOF1 com
L-cistina proporcionou um melhor aproveitamento protéico em relação ao GGF0 e GGF1. Mostrando
que a soja manteve seu aproveitamento, no entanto sempre inferior à caseína. Deve-se utilizar as sojas geneticamente modificada e orgânica com cautela na fase de crescimento, pois mesmo suplementada com L-cistina estas se mantiveram inferior ao grupo à base de caseína.
REFERENCES
A.O.A.C. (1984) "Official Methods of Analysis of the Association of Official Analytical Chemists, Fourth Edition.
Anderson, J. W.; Smith, B. M.; Washnock, C. S. ( 1999), Cardivascular and renal benefits of dry bean and soybean intake. American Journal of Clinical Nutrition, 70 (suppl): 464-74S.
Angelis, R C. (1995), Valor nutricional das proteínas, métodos de avaliação. SBAN- Cadernos de Nutrição,
10:08-29.16.
Barcelos, M. F. P., Tavares, D.Q.; Silva, M. A. A. P. (1999), Ensaio tecnológico e sensorial de soja [Glycine max (L.) Merrill] enlatada em estádios verdes e no estádio da maturação de colheita. Ciência e Tecnologia de Alimentos,9:46-58.
Bollman, M. S.; King, G.; Peter, K.; Watrud, V. W. S.; Fairbrother, A.; Burdick, C.; Reichman, J. R. (2004), Evidence for landscape-level, pollen-mediated gene flow from genetically modified creeping bentgrass with as a marker CP4 EPSPS. Proceedings of the National Academy of Sciences of the United States of America, (101) 40: 14533-38.
Borguini, R. G.; Oetterer, M.; Silva, M. V. (2003), Qualidade nutricional de hortaliças orgânicas. Boletins da Sociedade Brasileira de Ciência e Tecnologia de Alimentos, (1) 37: 28-345.
Bressani, R. (1975), Nutritional contribuition of soy protein to food systems. Jounal of the American Oil Chemists Socity, 52: 15-25.
Carbonaro, M.; Marletta, L.; Carnovale, E. (1992) Factos affeting cystine reactivity in proteolytic digests of Phaseolus vulgaris. Journal Agricultural Food Chemistry, (40) 2:169-173.
Carpentieri-Pipolo, V.; Pipolo, A. E.; Silva, F. A. M.; Peteke, M. R. (2000), Soybean parent selection based on genetic diversity. Braz. arch. biol. technol. (43)
3:295-300
Deshpande, S. S.; Damodaram, S. (1980), Structure: a digestibility relationship of legume 7S proteins. Jounal Food Science, (54) 1: 108-113.
Freidman, M. (1996), Nutritional value of proteins from different food sources. A Review. Journal Agriculture and Food Chemists, 44: 6-29.
Krajcovicova, M. & Dibak, O. (1980), Protein Utilization In Correlation To Protein Inteak. Physiologia Bohemoslovaca,29: 37-47.
Leung, P.; Rogers, Q. R. (1975), Disturbances in Amino Acid Balance. In-Total Parenteral Nutrition. H. Glandini (ed.) New York/London/Sydny/Toronto. J. Willy & Sons, pp 259-84.
McLaugaulan, J. M. & Keith, O. M. (1975), Biossays for protein quality. In-Protein nutritional quality of foods and feeds. New York: Marcel Dekker,5. pp 79-85.
Miller, D. S.; Payne, P. R. (1964), Dietery factores influenced nitrogen balance. Proc. Nutrition, (23)11. Miura, E. M. Y.; Binotti, M. R.; Camargo, D. S.;
Mizuburii, Y.; Ida, E. I. (2001), Avaliação Biológica da Soja com baixas atividades de inibidores de tripsina e ausência de kunitz. Archivos Latinoamericanos de Nutricion, 51 2:195-98. Monteiro, M. R. P.; Costa, N. M. B.; Oliveira, M. G.
A.; Pires, C. V.; Moreira, M. A. (2004), Protein quality of soy lines lacking Kunitz’s Trypsin inhibitor and Lipoxygenase isozymes. Brazilian Journal of Nutrition,(17) 2: 195-205.
Nepomuceno, D. C. P. P.; Lago, E. S.; Teodósio, N. R.; Bion, F. M. (2000), Dietary proteins on reproductive performance in three consecutive generations of rats. Achivos Latinoamericanos de Nutricion, (50)1: 55-61.
Reeves, P. G.; Nielsen, F. H.; Junior, G. C. F. (1993), AIN-93. Purified diets for laboratory rodents: Final report of. The American Institute of. Nutrition ad hoc writing committee on the reformulation of, the AIN-76A rodent diet. Journal of Nutrition, 123: 1939. Rosa, C. O. B.; Brunoro, N. M.; Nunes, R. M. (1998),
Efeito dos feijões “Phaseolus vulgaris, L.” preto, carioquinha e vermelho na redução do colesterol sanguíneo de ratos hipercolesterolêmicos. Archivos Latinoamericanos de Nutricion, (48) 4: 306-310. Sant’ana, L. F. R.; Costa, N. M. B.; Oliveira, M. G. A.;
Gomes, M. R. A. (2000), Valor nutritivo e fatores
antinutricionais de multimisturas utilizadas como fonte alternativa alimentar. Braz J Food Technol,
3:129-135.
Santos, M. A.; Nicolás, M. F.; Hungria, M. (2006), Soja. Pesq. agropec. bras., (41) 1:67-75.
Sarwar, G.; Peace, R. W.; Botting, H. G,; Brulé, D. (1989), Relationship between amino acid and protein quality indices based on rat growth. Plant Food for Human Nutrition, 39:33-44.
Sawar, G.; Peace, R. W.; Botting, H. G. (1985), Corrected relative net protein ratio (CRNPR) method based on differences in rat and human requirements for sulfur amino acids, Journal Associed. Off. Anal. Chem., 68: 689-693.
Sgarbieri, V. C. (1996), Proteínas, In-Proteínas em Alimentos Protéicos: propriedades, degradações, modificações. Livraria Varela, São Paulo, pp 45-49. Sgarbieri, V. C.; Whitaker, J. R. (1982), Physical,
chemical and nutritional properties of common bean (Phaseoius) proteins. Advance Food Research, (43) 4: 862-866.
Soares, L. L.; Lucas, A. M. M.; Boaventura, G. T. (2005), Can organic and transgenic soy be used as a substiute for animal protein by rats? Brazilian Journal of Medical Biological Research, 38:583-586. Vasconcelos, I. M.; Maia, A. A. B.; Siebra, E. A.;
Oliveira, J. T. A.; Carvalho, A. F. F. U.; Melo, V. M. M. (2001), Nutritional study of two Brazilian soybean (Glycine Max) cultivars differing in the contents of antinutritional and toxic proteins. Journal of Nutrition Biochemic,12:55-62.
Yokomizo, G. K. & Vello, N. A. (2003) Evaluation of the average performance of topcrosses among food and grain type soybean. Braz. arch. biol. technol. (46)
3:323-332.