Vol.57, n.5: pp. 742-754, September-October 2014 http://dx.doi.org/10.1590/S1516-8913201401407
ISSN 1516-8913 Printed in Brazil
BRAZILIAN ARCHIVES OF BIOLOGY AND TECHNOLOGY
A N I N T E R N A T I O N A L J O U R N A L
Effect of CLA Supplementation to Low-Protein Diets on the
Growth Performance, Carcass Characteristics, Plasma Urea
Nitrogen Concentration, and Fatty Acid Profile in the Meat
of Pigs
Manuel Martínez-Aispuro
1, José Luis Figueroa-Velasco
1*, Vicente Zamora-Zamora
1, José
Luis Cordero-Mora
1, Carlos Narciso-Gaytán
1, María Teresa Sánchez-Torres
1, Silvia
Carrillo-Domínguez
2and Rosa María Castillo-Domínguez
21Programa de Ganadería; Colegio de Postgraduados; México-Texcoco, Montecillo, Texcoco, Estado de México -
México. 2Departamento de Nutrición Animal; Instituto Nacional de Ciencias Médicas y Nutrición Salvador Zubirán; Tlalpan - México
ABSTRACT
To analyze the effect of conjugated linoleic acid (CLA) on the meat of pigs (0,1%) and three crude protein (CP) levels (nursery: 20.5, 16.0, 14.5%; growing: 16, 14.5, 11.5%; and finishing: 14.0, 12.5, 11% CP), studies were conducted with 36 hybrid (Yorkshire×Landrace×Duroc) barrows (17.3-83.5 kg), which were individually penned and allotted in a completely randomized design in a factorial (2×3) arrangement for 84 d. The analysis by phases indicated that CP level affected some variables. Average daily gain, average daily feed intake, fat free lean gain, backfat thickness, longissimus muscle area and final body weight were reduced (P≤0.05) feeding the lowest CP diet in nursery and growing pigs. Plasma urea nitrogen concentration was also lower (P≤0.05) in the growing and finishing phases when fed the lowest CP level. The global analysis showed that all the analyzed variables (except feed gain ratio, lean meat percentage and plasma urea nitrogen concentration) were reduced (P≤0.05) in the pigs fed low-protein diets; plasma urea nitrogen concentration tended to be lower (P=0.07) when CP was reduced. The fatty acid profile of the meat (semimembranosus and longissimus muscles) indicated that CLA addition increased CLA isomers and total saturated fatty acids, and reduced the total monounsaturated fatty acids (P≤0.05). α-Linolenic acid was lowered in longissimus muscle of pigs fed LPD (P=0.08). These results indicated that reducing the crude protein concentration in the diet of fattening pigs from 20.5 to 16.0% in nursery phase; from 16.0 to 14.5% in growing stage; and from 14.0 to 12.5% in finishing pigs, did not negatively affect the growth performance, nor carcass characteristics. The results also showed that the addition of CLA did not improve pig response and the concentration of unsaturated fatty acids and total lipids altered the feeding LPD.
Key words: Pigs, Low-protein diets, Conjugated linoleic acid, Fatty acid profile in meat
*Author for correspondence: [email protected]
INTRODUCTION
The reduction of crude protein (CP) in sorghum-soybean meal diets, up to 4.0%, properly supplemented with crystalline amino acids (AA), does not adversely affect weight gain or feed efficiency of pigs; in addition, it helps to reduce
Bellego et al. 2002), leading to an increased accumulation of fat in the carcass of pigs fed low-protein diets (LPD) (Knowles et al. 1998). This is a negative factor because the consumer demands leaner pork and better marbling for human consumption.
The addition of conjugated linoleic acid (CLA) to the diet can help to reduce the fatness in pig carcass. CLA is formed by a group of positional and geometric isomers of linoleic acid, an essential fatty acid of the omega-6 family (Jensen 2002). Studies in rodents have shown that CLA reduces fat deposition and increases the synthesis of lean tissue (Park et al. 1997; 1999). There may be several mechanisms involved in this, although the more accepted are that CLA increases the energy expenditure, regulates the adipocyte metabolism, regulates adipokines and cytokines, increases the β-oxidation in skeletal muscle (Park and Pariza 2007) and decreases the catabolic effect of immune function in muscle (Pariza et al. 2000). In pigs, it was observed that the incorporation of CLA in the diet improved the growth performance and carcass characteristics (Thiel-Cooper et al. 2001; Wiegand et al. 2001; Su et al. 2006), and modified the type and concentration of other fatty acids, which could improve the processing of meat (King et al. 2004). In addition, it increased the concentration of CLA in the meat (Wiegand et al. 2002; Lauridsen et al.
2005; Schmid et al. 2006), which might have benefits for human nutrition and health through preventive and therapeutic properties in the diseases such as cancer, chronic inflammation, atherosclerosis, obesity and antioxidant function (Roche et al. 2001).
The objective of this study was to evaluate the effect of CLA addition replacing soybean oil, to low-protein, sorghum-soybean meal diets fed to the fattening pigs on the growth performance, carcass characteristics, plasma urea nitrogen concentration, and fatty acid profile and concentration in the meat of longissimus and
semimembranosus muscles.
MATERIALS AND METHODS
Pigs and experimental design
Thirty six hybrid (Yorkshire×Landrace×Duroc) barrows with 17.3±2.0 kg of body weight were used. These were distributed in a completely randomized design with factorial (2×3)
arrangement at two levels of CLA and three levels of CP, with six replicates per treatment during 21, 28, and 35 days in nursery, growing, and finishing phases, respectively.
Diets and general management of pigs
The diets were based on sorghum-soybean meal and were formulated based on true digestible amino acids (NRC 1998) to meet or exceed the nutritional requirement for each stage of the growth of pigs (Table 1). The CP concentrations evaluated for each phase (nursery: 20.5, 16.0, and 14.5%; growing: 16.0, 14.5, and 11.5%; finishing: 14.0, 12.5, and 11.0%) were as follows: control level (standard diet; first concentration); the second level (low-protein) corresponded to the CP content in the diet where growth performance was similar to that obtained with the standard CP level, and the third level was the CP concentration with the lowest plasma urea nitrogen concentration in the nursery (Trujillo-Coutiño et al. 2007), growing (Martínez-Aispuro et al. 2009), and finishing (Figueroa et al. 2008) pigs. Dietary supplementation of the CLA was 0 or 1.0%, replacing soybean oil in the diet (Table 2). The barrows were individually housed in 1.2×1.5 m pens with concrete floor, equipped with a single feeder and a nipple drinker. Feed and water were provided ad libitum.
Data recording, sampling and laboratory analysis
The change of body weight to determine average daily gain (ADG), as well as feed disappearance to estimate the average daily feed intake (ADFI) and feed: gain ratio (FGR) were registered on the first and last day of each stage. Blood samples were collected on the first and last day of each stage using vacutainer heparinized tubes (BD Vacutainer Systems, NJ, USA). The blood was centrifuged at 1286 g during 15 min and the supernatant was transferred to polypropylene tubes and stored at -20°C (EUR251P7W Tappan, Electrolux Home Products North America, USA) until laboratory determination of plasma urea nitrogen concentration (PUN; Chaney and Marbach 1962). On the first and last day of each stage the backfat thickness (BT) and longissimus
lean gain (FFLG) and the lean meat percentage (LMP) using the NPPC (1991) equation. Crude protein (CP) was determined in feed samples (AOAC 1990).
Pigs were slaughtered in a commercial abattoir. Animals were stunned in a V-type restraining conveyor using a high-voltage electric apparatus. Pigs were bled in a lying position, and generally were stuck within 5 s after stunning. Afterward, they were eviscerated and scaled, preserving the carcass from the skin, head and limbs. Later, carcasses were transported to a cutting room. Meat samples from semimembranosus (SM) and
longissimus (LM) muscles were collected from the
warm carcasses of pigs. There was a fasting period 12 h before the slaughter. There was no opportunity of measuring the carcass characteristics at this place because it was no allowed. Meat samples were macerated with a food processor and frozen at -20°C (EUR251P7W Tappan, Electrolux Home Products North America, USA) until the determination of total concentration of fatty acids (saturated, unsaturated, polyunsaturated, and CLA isomers) in muscle tissues, dietary oil and CLA sources.
Table 1 - Composition of experimental diets for fattening pigs on an air-dry weight basis (g/kg).
Phase Nursery Growing Finishing
Crude protein 205 160 145 160 145 115 140 125 110
Ingredient/Treatment‡ T1‡ T3‡ T5‡ T1‡ T3‡ T5‡ T1‡ T3‡ T5‡ Sorghum grain 622.55 765.88 813.66 760.55 808.34 903.91 822.55 870.27 918.06 Soybean meal (44%) 333.46 183.35 133.29 197.08 147.02 46.90 140.72 90.75 40.69 Soybean oil 15.91 11.41 9.91 14.57 13.07 10.07 13.16 11.63 10.13 Bio-Lys (L-Lisina⋅H2SO4) * 0.93 3.04 3.75 3.69 4.40 5.81 3.14 4.03 4.73 DL-Methionine 0.17 1.40 1.81 0.22 0.63 1.45 0.00 0.40 0.81 Tripto-Plus (L-Tryptophan) ** 0.22 4.65 6.13 0.20 1.68 4.64 0.00 1.31 2.79 L-Threonine 0.00 1.83 2.45 0.31 0.93 2.17 0.08 0.70 1.31 Vitamins-Minerals premix *** 2.50 2.50 2.50 2.50 2.50 2.50 2.50 2.50 2.50 Salt 3.50 3.50 3.50 3.50 3.50 3.50 3.50 3.50 3.50 Antioxidant (Etoxiquine) 0.23 0.23 0.23 0.23 0.23 0.23 0.23 0.23 0.23 CaCO3 10.25 10.93 11.15 10.27 10.50 10.95 8.80 9.02 9.25 Conjugated linoleic acid **** 0.00 0.00 0.00 0.00 0.00 0.00 0.00 0.00 0.00 Dicalcium phosphate 10.28 11.28 11.62 6.87 7.21 7.88 5.33 5.67 6.00 Total 1000.00 1000.00 1000.00 1000.00 1000.00 1000.00 1000.00 1000.00 1000.00 Calculated Analysis, (g/kg)
Metabolizable energy, Mcal kg-1 3.279 3.279 3.279 3.308 3.308 3.308 3.319 3.319 3.319 Crude protein 205.0 160.0 145.0 160.0 145.0 115.0 140.0 125.0 110.0
Calcium 7.0 7.0 7.0 6.0 6.0 6.0 5.0 5.0 5.0
Available phosphorus 3.2 3.2 3.2 2.3 2.3 2.3 1.9 1.9 1.9
Lysine 10.1 10.1 10.1 8.3 8.3 8.3 6.6 6.6 6.6
Threonine 6.5 6.5 6.5 5.2 5.2 5.2 4.3 4.3 4.3
Tryptophan 2.3 2.3 2.3 1.7 1.7 1.7 1.4 1.4 1.4 Methionine 3.0 3.6 3.8 2.5 2.7 3.1 2.0 2.2 2.4
Arginine 12.1 8.1 6.7 8.5 7.1 4.4 7.0 5.6 4.3
Histidine 4.7 3.4 2.9 3.5 3.1 2.2 3.0 2.6 2.1
Isoleucine 7.8 5.7 5.0 5.9 5.2 3.8 5.1 4.4 3.7 Leucine 16.8 13.9 12.9 14.2 13.3 11.3 13.2 12.2 11.3
Valine 8.4 6.4 5.7 6.6 5.9 4.5 5.8 5.1 4.4
Methonine + Cystine 5.8 5.8 5.8 4.7 4.7 4.7 4.0 4.0 4.0
Determined anaylsis, %
Crude protein 212.0 173.0 152.0 166.0 155.0 120.0 135.0 119.0 113.0
‡
T1, T3, T5 are the basal diets without CLA addition.
* BioLys contains: crude protein, 75%; available phosphorus, 0.16%; lysine, 50.7%; threonine, 0.4%; tryptophan, 0.14%; methionine, 0.2%; arginine, 0.6%; isoleucine, 0.4%; leucine, 0.7%; valine, 0.7%; cystine, 0.1%.
* Tripto Plus contains: crude protein, 95%; lysine, 55.3%; threonine, 0.15%; tryptophan, 15%; valine, 0.5%; methionine+cystine, 1.75%.
** Each kg of feed supplied: vitamin A, 6250 IU; vitamin D, 1250 IU; vitamin E, 25 IU; vitamin K3, 2.5 mg; B1, 1.25 mg; B2, 6.25 g; B5, 31.25 mg; B6, 2.5 mg; B12, 0.01875 mg; folic acid, 3.75 mg; Vit. H, 0.225 mg; pantothenic acid, 18.75 mg; choline, 381.25 mg; Fe, 125 mg; Zn, 125 mg; Mn, 125 mg; Cu, 12.5 mg; Se, 0.25 mg; I, 0.375 mg; Co, 0.125 mg.
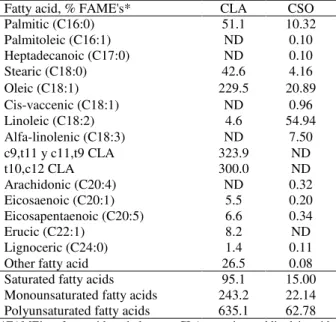
Table 2 - Fatty acid profile in CLA and soybean oil used in the experimental diets (g/kg).
Fatty acid, % FAME's* CLA CSO Palmitic (C16:0) 51.1 10.32 Palmitoleic (C16:1) ND 0.10 Heptadecanoic (C17:0) ND 0.10 Stearic (C18:0) 42.6 4.16 Oleic (C18:1) 229.5 20.89 Cis-vaccenic (C18:1) ND 0.96 Linoleic (C18:2) 4.6 54.94 Alfa-linolenic (C18:3) ND 7.50 c9,t11 y c11,t9 CLA 323.9 ND
t10,c12 CLA 300.0 ND
Arachidonic (C20:4) ND 0.32 Eicosaenoic (C20:1) 5.5 0.20 Eicosapentaenoic (C20:5) 6.6 0.34
Erucic (C22:1) 8.2 ND
Lignoceric (C24:0) 1.4 0.11 Other fatty acid 26.5 0.08 Saturated fatty acids 95.1 15.00 Monounsaturated fatty acids 243.2 22.14 Polyunsaturated fatty acids 635.1 62.78
*FAME’s = fatty acid methyl esters; CLA = conjugated linoleic acid; CSO = crude soybean oil; ND = not detectable.
Samples were processed according to the methods described by Folch for total lipid analysis (Folch et al. 1957). Methyl esters of meat fatty acids were obtained and saponification was performed using boron trifluoride. Fatty acids were quantified by gas chromatography using a DB-23 column (JW 122-2332 of 30 m × 0.25 mm internal diameter) on a Varian 3400 CX gas-liquid chromatograph, equipped with an autosampler and a flame ionization detector (Varian Associates, Inc., Sugar Land, TX). Myristic acid (Sigma Chemical Co., St. Louis, MO.) was used as an internal standard for fatty acids (method 994.10; AOAC 2000). Retention times were compared with fatty acid methyl ester standards.
Statistical analysis
The ADG, ADFI, and FGR were analyzed using the average of each stage of the growth with the general linear model (GLM) procedure of SAS (2002) and the statistical models indicated. Initial body weight was used as a covariate in the statistical analysis of the variables that required it. The means treatment comparison of the main factors effect was performed with the Tukey test or LSMEANS (P≤0.07).
RESULTS
Nursery phase
No interaction between the CLA and CP level was observed on the growth response and carcass characteristics variables (Table 3), or on PUN
concentration (P>0.05). The reduction of CP by 6.0% diminished ADG and final weight (FW) and ADFI (P≤0.05) without affecting the FGR (P>0.05). But, lower BT, LMA, and FFLG (P≤0.01) were observed. However, pigs fed 16.0% CP had higher BT and LMA (P≤0.05), although similar FFLG as in the pigs fed 20.5% CP. The final LMP and PUN concentration were not affected (P>0.05) by the dietary CP level. Supplementation of the CLA in the diet did not improve (P>0.05) growth performance, carcass characteristics or PUN of the pigs.
Growing phase
There was no interaction (P>0.05) between the main factors (Table 4). Reducing dietary CP from 16.0 to 11.5% decreased final BW, ADG and ADFI (P≤0.05), but not FGR (P>0.05). When CP was lowered from 16.0 to 14.5%, the FFLG was similar; however, when CP was reduced up to 11.5%, FFLG was 58 g d-1 (P≤0.05) and LMA was 419 mm2 lower (P≤0.05) than in the pigs fed 16.0% CP. The BT and LMP were not affected by the dietary CP level (P>0.05). The PUN was 39% lower in the pigs fed 11.5% CP (P≤0.05). The CLA supplementation had no effect (P>0.05) on the analyzed variables.
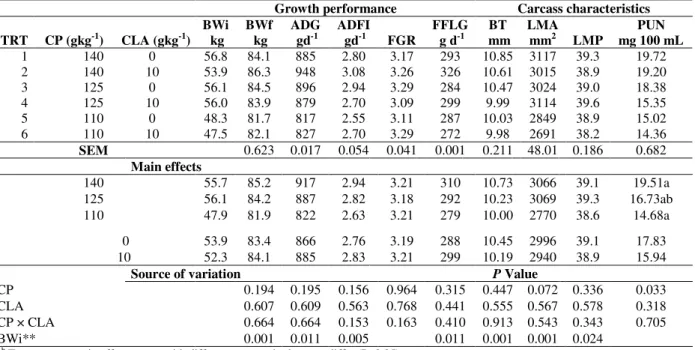
Finishing phase
The reduction of CP level from 14.0 to 11.0% tended to diminish the LMA (P=0.07) and lowered PUN concentration (P≤0.05) (Table 5). However, there was no effect of main factors or their interaction (P>0.05) on other variables in this stage of growth.
Whole fattening period
the pigs fed the lowest dietary CP (P≤0.05). The LMP was not affected by the dietary CP concentration (P>0.05). Plasma urea nitrogen
concentration tended to be reduced in the pigs fed the lowest CP level (P=0.07).
Table 3 - Effect of dietary crude protein and linoleic acid concentration on growth performance, carcass characteristics and plasma urea nitrogen concentration of nursery pigs*.
Growth performance Carcass characteristics
TRT
CP (gkg-1)
CLA (gkg-1)
BWi kg
BWf kg
ADG g d-1
ADFI
g d-1 FGR
FFLG g d-1
BT mm
LMA mm2 LMP
PUN mg 100 mL 1 205 0 17.3 33.3 757 1.53 2.03 309 3.50 1375 44.4 6.19 2 205 10 17.4 32.8 732 1.50 2.05 289 3.33 1337 44.4 5.01 3 160 0 17.2 33.0 745 1.58 2.13 307 4.01 1441 44.7 4.12 4 160 10 17.7 33.8 783 1.63 2.09 300 3.62 1384 44.2 5.35 5 145 0 17.4 31.0 649 1.41 2.17 269 2.99 1261 44.9 4.44 6 145 10 17.2 30.3 617 1.31 2.13 251 3.02 1224 44.8 4.19 SEM 0.242 0.011 0.027 0.028 0.001 0.079 19.18 0.222 0.325
Main effects
205 17.3 33.0a 745a 1.52ab 2.04 299a 3.41ab 1356ab 44.4 5.60 160 17.4 33.4a 764a 1.60a 2.11 303a 3.82a 1413a 44.5 4.73 145 17.3 30.7b 633b 1.37b 2.15 260b 3.01b 1243b 44.9 4.30
0 17.3 32.5 717 1.51 2.10 295 3.50 1359 44.7 4.94 10 17.4 32.3 710 1.48 2.09 280 3.32 1315 44.5 4.85
Source of variation P value
CP 0.001 0.001 0.004 0.285 0.002 0.001 0.004 0.714 0.278 CLA 0.783 0.784 0.658 0.776 0.146 0.273 0.261 0.639 0.923 CP × CLA 0.404 0.402 0.534 0.861 0.859 0.575 0.969 0.883 0.316 BWi ** 0.001 0.001 0.005 0.018 0.006 0.001 0.005
a, b Treatment means or main effect with different superscript by row, differ (P≤0.05).
* TRT = treatment; CP = crude protein; CLA = conjugated linoleic acid; SEM = standard error of the mean; BWi = initial body weight; BWf = final body weight; ADG = average daily gain; ADFI = average daily feed intake; FGR = feed: gain ratio; FFLG = fat free lean gain; BT = backfat thickness; LMA = longissimus muscle area; LMP = lean meat percentage; PUN = plasma urea nitrogen concentration. ** Treatment means adjusted by initial body weight as covariate (P≤0.05).
Table 4 - Effect of dietary crude protein and conjugated linoleic acid concentration on growth performance, carcass characteristics, and plasma urea nitrogen concentration of growing pigs*.
Growth performance Carcass characteristics
TRT CP (gkg-1) CLA (gkg-1) BWi
kg BWf
Kg
ADG g d-1
ADFI g d-1 FGR
FFLG g d-1
BT mm
LMA mm2 LMP
PUN mg 100 mL 1 160 0 33.3 55.5 823 2.20 2.67 324 6.23 2372 42.5 17.03 2 160 10 32.8 54.6 789 2.23 2.86 301 6.35 2220 41.9 16.50 3 145 0 32.8 54.2 775 2.21 2.88 308 5.95 2343 42.8 16.18 4 145 10 35.1 53.6 754 2.12 2.77 296 6.47 2396 42.7 14.38 5 115 0 31.0 50.7 653 1.89 2.97 234 5.97 1891 41.4 10.68 6 115 10 30.1 51.5 679 1.92 2.93 251 5.63 1878 41.5 9.81
SEM 0.386 0.013 0.040 0.056 0.001 0.132 50.40 0.244 0.327 Main effects
160 33.1 55.0a 806a 2.22a 2.75 313a 6.29 2303a 42.2 16.79a 145 33.8 53.9a 764a 2.17ab 2.83 302a 6.21 2367a 42.8 15.36a 115 30.5 51.1b 666b 1.90b 2.95 242b 5.80 1884b 41.4 10.20b
0 32.4 53.5 750 2.10 2.83 289 6.05 2220 42.2 14.86 10 32.5 53.2 741 2.09 2.85 283 6.15 2147 42.0 13.33
Source of variation P Value
CP 0.002 0.002 0.017 0.418 0.002 0.348 0.001 0.145 0.001 CLA 0.738 0.734 0.893 0.927 0.690 0.721 0.717 0.693 0.115 CP × CLA 0.657 0.659 0.771 0.543 0.538 0.445 0.703 0.837 0.716
BWi ** 0.001 0.001 0.002 0.006 0.010 0.002
a, b Treatment or main effect means with different superscript by row, differ (P≤0.05).
* TRT = treatment; CP = crude protein; CLA = conjugated linoleic acid; SEM = standard error of the mean; BWi = initial body weight; BWf = final body weight; ADG = average daily gain; ADFI = average daily feed intake; FGR = feed: gain ratio; FFLG = fat free lean gain; BT = backfat thickness; LMA = longissimus muscle area; LMP = lean meat percentage; PUN = plasma urea nitrogen concentration.
Table 5 - Effect of crude protein and conjugated linoleic acid concentration on growth performance, carcass characteristics and plasma urea nitrogen concentration of finishing pigs*.
Growth performance Carcass characteristics
TRT CP (gkg-1) CLA (gkg-1) BWi
kg BWf
kg
ADG gd-1
ADFI gd-1 FGR
FFLG g d-1
BT mm
LMA mm2 LMP
PUN mg 100 mL 1 140 0 56.8 84.1 885 2.80 3.17 293 10.85 3117 39.3 19.72 2 140 10 53.9 86.3 948 3.08 3.26 326 10.61 3015 38.9 19.20 3 125 0 56.1 84.5 896 2.94 3.29 284 10.47 3024 39.0 18.38 4 125 10 56.0 83.9 879 2.70 3.09 299 9.99 3114 39.6 15.35 5 110 0 48.3 81.7 817 2.55 3.11 287 10.03 2849 38.9 15.02 6 110 10 47.5 82.1 827 2.70 3.29 272 9.98 2691 38.2 14.36 SEM 0.623 0.017 0.054 0.041 0.001 0.211 48.01 0.186 0.682
Main effects
140 55.7 85.2 917 2.94 3.21 310 10.73 3066 39.1 19.51a 125 56.1 84.2 887 2.82 3.18 292 10.23 3069 39.3 16.73ab 110 47.9 81.9 822 2.63 3.21 279 10.00 2770 38.6 14.68a
0 53.9 83.4 866 2.76 3.19 288 10.45 2996 39.1 17.83 10 52.3 84.1 885 2.83 3.21 299 10.19 2940 38.9 15.94
Source of variation P Value
CP 0.194 0.195 0.156 0.964 0.315 0.447 0.072 0.336 0.033 CLA 0.607 0.609 0.563 0.768 0.441 0.555 0.567 0.578 0.318 CP × CLA 0.664 0.664 0.153 0.163 0.410 0.913 0.543 0.343 0.705 BWi** 0.001 0.011 0.005 0.011 0.001 0.001 0.024
a, b Treatment or main effect means with different superscript by row, differ (P≤0.05).
* TRT = treatment; CP = crude protein; CLA = conjugated linoleic acid; SEM = standard error of the mean; BWi = initial body weight; BWf = final body weight; ADG = average daily gain; ADFI = average daily feed intake; FGR = feed: gain ratio; FFLG = fat free lean gain; BT = backfat thickness; LMA = longissimus muscle area; LMP = lean meat percentage; PUN = plasma urea nitrogen concentration.
**Treatment means adjusted by initial body weight as covariate (P≤0.05).
Table 6 - Effect of crude protein and conjugated linoleic acid level on growth performance, carcass characteristics, and plasma urea nitrogen concentration of 17.3-83.5 kg pigs*.
Growth performance Carcass characteristics
TRT CP***
CLA (gkg-1)
BWi kg
BWf kg
ADG g d-1
ADFI g d-1 FGR
FFLG g d-1
BT mm
LMA mm2 LMP
PUN mg 100 mL 1 1 0 17.4 88.8 851 2.34 2.75 315 11.50 3252 39.0 19.7 2 1 10 16.8 85.6 812 2.38 2.95 294 10.20 2951 39.1 17.8 3 2 0 17.3 88.6 849 2.40 2.83 310 11.00 3134 38.8 18.4 4 2 10 17.9 88.4 846 2.32 2.75 314 11.00 3365 39.5 15.7 5 3 0 17.4 75.3 690 1.96 2.84 254 9.20 2674 39.3 15.0 6 3 10 17.2 75.0 687 1.99 2.92 246 9.00 2483 38.6 14.4 SEM 1.216 0.014 0.044 0.031 0.001 0.275 56.65 0.203 0.713
Main effects
1 17.1 87.2a 832a 2.36a 2.84 304ª 10.90a 3115a 39.0 18.8 2 17.6 88.5a 847a 2.36a 2.79 312ª 11.00a 3249a 39.1 17.0 3 17.3 75.1b 688b 1.97b 2.87 250b 9.09b 2570b 38.9 14.6
0 17.4 84.2 797 2.23 2.80 293 10.62 3035 39.1 17.8 10 17.3 83.0 782 2.23 2.87 285 10.00 2905 39.0 15.8
Source of variation P Value
CP 0.001 0.001 0.001 0.555 0.001 0.015 0.001 0.941 0.079 CLA 0.612 0.611 0.959 0.317 0.412 0.374 0.449 0.974 0.230 CP × CLA 0.838 0.840 0.820 0.194 0.639 0.589 0.158 0.419 0.842
BWi** 0.001 0.016 0.028 0.029
a, b Treatment or main effect means with different superscript by row, differ (P≤0.05).
* TRT = treatment; CP = crude protein; CLA = conjugated linoleic acid; SEM = standard error of the mean; BWi = initial body weight; BWf = final body weight; ADG = average daily gain; ADFI = average daily feed intake; FGR = feed: gain ratio; FFLG = fat free lean gain; BT = backfat thickness; LMA = longissimus muscle area; LMP = lean meat percentage; PUN = plasma urea nitrogen concentration.
Fatty acids concentration in meat
There was no effect of interaction between the CP×CLA level on the fatty acid profile, except for linoleic acid (P≤0.045; Table 7) in the SM muscle and c9,t11 and c11,t9 CLA isomer (P≤0.039; Table 8) in the LM. Tables 7 and 8 present the fatty acid profile for the standard CP (control diet) and the lowest value of CP and CLA level.
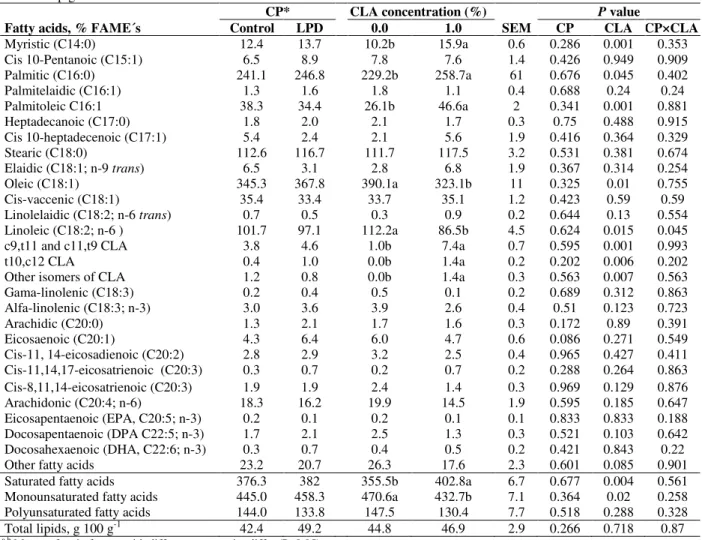
Semimembranosusmuscle
Total lipid concentration and fatty acids profile in
semimembranosus muscle (SM; Table 7) were
only affected (P≤0.05) by the dietary oil concentration. The level of CLA isomers in the SM was higher (P≤0.05) in the pigs fed 10 g CLA kg-1 of feed. Dietary CLA increased (P≤0.05) the myristic, palmitic, and palmitoleic acids, and reduced (P≤0.05) the oleic and linoleic acids. Total saturated fatty acid (SFA) concentration increased and the total monounsaturated fatty acid (MUFA) content decreased by the addition of CLA in the diet (P≤0.05).
Table 7 - Effect of crude protein and conjugated linoleic acid level on total lipids and fatty acids profile in semimembranosus muscle of pig.
Fatty acids, % FAME´s
CP* CLA concentration (%) P value
Control LPD 0.0 1.0 SEM CP CLA CP×CLA Myristic (C14:0) 12.4 13.7 10.2b 15.9a 0.6 0.286 0.001 0.353 Cis 10-Pentanoic (C15:1) 6.5 8.9 7.8 7.6 1.4 0.426 0.949 0.909 Palmitic (C16:0) 241.1 246.8 229.2b 258.7a 61 0.676 0.045 0.402 Palmitelaidic (C16:1) 1.3 1.6 1.8 1.1 0.4 0.688 0.24 0.24 Palmitoleic C16:1 38.3 34.4 26.1b 46.6a 2 0.341 0.001 0.881 Heptadecanoic (C17:0) 1.8 2.0 2.1 1.7 0.3 0.75 0.488 0.915 Cis 10-heptadecenoic (C17:1) 5.4 2.4 2.1 5.6 1.9 0.416 0.364 0.329 Stearic (C18:0) 112.6 116.7 111.7 117.5 3.2 0.531 0.381 0.674 Elaidic (C18:1; n-9 trans) 6.5 3.1 2.8 6.8 1.9 0.367 0.314 0.254 Oleic (C18:1) 345.3 367.8 390.1a 323.1b 11 0.325 0.01 0.755 Cis-vaccenic (C18:1) 35.4 33.4 33.7 35.1 1.2 0.423 0.59 0.59 Linolelaidic (C18:2; n-6 trans) 0.7 0.5 0.3 0.9 0.2 0.644 0.13 0.554 Linoleic (C18:2; n-6 ) 101.7 97.1 112.2a 86.5b 4.5 0.624 0.015 0.045 c9,t11 and c11,t9 CLA 3.8 4.6 1.0b 7.4a 0.7 0.595 0.001 0.993 t10,c12 CLA 0.4 1.0 0.0b 1.4a 0.2 0.202 0.006 0.202 Other isomers of CLA 1.2 0.8 0.0b 1.4a 0.3 0.563 0.007 0.563 Gama-linolenic (C18:3) 0.2 0.4 0.5 0.1 0.2 0.689 0.312 0.863 Alfa-linolenic (C18:3; n-3) 3.0 3.6 3.9 2.6 0.4 0.51 0.123 0.723 Arachidic (C20:0) 1.3 2.1 1.7 1.6 0.3 0.172 0.89 0.391 Eicosaenoic (C20:1) 4.3 6.4 6.0 4.7 0.6 0.086 0.271 0.549 Cis-11, 14-eicosadienoic (C20:2) 2.8 2.9 3.2 2.5 0.4 0.965 0.427 0.411 Cis-11,14,17-eicosatrienoic (C20:3) 0.3 0.7 0.2 0.7 0.2 0.288 0.264 0.863 Cis-8,11,14-eicosatrienoic (C20:3) 1.9 1.9 2.4 1.4 0.3 0.969 0.129 0.876 Arachidonic (C20:4; n-6) 18.3 16.2 19.9 14.5 1.9 0.595 0.185 0.647 Eicosapentaenoic (EPA, C20:5; n-3) 0.2 0.1 0.2 0.1 0.1 0.833 0.833 0.188 Docosapentaenoic (DPA C22:5; n-3) 1.7 2.1 2.5 1.3 0.3 0.521 0.103 0.642 Docosahexaenoic (DHA, C22:6; n-3) 0.3 0.7 0.4 0.5 0.2 0.421 0.843 0.22 Other fatty acids 23.2 20.7 26.3 17.6 2.3 0.601 0.085 0.901 Saturated fatty acids 376.3 382 355.5b 402.8a 6.7 0.677 0.004 0.561 Monounsaturated fatty acids 445.0 458.3 470.6a 432.7b 7.1 0.364 0.02 0.258 Polyunsaturated fatty acids 144.0 133.8 147.5 130.4 7.7 0.518 0.288 0.328 Total lipids, g 100 g-1 42.4 49.2 44.8 46.9 2.9 0.266 0.718 0.87
a,b Means of main factors with different superscript differ (P≤0.05).
*FAME’s = fatty acid methyl esters; CP = crude protein; LPD = low-protein diet; CLA = conjugated linoleic acid; SEM = standard error of the mean.
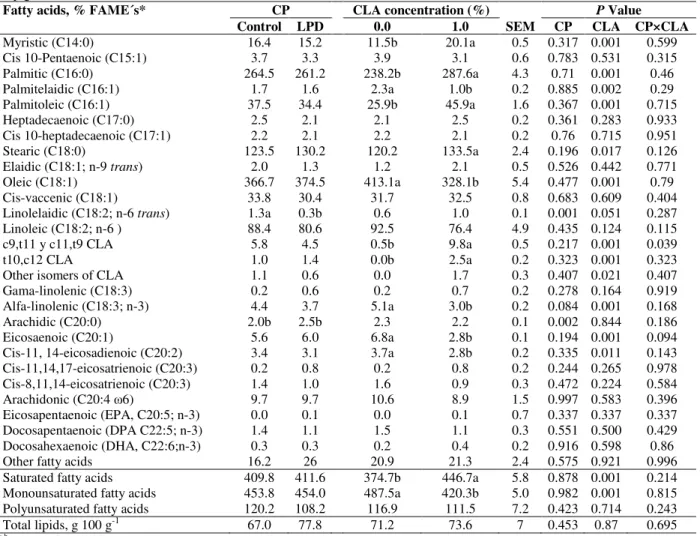
Longissimusmuscle
The reduction of dietary CP lowered linolelaidic acid concentration (Table 8) and increased arachidic acid (P≤0.05) in longissimus muscle (LM). The alpha-linolenic acid (C18:3; n-3) concentration was lower (P=0.08) in the pigs fed
were reduced with CLA supplementation to the diet. Total SFA increased and the MUFA decreased (P≤0.05) in the pigs fed diets supplemented with CLA. The interaction of CP×CLA changed (P≤0.05) the concentration of
CLA isomers (c9,t11 and c11,t9), with higher concentration in the pigs fed diets with CLA; however, their concentration was lower in the pigs fed LPD.
Table 8 - Effect of crude protein and conjugated linoleic acid level on total lipids and fatty acids profile in longissimus muscle of pigs.
Fatty acids, % FAME´s* CP CLA concentration (%) SEM
P Value
Control LPD 0.0 1.0 CP CLA CP×CLA
Myristic (C14:0) 16.4 15.2 11.5b 20.1a 0.5 0.317 0.001 0.599 Cis 10-Pentaenoic (C15:1) 3.7 3.3 3.9 3.1 0.6 0.783 0.531 0.315 Palmitic (C16:0) 264.5 261.2 238.2b 287.6a 4.3 0.71 0.001 0.46 Palmitelaidic (C16:1) 1.7 1.6 2.3a 1.0b 0.2 0.885 0.002 0.29 Palmitoleic (C16:1) 37.5 34.4 25.9b 45.9a 1.6 0.367 0.001 0.715 Heptadecaenoic (C17:0) 2.5 2.1 2.1 2.5 0.2 0.361 0.283 0.933 Cis 10-heptadecaenoic (C17:1) 2.2 2.1 2.2 2.1 0.2 0.76 0.715 0.951 Stearic (C18:0) 123.5 130.2 120.2 133.5a 2.4 0.196 0.017 0.126 Elaidic (C18:1; n-9 trans) 2.0 1.3 1.2 2.1 0.5 0.526 0.442 0.771 Oleic (C18:1) 366.7 374.5 413.1a 328.1b 5.4 0.477 0.001 0.79 Cis-vaccenic (C18:1) 33.8 30.4 31.7 32.5 0.8 0.683 0.609 0.404 Linolelaidic (C18:2; n-6 trans) 1.3a 0.3b 0.6 1.0 0.1 0.001 0.051 0.287 Linoleic (C18:2; n-6 ) 88.4 80.6 92.5 76.4 4.9 0.435 0.124 0.115 c9,t11 y c11,t9 CLA 5.8 4.5 0.5b 9.8a 0.5 0.217 0.001 0.039 t10,c12 CLA 1.0 1.4 0.0b 2.5a 0.2 0.323 0.001 0.323 Other isomers of CLA 1.1 0.6 0.0 1.7 0.3 0.407 0.021 0.407 Gama-linolenic (C18:3) 0.2 0.6 0.2 0.7 0.2 0.278 0.164 0.919 Alfa-linolenic (C18:3; n-3) 4.4 3.7 5.1a 3.0b 0.2 0.084 0.001 0.168 Arachidic (C20:0) 2.0b 2.5b 2.3 2.2 0.1 0.002 0.844 0.186 Eicosaenoic (C20:1) 5.6 6.0 6.8a 2.8b 0.1 0.194 0.001 0.094 Cis-11, 14-eicosadienoic (C20:2) 3.4 3.1 3.7a 2.8b 0.2 0.335 0.011 0.143 Cis-11,14,17-eicosatrienoic (C20:3) 0.2 0.8 0.2 0.8 0.2 0.244 0.265 0.978 Cis-8,11,14-eicosatrienoic (C20:3) 1.4 1.0 1.6 0.9 0.3 0.472 0.224 0.584 Arachidonic (C20:4 ω6) 9.7 9.7 10.6 8.9 1.5 0.997 0.583 0.396 Eicosapentaenoic (EPA, C20:5; n-3) 0.0 0.1 0.0 0.1 0.7 0.337 0.337 0.337 Docosapentaenoic (DPA C22:5; n-3) 1.4 1.1 1.5 1.1 0.3 0.551 0.500 0.429 Docosahexaenoic (DHA, C22:6;n-3) 0.3 0.3 0.2 0.4 0.2 0.916 0.598 0.86 Other fatty acids 16.2 26 20.9 21.3 2.4 0.575 0.921 0.996 Saturated fatty acids 409.8 411.6 374.7b 446.7a 5.8 0.878 0.001 0.214 Monounsaturated fatty acids 453.8 454.0 487.5a 420.3b 5.0 0.982 0.001 0.815 Polyunsaturated fatty acids 120.2 108.2 116.9 111.5 7.2 0.423 0.714 0.243 Total lipids, g 100 g-1 67.0 77.8 71.2 73.6 7 0.453 0.87 0.695
a,b Means of main factors with different superscript differ (P≤0.05). *FAME’s = fatty acid methyl esters; CP = crude protein; LPD =
low-protein diet; CLA = conjugated linoleic acid; SEM = standard error of the mean.
DISCUSSION
Growth performance
The reduction of average daily gain but not feed: gain ratio in the nursery pigs due to a higher reduction of CP as observed in the present study has also been earlier observed in the nursery pigs fed sorghum-soybean meal diet with 4% less protein (Hansen et al. 1993) and with corn-soybean meal diets with 4% (Kerr et al. 1995) or 5.0% (Le Bellego and Noblet 2002) less CP supplemented with crystalline amino acids. Reduction of CP by 1.5% during the growing
phase did not affect the growth performance variables, but when CP was lowered from 16.0 to 11.5%, ADG and ADFI were diminished by 140 and 320 gd-1, respectively. The reduction of ADG and ADFI could have been originated because a higher reduction would limit some AA such as isoleucine and valine, affecting negatively the response of the pigs (Figueroa et al. 2002). This lower response of the pigs fed low-protein diets could also be due to the reduction of nitrogen for the synthesis of non-essential AA (Tuitoek et al.
could be partly metabolized and used for the synthesis of non-essential AA (Heger et al. 1998). However, with the proper supply of essential and non-essential AA, the maximum growth performance (Kerr et al. 2003; Shriver et al. 2003; Deng et al. 2007) in the pigs fed low-protein diets could be obtained. The reduction of the negative impact on the production variables in low protein diets through the supplementation with synthetic amino acids in finishing diets has been reported with a dietary CP reduction up to 4% (Kerr et al.
1995; Knowles et al. 1998; Kerr et al. 2003). However, Figueroa et al. (2004) observed lower ADG and feed efficiency when dietary CP was reduced from 16 to 13% for 55-100 kg pigs (Tuitoek et al. 1997). In addition, FGR increased when CP was reduced (Kerr et al. 2003; Figueroa et al. 2004), which could be due to the limiting amounts of isoleucine and valine when dietary CP was reduced by 4.0% or more, becoming marginal or deficient (Liu et al. 1999).
CLA supplementation for the nursery and growing pigs did not improve the analyzed variables. It has been observed that the addition of 2% CLA increased the ADG by 5.0% and FGR by 7.0%, without affecting the ADFI (Bee 2001). However, in another study, the addition of 1% CLA from a source with 60.0% of CLA for 49-113 kg did not improve the growth performance (Averette-Gatlin et al. 2002) or with 1.0 or 2.0% of CLA for the gilts (Martin et al. 2008a), which was similar to results found in the present study.
The growing-finishing pigs fed diets with low fat concentration had better response to CLA addition (Dugan et al. 2001). However, fat concentration in the diets used in the present study was even lower than that by Dugan et al. (2001), and still there were no significant differences due to the inclusion of CLA. Schinckel et al. (2000) also used 1.0% of CLA in the diets for gilts with different genetic potential during fattening period which did not change the growth performance.
Carcass characteristics
Feeding the pigs with low-protein (LPD) AA-supplemented diets increased the body energy retention in the growing pigs, resulting in higher carcass fat (Tuitoek et al. 1997). This increment in energy retention as fat was observed when crude protein was reduced more than 3.0% in the diets for 100 kg pigs (Le Bellego et al. 2001). There are reports stating that the body fat increases in the pigs fed LPD supplemented with AA (Kerr et al.
1995; Gómez et al. 2002). In contrast, it has also been observed that the reduction of CP by 4% had similar effects on backfat thickness (Canh et al.
1998), or when CP was reduced from 16.6 to 13.0% (Tuitoek et al. 1997) in the growing or finishing pig diets. These results were similar to the present findings in the growing and finishing stages, but not in nursery pigs.
The FFLG and fat accumulation in the pigs did not change when CP was reduced by 4.0% (Kerr et al. 2003). However, in another study, FFLG and LMA were reduced in the same proportion as CP was lowered in the growing gilts without affecting backfat thickness (Figueroa et al. 2002). It also has been found that in spite of the reduction of LMA in the pigs fed low-protein diets, other carcass characteristics such as FFLG, backfat thickness, and lean meat percentage were not affected by the reduction of dietary protein (Kerr et al. 2003). Other studies reported no difference on LMA in the pigs fed standard or LPD supplemented with AA (Kerr et al. 1995; Knowles et al. 1998). The present results showed a lower LMA during the nursery and growing phases due to the CP concentration, as was found in other investigation (Liu et al. 1999).
The inclusion of 0.5% of CLA in growing-finishing diets produced no change in lean meat percentage (LMP) and backfat thickness (Lauridsen et al. 2005). In contrast, fat deposition was reduced by 31.0% with the addition of 1% CLA, and, consequently, the ratio fat: lean meat decreased with increasing amount of CLA. This low effect on the carcass traits in the pigs consuming CLA, found in this study has been reported by others with similar concentration (1.0%) and just an increase of 18.8% in marbling score in 49-113 kg pigs (Averette-Gatlin et al. 2002). In addition, the lean meat deposition had a quadratic response to the dietary CLA concentration, finding the maximum response at 0.5% CLA for the finishing pigs (Ostrowska et al.
1999). The LMA did not change by CLA concentration up to 2%; backfat thickness increased in the growing pigs fed 0.25 and 0.5% CLA compared with corn oil (Ramsay et al.
firmness; Wiegand et al. 2001).The inclusion of 2.0% CLA did not affect the LMP and LMA in 70-106 kg pigs. The backfat thickness was lower in the pigs fed CLA than those fed linoleic acid or lard (Bee 2001). In another study, supplementation of 1 or 2% CLA did not affect the carcass characteristics of finishing pigs fed ad
libitum (Martin et al. 2008a), or with 2% in the
pigs restricted-fed (Migdal et al. 2004). The carcass of pigs fed up to 1.0% of CLA isomers during the growing-finishing phase showed lower subcutaneous fat; the LMA was reduced with CLA concentration higher than 0.5% with direct measurement, but it increased by the addition of the CLA when measured by ultrasound (Thiel-Cooper et al. 2001).
In barrows, the addition of CLA isomers (1.5 or 3.0 g kg-1) during the period of rapid accumulation of fat (90-120 kg) reduced fat deposition and increased LMP (Su et al. 2006). Hence, the period of CLA feeding was an important factor in the response of the pigs (Azain 2003). In TBP pigs (TLRI Black Pig; a type of fat pig), fat content in the meat increased when the period of feeding the CLA was longer (Su et al. 2006). Wiegand et al.
(2002) reported that the inclusion of 0.75% of CLA isomers in 56-115 kg pigs increased the LMA and reduced backfat thickness; this effect was the same if the feeding period started at 28 kg. In 63.8-98.9 kg barrows with longer CLA intake time (3 vs. 6 weeks) in high concentration (4.0%), backfat decreased and LMA and intramuscular fat increased (Sun et al. 2004). In the present study, the feeding period was longer than the above study without effect on the mentioned variables. This suggested that fatter pigs responded better to CLA treatment than the pigs with higher genetic potential for lean gain and lower backfat thickness (Azain 2003). Despite this, CLA improved the carcass quality in genetically lean meat pigs by changing the fatty acid concentration and reducing backfat thickness, an effect that was a function of feeding time of CLA supplemented diet (Schinckel et al. 2000).
Plasma urea nitrogen concentration
Reducing dietary crude protein reduced the linearly PUN concentration (Figueroa et al. 2002), as was observed in this study during growing-finishing phase. A lower PUN concentration was also related to a lower metabolic heat production associated to the synthesis and excretion of urea
from the dietary AA excess (Kerr et al. 2003). The reduction of PUN in the pigs fed ideal protein diets compared with standard intact protein indicated that there was AA excess in the standard diets. In addition, pigs fed low-protein diets used more efficiently dietary protein than the pigs fed standard diets; those pigs retained similar amount of nitrogen than the pigs fed a standard diet if the reduction of crude protein was adequate (Shriver et al. 2003). The fecal and urinary nitrogen excretion could be reduced by 10% for each percentage unit that crude protein was reduced (Shriver et al. 2003). The urinary nitrogen excretion of pigs is linearly and positively related to PUN concentration. Hence, reducing the crude protein is an alternative to lower total nitrogen excretion and an indirect way to measure the amount of nitrogen retention and waste (Zervas and Zijlstra 2002). Feeding LPD indirectly reduces the ammonia production due to the dietary nitrogen reduction (Canh et al. 1998; Hayes et al.
2004), but if the reduction of crude protein is not adequate, growth performance and carcass characteristics could be adversely affected. The dietary 1.0% CLA supplementation for growing pigs (Ramsay et al. 2001) or 0.75% for finishing (105-153 kg) pigs (Corino et al. 2008) did not affect the PUN concentration, as also was observed in the present study, indicating no effect on protein metabolism and that its function was directed to lipid metabolism.
Fatty acid profile in meat
The accumulation of CLA isomers in intramuscular fat of semimembranosus (SM) and
longissimus muscle (LM), found had been
previously reported mainly for LM (Migdal et al. 2004) and its concentration was related to the CLA level included in the diet (Ramsay et al. 2001; Joo et al. 2002). The c9,t11 and c11,t9 are the main isomers accumulated in the muscle of pigs (Thiel-Cooper et al. 2001; Lauridsen et al. 2005; Martin et al. 2008b).
CONCLUSIONS
Reducing the crude protein concentration in the diet of fattening pigs from 20.5 to 16.0% in the nursery phase, from 16.0 to 14.5% in the growing stage, and from 14.0 to 12.5% in the finishing pigs did not negatively affect the growth performance, nor carcass characteristics. The addition of conjugated linoleic acid to low-protein or standard diets did not improve the growth performance or carcass characteristics, although it improved the concentration of some fatty acids in the meat. Hence, its addition to diet would depend on the advantage of its cost compared to other energy sources such as soybean oil.
AKNOWLEDGEMENTS
This study was partially funded by: Fideicomiso Revocable de Administración e Inversión No.
167304-2008, Colegio de Postgraduados, México.
REFERENCES
AOAC: Association of Official Analytical Chemists. Official Methods of Analysis. 15th ed. Arlington, VA. USA: AOAC; 1990.
AOAC: Association of Official Analytical Chemists. Official Methods of Analysis. 17th ed. Whashington, DC. USA: AOAC; 2000.
Averette-Gatlin L, See MT, Larick DK, Lin X, Odle J. Conjugated linoleic acid in combination with supplemental dietary fat alters pork fat quality. J Nutr. 2002; 132(10): 3105-3112.
Azain MJ. Conjugated linoleic acid and its effects on animal products and health in single-stomached animals. Proc Nutr Soc. 2003; 62(2): 319-328. Bee G. Dietary conjugated linoleic acids affect tissue
lipid composition but not de novo lipogenesis in finishing pigs. Anim Res. 2001; 50(5): 383-399. Canh TT, Aarnink AJA, Schutte JB, Sutton A,
Langhout DJ, Verstegen MWA. Dietary protein affects nitrogen excretion and ammonia emission from slurry of growing-finishing pigs. Livest Prod Sci. 1998(3); 56: 181-191.
Chaney AL, Marbach EP. Modified reagents for determination of urea and ammonia. Clinical Chem. 1962; 8(2): 130-132.
Corino C, Musella M, Pastorelli G, Rossi R, Paolone K, Costanza L, et al. Influences of dietary conjugated linoleic acid (CLA) and total lysine content on growth, carcass characteristics and meat quality of heavy pigs. Meat Sci. 2008; 79(2): 307-316.
Deng D, Li AK, Chu WY, Huang RL, Li RJ, Kong XF, et al. Growth performance and metabolic responses in barrows fed low-protein diets supplemented with essential amino acids. Livest Sci. 2007; 109(1-3): 224-227.
Dugan MER, Aalus JL, Lien KA, Schaefer AL, Kramer JKG. Effects of feeding different levels of conjugated linoleic acid and total oil to pigs on live animal performance and carcass composition. Can. J Anim Sci. 2001; 81(4): 505–510.
Figueroa JL, Cervantes M, Cuca JM, Méndez M. Respuesta de cerdos en crecimiento y finalización a dietas con baja proteína y energía. Agrociencia. 2004; 38: 383-394.
Figueroa JL, Lewis AJ, Miller PS, Fischer RL, Gómez RS, Diedrichsen RM. Nitrogen metabolism and growth performance of gilts fed standard corn-soybean meal diets or low-crude protein, amino acid-supplemented diets. J Anim Sci. 2002; 80(11): 2911-2919.
Figueroa JL, Martínez M, Trujillo JE, Zamora V, Cordero JL, Sánchez-Torres MT. Plasma urea nitrogen concentration and growth performance of finishing pigs fed sorghum-soybean meal, low-protein diets. J Appl Anim Res. 2008; 33: 7-12. Folch J, Lees M, and Stanley SGH. A Simple method
for the isolation and purification of total lipids from animal tissues. The J Biol Chem. 1957; 226: 497-509. Gómez RS, Lewis AJ, Miller PS, Chen HY,
Diedrichsen RM. Body composition and tissue accretion rates of barrows fed corn-soybean meal diets or low-protein, amino acid-supplemented diets at different feeding levels. J Anim Sci. 2002; 80(3): 654-662.
Hansen JA, Knabe DA, Burgoon KG. Amino acid supplementation of low-protein, sorghum-soybean meal diets for 5- to 20-kilogram swine. J Anim Sci. 1993; 71: 452-458.
Hayes ET, Leek ABG, Curran TP, Dodd VA, Carton OT, Beattie VE,et al. The influence of dietary crude protein level on odor and ammonia emissions from finishing pig houses. Biores Technol. 2004; 91: 309-315.
Heger J, Mengesha S, Vodehnal D. Effect of essential: total nitrogen ratio on protein utilization in the growing pig. Br J Nutr. 1998; 80: 537-544.
Jensen RG. The composition of bovine milk lipid: January 1995 to December 2000. J Dairy Sci. 2002; 85: 295-350.
Joo ST, Lee JI, Ha YL, Park GB. Effects of dietary conjugated linoleic acid on fatty acid composition, lipid oxidation, color, and water-holding capacity of pork loin. J Anim Sci. 2002; 80(1): 108-112.
Kerr BJ, Southern LL, Bidner TD, Friesen KG, Easter RA. Influence of dietary protein level, amino acid supplementation, and dietary energy levels on growing-finishing pig performance and carcass composition. J Anim Sci. 2003; 81: 3075-3087. King DA, Behrends JM, Jenschke BE, Rhoades RD,
Smith SB. Positional distribution of fatty acids in triacylglycerols from subcutaneous adipose tissue of pigs fed diets enriched with conjugated linoleic acid, corn oil, or beef tallow. Meat Sci. 2004; 67(4): 675-681.
Knowles TA, Southern LL, Bidner TD, Kerr BJ, Friesen KG. Effect of dietary fiber or fat in low-crude protein, crystalline amino acid-supplemented diets for finishing pigs. J Anim Sci. 1998; 76: 2818-2832.
Lauridsen C, Mu H, Henckel P. Influence of dietary conjugated linoleic acid (CLA) and age at slaughtering on performance, slaughter- and meat quality, lipoproteins, and tissue deposition of CLA in barrows. Meat Sci. 2005; 69(3): 393-399.
Le Bellego L, Noblet J. Performance and utilization of dietary energy and amino acids in piglets fed low protein diets. Livest Prod Sci. 2002; 76(1-2): 45-58. Le Bellego L, van Milgen J, Dubois S, Noblet J.
Energy utilization of low-protein diets in growing pigs. J Anim Sci. 2001; 79: 1259-1271.
Le Bellego L, van Milgen J, Noblet J. Effect of high temperature and low-protein diets on the performance of growing-finishing pigs. J Anim Sci. 2002; 80(3): 691-701.
Liu H, Allee GL, Berkemeyer JJ, Touchette KJ, Spencer JD, Kim IB. Effect of reducing protein level and adding amino acids on growth performance and carcass characteristics of finishing pigs. J Anim Sci. 1999; 77(Suppl. 1): 69 (Abstr.).
Martin D, Muriel E, Antequera T, Pérez-Palacios T, Ruiz J. Fatty acid composition and oxidative susceptibility of fresh loin and liver from pigs fed conjugated linoleic acid in combination with monounsaturated fatty acids. Food Chem. 2008b; 108: 86-96.
Martin D, Muriel E, González E, Viguera J, Ruiz J. Effect of dietary conjugated linoleic acid and monounsaturated fatty acids on productive, carcass and meat quality traits of pigs. Livest Sci. 2008a; 117(2-3): 155-164.
Martínez-Aispuro M, Figueroa-Velasco JL, Trujillo-Coutiño JE, Zamora-Zamora V, Cordero-Mora JL, Sánchez-Torres MT, et al. Respuesta productiva y concentración de urea en plasma de cerdos en crecimiento alimentados con dietas sorgo-pasta de soya con baja proteína. Vet Méx. 2009; 40: 27-38.
Migdal W, Pasciak P, Wojtysiak D, Barowicz T, Pieszka M, Pietras M. The effect of dietary CLA supplementation on meat and eating quality, and the histochemical profile of the m. longissimus dorsi from stress susceptible fatteners slaughtered at heavier weights. Meat Sci. 2004; 66(4): 863-870. NPPC: National Pork Producers Council. Procedures to
evaluate market hogs. 3rd ed. Des Moines, IA, USA: National Pork Producers Council; 1991.
NRC: National Research Council. Nutrient Requirements of Swine. 10th ed. Washington, DC, USA: National Academy Press; 1998.
Ostrowska E, Muralitharan M, Cross RF, Bauman DE, Dunshea FR. Dietary conjugated linoleic acids increase lean tissue and decrease fat deposition in growing pigs. J Nutr. 1999; 129: 2037-2042.
Pariza MW, Park Y, Cook EM. Mechanisms of action of conjugated linoleic acid: evidence and speculation. Proc Soc Exp Biol Med. 2000; 223: 8-13.
Park Y, Albright KJ, Storkson JM, Cook ME, Liu W, and Pariza MW. Changes in body composition in mice during feeding and withdrawal of conjugated linoleic acid. Lipids. 1999; 34: 243-248.
Park Y, Albright KJ, Storkson JM, Cook ME, Pariza MW. Effects of conjugated linoleic acid on body composition in mice. Lipids. 1997; 32: 853-858. Park Y, Pariza MW. Mechanisms of body fat
modulation by conjugated linoleic acid (CLA). Food Res Int. 2007; 40: 311-323.
Ramsay TG, Evock-Clover CM, Steele NC, Azain MJ. Dietary conjugated linoleic acid alters fatty acid composition of pig skeletal muscle and fat. J Anim Sci. 2001; 79(8): 2152-2161.
Roche HM, Noone E, Nugent A, Gibney MJ. Conjugated linoleic acid: a novel therapeutic nutrient? Nutr Res Rev. 2001; 14: 173-187.
SAS: Statistical Analysis System. The SAS system for windows V9. Cary, NC, USA: SAS Institute Inc.; 2002.
Schinckel AP, Eggert JM, Richert BT, Carroll AL. Effects of conjugated linoleic acid (CLA) supplementation on pig growth, pork quality and carcass composition in two genetic populations of gilts. Swine Day. Purdue University, West Lafayette, IN, USA; 2000: 51-53.
Schmid A, Collomb M, Sieber R, Bee G. Conjugated linoleic acid in meat and meat products: A review. Meat Sci. 2006; 73(1): 29-41.
Su TM, Liu CF, Wu SF, Liao V. Effect of dietary conjugated linoleic acid on the growth, carcass characteristics and meat fatty acid composition for TLRI Black Pig No.1. Symposium COA/INRA Scientific Cooperation in Agriculture, Tainan (Taiwan, R.O.C.), November 7-10; 2006. p. 87-90. Sun D, Zhu X, Qiao S, Fan S, Li D. Effects of
conjugated linoleic acid levels and feeding intervals on performance, carcass traits and fatty acid composition of finishing barrows. Arch Anim Nutr. 2004; 58: 277-286.
Teye GA, Sheard PR, Whittington FM, Nute GR, Stewart A, Wood JD. Influence of dietary oils and protein level on pork quality. 1. Effects on muscle fatty acid composition, carcass, meat and eating quality. Meat Sci. 2006; 73(1): 157-165.
Thiel-Cooper RL, Parrish Jr FC, Sparks JC, Wiegand BR, Ewan RC. Conjugated linoleic acid changes swine performance and carcass composition. J Anim Sci. 2001; 79(7): 1821-1828.
Trujillo-Coutiño JE, Figueroa-Velasco JL, Martínez-Aispuro M, Zamora-Zamora V, Cordero-Mora JL, Sánchez-Torres MT, et al. Concentración de urea en plasma y respuesta productiva de cerdos en iniciación alimentados con dietas sorgo-pasta de soya bajas en proteína. Agrociencia. 2007; 41: 597-607.
Tuitoek K, Young LG, de Lange CFM, Kerr BJ. The effect of reducing excess dietary amino acids on growing-finishing pig performance: an evaluation of the ideal protein concept. J Anim Sci. 1997a; 75(6): 1575-1583.
Wiegand BR, Parrish Jr FC, Swan JE, Larsen ST, Baas TJ. Conjugated linoleic acid improves feed efficiency, decreases subcutaneous fat, and improves certain aspects of meat quality in stress-genotype pigs. J Anim Sci. 2001; 79(8): 2187-2195.
Wiegand BR, Sparks JC, Parrish Jr FC, Zimmerman DR. Duration of feeding conjugated linoleic acid influences growth performance, carcass traits, and meat quality of finishing barrows. J Anim Sci. 2002; 80(3): 637-643.
Zervas S, Zijlstra RT. Effects of dietary protein and fermentable fiber on nitrogen excretion patterns and plasma urea in grower pigs. J Anim Sci. 2002; 80(12): 3247-3256.