Acta Scientiarum
http://www.uem.br/acta ISSN printed: 1806-2636 ISSN on-line: 1807-8672
Doi: 10.4025/actascianimsci.v37i3.27031
Tolerance of Nile tilapia juveniles to highly acidic rearing water
Vanessa Tomaz Rebouças, Francisco Roberto dos Santos Lima, Davi de Holanda Cavalcante and Marcelo Vinícius do Carmo e Sá*
Laboratório de Ciência e Tecnologia Aquícola, Departamento de Engenharia de Pesca, Centro de Ciências Agrárias, Universidade Federal do Ceará, Av. Mister Hull, s/n, 60356-000, Fortaleza, Ceará, Brazil. *Author for correspondence. E-mail: [email protected]
ABSTRACT. The present work aimed at determining the tolerance of Nile tilapia juveniles to highly acidic rearing waters and the effects of water acidity on the quality of tank effluents. The experimental design consisted of four treatments with different water pH values (4.12 ± 0.84; 5.13 ± 0.74; 6.14 ± 0.64 and 8.06 ± 0.48), with five replicates each. No exchange of water was performed throughout the study, only water replenishment to maintain the initial level. Variables of water quality, soil, growth performance, metabolism and effluents were monitored for eight weeks. Despite the lower total ammonia nitrogen (TAN) concentration in the pH 8 tanks, their levels of non-ionized ammonia (NH3) were the highest
ones. At the end, the lowest body weight of fish was observed in the pH 8 tanks. There was a significant improvement in feed conversion ratio (FCR) and protein efficiency ratio (PER) due to to water acidification. There were reduced concentrations of NH3 in the acidified tanks’ effluents. It was concluded
that the gradual water acidification up to pH 4 can improve the Nile tilapia juveniles’ growth performance.
Keywords: aquaculture, Oreochromis niloticus, acidophilic fish, ammonia, pH.
Tolerância de juvenis de tilápia do Nilo à acidez elevada da água de cultivo
RESUMO. O presente trabalho teve por objetivo determinar a tolerância de juvenis de tilápia do Nilo à acidez elevada da água de cultivo e os efeitos da acidificação da água de cultivo na qualidade dos efluentes dos tanques. O delineamento experimental foi constituído por quatro tratamentos, águas de cultivo com diferentes valores de pH (4,12 ± 0,84; 5,13 ± 0,74; 6,14 ± 0,64 e 8,06 ± 0,48), com cinco repetições cada. Não houve troca da água de cultivo, apenas reposição para manter o nível inicial. Durante oito semanas, foram observadas variáveis de qualidade de água, solo, zootécnicas, metabólicas e efluentes. Embora a concentração de nitrogênio amoniacal total (NAT) na água tenha sido menor nos tanques pH8, sua concentração de amônia não-ionizada (NH3) foi maior que nos demais. Ao final, o menor peso corporal
dos peixes foi observado nos tanques pH8. Houve significativa melhora nos resultados de conversão alimentar e na taxa de eficiência proteica com a acidificação do pH da água. As concentrações de NH3 nos
efluentes dos tanques acidificados foram reduzidas. Concluiu-se que a acidificação gradual da água de cultivo de juvenis da tilápia do Nilo até pH 4 é benéfica ao crescimento corporal dos peixes.
Palavras-chave: aquicultura, Oreochromis niloticus, peixe acidófilo, amônia, pH.
Introduction
The animal physiology works within certain species-specific environmental conditions. The water pH variations that deviate from the ideal range for the species may affect fish survival and performance (White et al., 2014). Fish try to adapt its behavior and physiology when subjected to stressful pH conditions. Some groups of fish exhibit greater body growth in waters with pH values away from neutrality. These species of fish adapted to live in acidic (Duarte et al., 2013)et al., and alkaline (Saha et al., 2002) waters are called acidophilic and basophilic, respectively.
The pirapitinga, Piaractus brachypomus, for instance, has greater resistance to stressful pH values
when the dietary level of crude protein is high (Garcia et al., 2014). The walking catfish, Clarias
batrachus, can survive in very alkaline waters, with
pH up to 10. In that species, the stimulation of ureogenesis is a major physiological strategy for survival in alkaline waters (Saha et al., 2002).
The Mozambique tilapia, Oreochromis
mossambicus, has some mechanisms for adaptation to
acidic waters. Under acidity, that fish species increases the release of α-melanophore stimulating hormone that darkens the skin of the animal, changing its pattern of ionic regulation. This adjustment is usually successful if the pHreduction is slow (Van der Salm et al., 2005). The tambaqui,
acidic waters, and is negatively affected by waters with pH above 8. Hematological changes, ionic regulations and mucus production are some of the adaptations of tambaqui to life in an acidic medium (Aride et al., 2007).
Although freshwater fish can adapt to stressful water pH, the farming of those animals should be conducted in their optimal environmental conditions to prevent metabolic stress. According to El-Sherif and El-Feky (2009), the optimal range of water pH for rearing Nile tilapia, Oreochromis
niloticus, is between 7 and 8. However, recent data
obtained in our laboratory by Nobre et al. (2014) suggest that the optimal range of water pH for farming Nile tilapia juveniles in green waters is wider than that reported by El-Sherif & El-Feky (2009), ranging from 5 to 8. The Nile tilapia, therefore, adapts and grows well in moderately acidic waters (Nobre et al., 2014). In that work, however, the growth performance of tilapia was not evaluated under stronger water acidity (pH< 5).
This study aimed to determine the tolerance of Nile tilapia juveniles to high acidity waters in an eutrophic culture tanks, based on variables of water and soil quality; and growth and metabolic performance. In addition, we determined the effects of water acidification on the quality of tank effluents.
Material and methods
The experiment was conducted in a green water rearing system in tanks without mechanical aeration at the Laboratório de Ciência e Tecnologia Aquícola - LCTA (Departamento de Engenharia de Pesca, Centro de Ciências Agrárias, Universidade Federal do Ceará), located at Fortaleza, Ceará State, Brazil (03°44'39,9"S; 38°34'55,9"W). Masculinized juvenile Nile tilapia, weighing between 1-2 g, were purchased from a fish farmer of the region and transported to the laboratory. At the LCTA, fish initially remained for four days in a 1,000-L circular tank for acclimation to the experimental conditions of 1 fish L-1. During this period, a balanced
commercial diet for omnivorous tropical fish was given at 8, 11, 14 and 17h, containing 39.4% crude protein, at 10% of the stocked biomass.
At the onset, eight tilapia juveniles (body weight = 1.61 ± 0.06 g) were stocked in 250-L circular polyethylene tanks, where they remained for eight weeks. Fish feed was delivered daily at 10, 13, 15 and 17h. The feeding rates started with 7.9% body weight with a crumbled diet, and finished with 3.7% with a pelleted diet (0.8 to 1.2 mm). There were four treatments with five replicates each, totaling
twenty experimental tanks. In the control group, no management of water quality was carried out, allowing the water pH vary freely over the experiment. In each of the other tanks, a daily water acidification with a 3.6 N HCl solution was performed, varying the volume of acidic solution according to the treatment. The application of the acidic solutions was discontinued when the desired values of water pH were reached. The tanks of the first treatment received applications of the HCl solution to achieve a water pH between 5.5 and 6.5; the tanks of the second treatment received applications of the HCl solution to achieve a water pH between 4.5 and 5.5; finally, the tanks of the third treatment received the acidic solution to achieve a water pH between 3.5 and 4.5. The pH readings (mPA210 - Tecnopon MS pH meter) were performed daily in the morning (7h30min) and afternoon (15h). The daily water pH was calculated averaging those two records. The daily total HCl dose was divided into three equal sub doses starting at 8h with a 30 minutes break between them. Over the entire experiment, no water exchange was performed in the tanks, only replenishment to maintain the initial volume. The bottom of the tanks was covered with a 5-cm layer of gross sand.
Variables of water quality, soil quality, growth performance and metabolic performance were analyzed. The pH of water was measured daily, while the temperature and the electrical conductivity of water (CD-850 conductivimeter) were determined twice a week, in the morning and in the afternoon, at 8h and 15h. Weekly, the concentrations of nitrite (sulfanilamide method) and total ammonia nitrogen (TAN, indophenol method) were determined. The NH3 concentrations were
calculated by the use of the NAT, pH and water temperature results, obtained at 15h, in the Emerson’s Formula (El-Shafai et al., 2004).
Fortnightly, it was determined the concentrations of dissolved oxygen (DO2; YSI-55
oximeter), free CO2 (Na2CO3 standard solution
titration), total alkalinity (H2SO4 standard solution
titration), total hardness (EDTA standard solution titration), dissolved iron (Herapath method), reactive phosphorus (molybdenum blue method), nitrate (reducing cadmium column), organic matter (oxygen consumed), total dissolved sulfides (TDS; Na2S2O3 standard solution titration) and hydrogen
sulfide. The H2S concentration was obtained by
Tilapia in pH-4 waters 229
soil pH and the tank soil organic carbon (K2Cr2O7
digestion and FeSO4 standard solution titration)
were determined at the beginning, middle and end of the experiment (Boyd, 2000).
The variables of growth performance analyzed were the following: final body weight, weekly weight gain, specific growth rate (SGR = [Ln (final weight) - Ln (initial weight)] /days of rearing) x 100, fish yield (g m-3 day-1), feed conversion ratio (FCR = feed
allowed/body weight gain) and protein efficiency ratio (PER = fish weight gain/dietary protein allowed). The crude protein content of the diets was determined in laboratory (Laboratório de Nutrição Animal, Departamento de Zootecnia, UFC), by the micro Kjeldahl method.
The metabolic performance of fish was observed by using four 2.5-L respirometers, sealed with lids and composed of PET containers, as proposed by Barbieri et al. (2005). The consumption of dissolved oxygen after 4h by one fish placed inside the respirometer was measured weekly, beginning at the third experimental week (one fish per respirometer). Initially, the water used in each respirometer was taken from the rearing tanks, and filtered through filter paper. Fish that would be used were maintained in a separate tank with non-acidified water. Previously to fish allocation, mechanical aeration was provided to the respirometers for one hour. Afterwards, the initial concentrations of DO2
were measured and the juveniles were placed inside their respective chambers. After a 4-h period, the final concentrations of DO2 were determined in
each respirometer by the Winkler’s method with azide modification. The consumption of DO2 inside
the respirometer (μg L-1 DO
2 g-1 fish h-1) was
estimated by the following equation: [(DO2i –
DO2f)/fish body weight (g)]/ test duration (h),
where DO2i = initial concentration of DO2 in the
respirometer, and DO2f = final concentration of
DO2 in the respirometer.
Statistical analyses of water quality, soil quality, growth and metabolic performances were made through the one-way ANOVA, using a significance
level of 5%. In the case of significant differences between treatments, the means were compared by the Tukey’s test. Prior to analysis, the results were tested for normal distribution (Shapiro-Wilk’s test) and for homogeneity of variance (Levene’s test). The statistical analyses were run with the softwares BioStat 5.0 and Excel 2010.
Results and discussion
Water and soil quality
The pH of the rearing waters differed significantly between the treatments (Figure 1). Tanks with no HCl application showed the highest pH value (pH = 8.06 ± 0.48). Tanks that received the HCl solution at different doses exhibited the following pH values: 4.12 ± 0.84 (30 mL 3.6 N HCl solution/tank); 5.13 ± 0.74 (21 mL HCl solution 3.6 N/tank) and 6.14 ± 0.64 (15 mL HCLl solution 3.6 N/tank). Hereafter, those values of water pH will be represented as pH 8, pH 4, pH 5 and pH 6, respectively.
Figure 1. Water pH of outdoor tanks containing juvenile Nile tilapia for 8 rearing weeks (mean ± SD; n = 5).
As expected, water acidification reduced significantly the total alkalinity of water (Table 1). The total hardness of pH-8 tanks was lower than that found in the pH-4 tanks (p < 0.05; Table 1). The higher concentrations of free CO2 in the pH-4
tanks probably favored the dissolution of calcium carbonate present in the tank soil that raised the hardness of water. The pH-8 tanks had the lowest concentrations of free CO2.
Table 1. Total alkalinity, total hardness, electrical conductivity, dissolved oxygen, free carbon dioxide and organic matter in 250-L outdoor tanks stocked with juvenile Nile tilapia, Oreochromis niloticus (body weight = 1.61 ± 0.06 g) under different pH values (mean ± SD; n = 5).
Variable Water pH
1
p value 4 5 6 8 Total alkalinity (mg L-1
eq. CaCO3) 4.92 ± 1.36 b 2
6.77 ± 1.84 b 9.13 ± 1.59 b 74.72 ± 13.25 a < 0.001 Total hardness (mg L-1 eq. CaCO
3) 111.8 ± 16.4 a
3 100.3 ± 19.4 ab 108.8 ± 20.0 a 92.1 ± 20.8 b 0.012 Electrical conductivity4 (μS cm-1) 481 ± 72 403 ± 84 445 ± 134 406 ± 101 ns Dissolved oxygen (mg L-1
) 4.82 ± 1.26 4.91 ± 1.60 4.23 ± 1.50 4.03 ± 1.30 ns Free carbon dioxide (mg L-1) 18.27 ± 2.49 a 12.86 ± 2.30 b 12.02 ± 2.41 b 10.21 ± 2.94 c < 0.001 Organic matter (mg L-1
) 153.0 ± 16.6 161.9 ± 20.7 154.9 ± 17.7 162.4 ± 28.2 ns 1pH 4: water pH = 4.12 ± 0.84; pH 5: water pH = 5.13 ± 0.74; pH 6: water pH = 6.14 ± 0.64; pH 8: water pH = 8.06 ± 0.48 (mean ± SD.; n = 5); 2For each variable, means in the same row followed by different lowercase letters are significantly different according to Tukey’s test (p < 0.05); absence of letters indicates non-significant differences (p > 0.05); 3Non-significant (p > 0.05); 4Average of morning and evening readings.
a
b c
The electrical conductivity (EC) of the water was not significantly different between the tanks (Table 1). Likewise, the concentrations of DO2 were not
significantly different between the experimental tanks. This indicates that the artificial acidification of water did not impair the photosynthesis in rearing tanks. A CO2 increase in the water can promote phytoplankton
growth due to increased availability of nutrients and thus change the composition of phytoplankton communities. In that context, there can be an increased frequency of green algae (Low-Décarie et al., 2014). That assumption is supported by the results of organic matter (Table 1), which were not different between the experimental treatments (p > 0.05).
At the end of the experimental period, the concentrations of total ammonia nitrogen (TAN) in the pH-4, pH-5 and pH-6 tanks were significantly higher than those observed in pH-8 tanks (Figure 2). The TAN concentrations in pH-8 tanks remained low throughout the experiment, except for a peak of 0.97 mg L-1 in the 3rd week.
The main source of TAN in fish tanks is the ammonification of organic matter (animal feces, unconsumed feed and dead plankton). As the amount of feed supplied to the tanks varied with the fish biomass, and because of the lower fish biomass in the pH-8 tanks, the input of artificial diet to those tanks was lower when compared to the others, thus explaining the lower concentrations of TAN. Garcia et al. (2013) reported that both ammonia and nitrite tend to accumulate in Nile tilapia cages with higher stocking densities. On the other hand, NH3
concentrations were higher in pH-8 tanks compared to the others (p<0.05). The highest NH3 concentration (0.12 ± 0.04 mg L-1) was
found at the 3rd experimental week in the pH-8
tanks. The TAN is composed by the ammonium ion (NH4 +) and non-ionized ammonia (NH3). A
shift between NH4+ and NH3 that favors more
NH3 occurs at high pH values. The NH3 is the
toxic form of TAN to aquatic animals (Pereira & Mercante, 2005). Lower values of TAN and pH
(pH<8) are the ideal conditions for efficient excretion of NH3 by fish. Under those
conditions, there is a fast diffusion of NH3 from
fish blood to the water (Silva et al., 2013).
The concentrations of nitrite and nitrate in water were low and not significantly different between the experimental tanks (Table 2). Low values of nitrite were probably related to the high nitrification rate happening in the rearing tanks. The nitrification process comprises the oxidation of ammonia to nitrite (NO2-) and that to nitrate (NO3-). Different
groups of microorganisms catalyze each of those steps (Füssel et al., 2012). Low nitrate in water is probably related to the high algal productivity observed in the tanks. Phytoplankton absorb nitrate from water for their growth (Masclaux et al., 2015).
Figure 2. Total ammonia nitrogen (TAN) and non-ionized ammonia (NH3) of water for rearing of juvenile Nile tilapia for
eight weeks in 250-L outdoor tanks, subjected to different pH values. Lines with different letters indicate significantly different means in the last observation by Tukey’s test (p < 0.05).
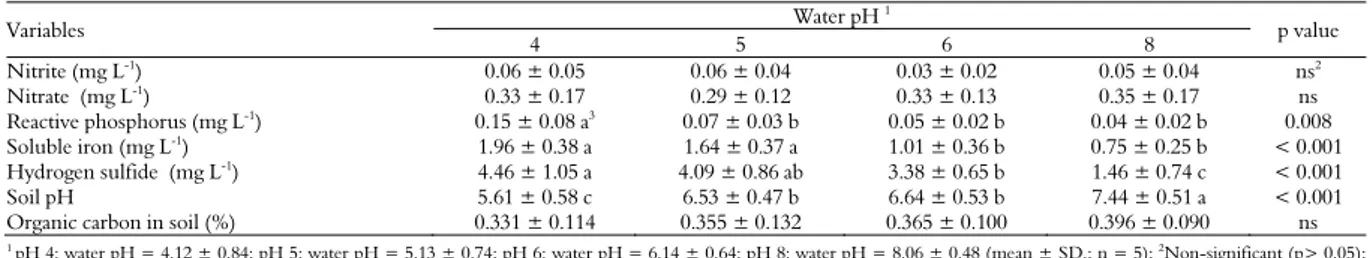
The highest concentrations of reactive phosphorus were observed in the pH-4 tanks (Table 2; p < 0.05). The concentrations of reactive phosphorus in the other tanks (pH 5, pH 6 and pH 8) were not significantly different to each other. Similarly, the highest concentrations of soluble iron were observed in the pH-4 and pH-5 tanks (p <0.05). Under acidic conditions, it may occur internal fertilization of water, in which phosphates are released from sediments to the water column (Falagán et al., 2014).
Table 2. Nitrite, nitrate, reactive phosphorus, dissolved iron, hydrogen sulfide and soil quality of 250-L outdoor tanks stocked with juvenile Nile tilapia (body weight = 1.61 ± 0.06 g ), subjected to different pH values (mean ± SD; n = 5).
Variables Water pH
1
p value 4 5 6 8 Nitrite (mg L-1
Tilapia in pH-4 waters 231
There was a pronounced H2S increase in the water as the pH decreased. With the pH reduction, the formation of H2S was favored
through the following reaction: H2S ↔ H+ + HS
-. Another possibility for the presence of H2S in
the water is the occurrence of sulfate reduction (Koschorreck et al., 2003). As there was no loss in performance of tilapia stocked in the pH-4 tanks, it is inferred that O. niloticus is quite tolerant to high concentrations of H2S in water as the Poecilia
mexicana, a freshwater fish species (Tobler et al.,
2014).
The pH of soil in the pH-8 tanks was higher than in the pH-4 tanks (Table 2; p < 0.05). The differences in concentrations of organic carbon of tank soils were not significantly different between the treatments. Over time, the water column and the sediments tend to reach a chemical-physical balance (Queiroz et al., 2004).
Growth performance
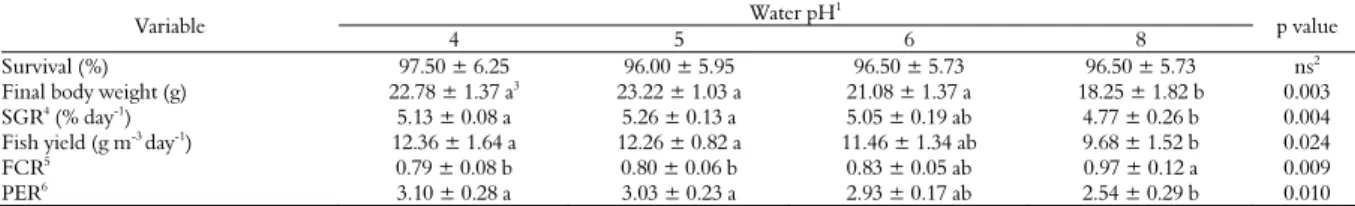
There were no significant differences for the survival of fish stocked in the different experimental tanks. Overall, they exceeded 95% (Table 3). This evidences the strength of tilapia, which are able to tolerate water acidity as low as pH = 4. Wangead et al. (1988) observed that juvenile and adult tilapias did not survive when subjected to pH 2 and 3 waters. These same authors, at the same time, reported survival rates of 57.8; 82.2; 84.5% for juvenile tilapia maintained in water pH 4, 5 and 7, respectively. The survival rates for the same pH values were equal to 86.6; 100 and 100%, respectively, for adult tilapias.
Fish final weight in the pH-8 tanks was significantly lower than that observed in the other tanks (pH 4, pH 5 and pH 6; Table 3). That result points out that the water acidification carried out was beneficial to tilapia growth. This may be associated with the lower concentrations of NH3
in the more acidic tanks (Figure 2). Sakala and Musuka (2014) observed that high concentrations
of ammonia affected both the growth and survival
of Tilapia rendalli. Similarly, the lowest results for
specific growth rate values (SGR) and fish yield were observed in the pH-8 tanks (p < 0.05). Therefore, the results obtained in the present study suggest that Nile tilapia juveniles present similar growth performance when reared in waters with pH 4, 5 or 6.
The water pH reduction significantly improved the feed conversion ratio (FCR; Table 3). Similarly, the protein efficiency ratio (PER) increased with reducing water pH. The best FCR and PER results were obtained in the pH-4 tanks. Those results suggest that Nile tilapia juveniles tolerate waters with strong acidity, having a pH around 4. If future works confirm such suggestion, O. niloticus could be reclassified as an acidophilus species of freshwater fish. Supporting that argument, Wangead et al. (1988) concluded that O. niloticus has the ability to adapt itself well to pH-4 waters. The same authors, however, argued that O. niloticus does not support waters with higher acidity (pH<4). Likewise, the tambaqui, C. macropomum, shows better growth performance when reared in acidic waters (pH 4 - 6; Aride et al. (2007)).
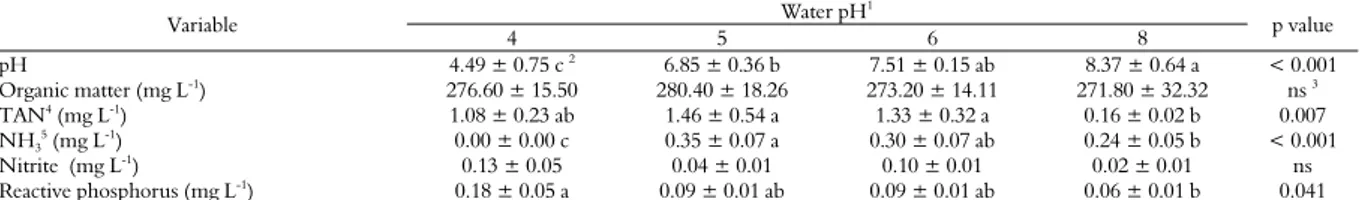
Effluent quality
The tank effluents’ pH followed the same trend of the rearing waters’ pH. Hence, there was a progressive lowering in the effluent pH through the artificial water acidification carried out in the present work (Table 4). Therefore, if water acidification is performed to achieve a better growth performance, it is important to correct the effluents’ pH before discharging them into the environment. One known method to lower the pH of the rearing water is to apply ammonium fertilizers to the water (Tsadilas et al., 2005). According to the CONAMA’s Resolution n. 430, the effluents from any pollution sources can only be discharged directly into the receiving water bodies if they have a pH between 5 and 9.
Table 3. Growth performance of juvenile Nile tilapia (body weight = 1.61 ± 0.06 g) stocked in 250-L outdoor tanks foreight weeks and subjected to different pH values (mean ± SD; n = 5).
Variable Water pH
1
p value 4 5 6 8 Survival (%) 97.50 ± 6.25 96.00 ± 5.95 96.50 ± 5.73 96.50 ± 5.73 ns2 Final body weight (g) 22.78 ± 1.37 a3 23.22 ± 1.03 a 21.08 ± 1.37 a 18.25 ± 1.82 b 0.003 SGR4
(% day-1
Table 4. Effluent quality of Nile tilapia’s tanks one week after harvest.
Variable Water pH
1
p value 4 5 6 8 pH 4.49 ± 0.75 c 2 6.85 ± 0.36 b 7.51 ± 0.15 ab 8.37 ± 0.64 a < 0.001 Organic matter (mg L-1
) 276.60 ± 15.50 280.40 ± 18.26 273.20 ± 14.11 271.80 ± 32.32 ns 3 TAN4 (mg L-1) 1.08 ± 0.23 ab 1.46 ± 0.54 a 1.33 ± 0.32 a 0.16 ± 0.02 b 0.007 NH35 (mg L-1) 0.00 ± 0.00 c 0.35 ± 0.07 a 0.30 ± 0.07 ab 0.24 ± 0.05 b < 0.001 Nitrite (mg L-1) 0.13 ± 0.05 0.04 ± 0.01 0.10 ± 0.01 0.02 ± 0.01 ns Reactive phosphorus (mg L-1) 0.18 ± 0.05 a 0.09 ± 0.01 ab 0.09 ± 0.01 ab 0.06 ± 0.01 b 0.041 1pH 4: water pH = 4.12 ± 0.84; pH 5: water pH = 5.13 ± 0.74; pH 6: water pH = 6.14 ± 0.64; pH 8: water pH = 8.06 ± 0.48 (mean ± SD.; n = 5); 2For each variable, means in the same row with different lowercase letters are significantly different by Tukey’s test (p < 0.05); absence of letters indicates non-significant difference (p > 0.05); 3Non-significant (p > 0.05); 4Total ammonia nitrogen; 5Unionized ammonia.
The concentrations of organic matter in the effluents were not significantly different between the treatments (p>0.05; Table 4). Although high TAN concentrations were observed in the acidic tanks’ effluents, their levels of NH3 were
significantly low or even zero. However, there will be an increase in the NH3 levels when the
effluent pH values are corrected upwards. For that, the effluent should be aerated in the treatment basin for ammonia removal by nitrification and volatilization after the pH correction. The nitrite concentrations in the tank effluents were not different between the treatments. On the other hand, higher concentrations of reactive phosphorus were found in the pH-4 tanks. The use of aquatic macrophytes, such as Eichhornia crassipes and
Lemnaceae minor, can be used to remove phosphate
from the wastewater (Shilton et al., 2012). Therefore, while the water acidification can improve tilapia growth performance, it causes at the same time environmental problems that should be considered by the responsible farmer.
Metabolic performance
The DO2 consumption rates by fish inside the
respirometers were not significantly different between the treatments (p>0.05; Figure 3). In the second week of observation, fish of all treatments showed a rise in the DO2 consumption inside the
respirometers. Afterward, fish of the pH 6 and pH 8 treatments showed a decline in DO2
consumption. A DO2 reduction was also
registered for all treatments in the fourth monitoring week.
The results of the fourth week (Figure 3), along with the downward trend in the DO2
consumption observed throughout the study, suggest that a better adaptation to acidic conditions is achieved when fish has a greater body weight. The relationship between the metabolic rate and the body size of fish varies according to intrinsic and extrinsic factors, such as the animal physiology and environmental conditions, respectively (Urbina & Glover, 2013).
Figure 3. Consumption of dissolved oxygen by juvenile tilapia after four hours inside respirometers. pH 4: water pH = 4.12 ± 0.84; pH 5: water pH = 5.13 ± 0.74; pH 6: water pH = 6.14 ± 0.64; pH 8: water pH = 8.06 ± 0.48 (mean ± SD.; n = 5). Differences between the treatments were not significant (ANOVA p > 0.05).
Conclusion
Juvenile O. niloticus is a fish species tolerant to high concentrations of H2S in water (up to 4.4 mg L-1).
Besides, a gradual acidification of water to pH 4 is advantageous to its growth performance. However, the management of water acidification deteriorates the quality of the effluents from the rearing tanks.
References
APHA. (1999). Standard methods for the examination of water and wastewater (Vol. 20): American Public Health Association.
Aride, P. H. R., Roubach, R. & Val, A. L. (2007). Tolerance response of tambaqui Colossoma macropomum (Cuvier) to water pH. Aquaculture Research, 38(6), 588-594. Barbieri, E., Passos, E. A. & Garcia, C. A. B. (2005). Use
of metabolism to evaluate the sublethal toxicity of mercury on Farfantepaneus brasiliensis larvae (Latreille 1817, Crustacean). Journal of Shellfish Research, 24(4), 1229-1233.
Boyd, C. E. (2000). Water quality: an introduction: Springer Science & Business Media.
Tilapia in pH-4 waters 233
El-Shafai, S. A., El-Gohary, F. A., Nasr, F. A., van der Steen, N. P. & Gijzen, H. J. (2004). Chronic ammonia toxicity to duckweed-fed tilapia (Oreochromis niloticus). Aquaculture, 232(1), 117-127.
El-Sherif, M. S. & El-Feky, A. M. I. (2009). Performance of Nile tilapia (Oreochromis niloticus) fingerlings. I. Effect of pH. International Journal of Agriculture & Biology, 11, 297-300.
Falagán, C., Sánchez-España, J. & Johnson, D. B. (2014). New insights into the biogeochemistry of extremely acidic environments revealed by a combined cultivation-based and culture-independent study of two stratified pit lakes. FEMS Microbiology Ecology, 87(1), 231-243.
Füssel, J., Lam, P., Lavik, G., Jensen, M. M., Holtappels, M., Günter, M. & Kuypers, M. M. (2012). Nitrite oxidation in the Namibian oxygen minimum zone. The ISME journal, 6(6), 1200-1209.
Garcia, F., Romera, D. M., Gozi, K. S., Onaka, E. M., Fonseca, F. S., Schalch, S. H., ... Carneiro, D. J. (2013). Stocking density of Nile tilapia in cages placed in a hydroelectric reservoir. Aquaculture, 410, 51-56. Garcia, L. O., Gutiérrez-Espinosa, M., Wásquez-Torres,
W. & Baldisserotto, B. (2014). Dietary protein levels in Piaractus brachypomus submitted to extremely acidic or alkaline pH. Ciencia Rural, 44(2), 301-306.
Koschorreck, M., Wendt-Potthoff, K. & Geller, W. (2003). Microbial sulfate reduction at low pH in sediments of an acidic lake in Argentina. Environmental Science & Technology, 37(6), 1159-1162.
Low-Décarie, E., Bell, G. & Fussmann, G. F. (2014). CO2 alters community composition and response to nutrient enrichment of freshwater phytoplankton. Oecologia, 177(3), 1-9.
Masclaux, H., Tortajada, S., Philippine, O., Robin, F.-X. & Dupuy, C. (2015). Planktonic food web structure and dynamic in freshwater marshes after a lock closing in early spring. Aquatic Sciences, 77(1), 115-128. Nobre, M. K. B., Lima, F. R. S. & Magalhães, F. B.
(2014). Alternative liming blends for fish culture. Acta Scientiarum. Animal Sciences, 36(1), 11-16.
Pereira, L. P. F. & Mercante, C. T. J. (2005). A amônia nos sistemas de criação de peixes e seus efeitos sobre a qualidade da água. Uma revisão. Boletim do Instituto de Pesca, 31(1), 81-88.
Queiroz, J. F., Nicolella, G., Wood, C. W. & Boyd, C. E. (2004). Lime application methods, water and bottom soil acidity in fresh water fish ponds. Scientia Agricola, 61(5), 469-475.
Saha, N., Kharbuli, Z. Y., Bhattacharjee, A., Goswami, C. & Häussinger, D. (2002). Effect of alkalinity (pH 10) on ureogenesis in the air-breathing walking catfish, Clarias batrachus. Comparative Biochemistry and
Physiology Part A: Molecular & Integrative Physiology, 132(2), 353-364.
Sakala, M. E. & Musuka, C. G. (2014). The Effect of ammonia on growth and survival rate of Tilapia rendalli in quail manured tanks. International Journal of Aquaculture, 4(22), p. 1-6.
Shilton, A. N., Powell, N. & Guieysse, B. (2012). Plant based phosphorus recovery from wastewater via algae and macrophytes. Current Opinion in Biotechnology, 23(6), 884-889.
Silva, F. J. R., Santos Lima, F. R., Vale, D. A. & Carmo, M. V. (2013). High levels of total ammonia nitrogen as NH 4+ are stressful and harmful to the growth of Nile tilapia juveniles. Acta Scientiarum. Biological Sciences, 35(4), 475-481.
Tobler, M., Henpita, C., Bassett, B., Kelley, J. L. & Shaw, J. H. (2014). H 2 S exposure elicits differential expression of candidate genes in fish adapted to sulfidic and non-sulfidic environments. Comparative Biochemistry and Physiology Part A: Molecular & Integrative Physiology, 175, 7-14.
Tsadilas, C., Karaivazoglou, N., Tsotsolis, N., Stamatiadis, S. & Samaras, V. (2005). Cadmium uptake by tobacco as affected by liming, N form, and year of cultivation. Environmental Pollution, 134(2), 239-246.
Urbina, M. A. & Glover, C. N. (2013). Relationship between fish size and metabolic rate in the oxyconforming inanga Galaxias maculatus reveals size-dependent strategies to withstand hypoxia. Physiological and Biochemical Zoology, 86(6), 740-749.
Van der Salm, A., Spanings, F., Gresnigt, R., Bonga, S. W. & Flik, G. (2005). Background adaptation and water acidification affect pigmentation and stress physiology of tilapia, Oreochromis mossambicus. General and Comparative Endocrinology, 144(1), 51-59.
Wangead, C., Geater, A. & Tansakul, R. (1988). Effects of acid water on survival and growth rate of Nile tilapia (Oreochromis niloticus). Paper presented at the The Second International Symposium on Tilapia in Aquaculture.
White, R. S., McHugh, P. A., Glover, C. N. & McIntosh, A. R. (2014). Multiple environmental stressors increase the realised niche breadth of a forest-dwelling fish. Ecography, 38(2), 154-162.
Received on March 17, 2015. Accepted on May 4, 2015.