Homage to Carlos Eduardo de Mattos Bicudo
Acta Limnologica Brasiliensia, 2018, vol. 30, e213 https://doi.org/10.1590/S2179-975X7917 ISSN 2179-975X on-line versionThis is an Open Access article distributed under the terms of the Creative Commons Attribution License, which permits unrestricted use, distribution, and reproduction in any medium, provided the original work is properly cited.
Changes in the structure of the phytoplankton community in a
Nile tilapia fishpond
Mudanças na estrutura da comunidade fitoplanctônica em viveiro de tilápia-do-Nilo
João Alexandre Saviolo Osti1,2*, Andréa Tucci2 and Antonio Fernando Monteiro Camargo1,3
1 Programa de Pós-graduação em Aquicultura, Centro de Aquicultura da UNESP – CAUNESP, Universidade Estadual Paulista – UNESP, Via de Acesso Prof. Paulo Donato Castellane, s/n, CEP 14884-900, Jaboticabal, SP, Brasil
2 Núcleo de Pesquisa em Ficologia, Instituto de Botânica de São Paulo, Av. Miguel Stéfano, 3687, CEP 04301-902, São Paulo, SP, Brasil
3 Laboratório de Ecologia Aquática – LEA, Departamento de Ecologia, Instituto de Biociências, Universidade Estadual Paulista – UNESP, Av. 24-A, 1515, CEP 13506-900, Rio Claro, SP, Brasil *e-mail: [email protected].
Cite as: Osti, J.A.S., Tucci, A., and Camargo, A.F.M. Changes in the structure of the phytoplankton community in a Nile tilapia fishpond. Acta Limnologica Brasiliensia, 2018, vol. 30, e213.
Abstract: Aim: Our objectives were to recognize species that can serve as biological descriptors and evaluate the changes in the phytoplankton community throughout the grow-out period of the Nile tilapia (Oreochromis niloticus Linnaeus 1758) related to management practices and to limnological variables. Methods: Samples from the inflow water and the fishpond were collected for the analysis of limnological variables and the structure of the phytoplankton community. Results: In the fishpond, we registered a 1.5 times increase in nitrogen and total suspended solids and a 2 times increase in phosphorous compared to the inflow water. During the grow-out period (113 days), 134 taxa belonging to 10 taxonomic classes were registered. Chlorophyceae (60 taxa) and Cyanobacteria (26 taxa) showed the greatest diversity and abundance of species. The largest biovolumes were recorded in the fishpond. Nanoplanktonic species were the most abundant and represented 35% of the descriptor species in the phytoplankton community of the fishpond. Conclusions: The instability of the system associated with the control of the hydraulic retention time as a consequence of management practices, favored the presence of species with small cellular dimensions. The decrease in air and water temperature registered at the end of the grow-out period probably favored the increase and persistence of diatoms.
Keywords: descriptor species; ecology of fishponds; microalgae; nutrient cycle.
Different conditions and factors, such as the existing inoculum, species growth rate, perennial mechanisms, and the ability of sustaining processes of biomass loss, as well as nutrient availability, water temperature, luminosity, hydraulic flow, sedimentation and herbivory, might be responsible for the increase in algal density (Margalef, 1978; Padisák, 1997; Bouvy et al., 2000; Beisner et al., 2006; Fernandes et al., 2009). This set of conditions will determine which species will occur at a given time and place and should be considered and evaluated for the understanding of changes in the phytoplankton structure in fishponds. However, the dynamics of fishponds is strongly influenced by the management practices (the type of organism produced, production method, quantity and quality of feed used, quality of inflow water, hydraulic retention time, among others) that might favor distinct phytoplanktonic groups. Consequently, the use of phytoplankton descriptor species can help to recognize which ecological groups will be established first and which ones may remain in the environment, due to both the morphological characteristics of the organisms and their biological requirements associated with the dynamics of limnological variables.
The aims of this study were to 1) determine the descriptor species of the phytoplanktonic community in a fishpond of Nile tilapia (Oreochromis niloticus); and 2) to evaluate the temporal changes in the structure of the phytoplankton community associated with management practices and limnological variables during the grow-out period of Nile tilapia, through the analysis of descriptor species. We expect that the inoculum of varied
1. Introduction
Fish farming is an economic sector in global expansion due to the capacity of producing healthy and nutritionally rich food that represents a primary protein source in many countries. Like any other activity related to agricultural production, however, if not well managed it may lead to environmental and financial damages (Gorlach-Lira et al., 2013; FAO, 2016).
In aquaculture, artificial diets with a high nutrient content are commonly used for cultivated fish species. However, only 25% to 40% of the nitrogen and phosphorus of the diet is converted into fish biomass (Chatvijitkul et al., 2017; David et al., 2017a, b; Osti et al., 2018). The diet portion that is not consumed turns into ammonium, nitrate, phosphates, carbon dioxide and organic suspended solids (Montoya et al., 2000), which can cause the rapid growth of the algal community favoring blooms, especially of cyanobacteria (Paerl & Tucker, 1995; Beyruth et al., 2004; Sant’Anna et al., 2006; Boyd, 2016). As a consequence of blooms, fish mortality and a decrease in fish productive performance and profitability might occur (Mercante et al., 2007; Boyd, 2016). On the other hand, phytoplankton is of fundamental importance for the maintenance of water quality for fish culture, because it interferes directly in the production and dynamics of gases in the fishpond through photosynthesis and respiration processes (Mercante et al., 2011; Brraich & Saini, 2015). It is also a secondary food source for the main fish species produced in Brazil, such as tilapia (Beyruth et al., 2004; Turker et al., 2003a, b; FAO, 2016).
Resumo: Objetivo: O presente artigo visa avaliar quais as espécies podem ser descritores biológicos e avaliar as mudanças na comunidade fitoplanctônica durante a etapa final de crescimento de tilápia-do-Nilo (Oreochromis niloticus Linnaeus 1758), relacionando com o manejo de produção e com as variáveis limnológicas. Métodos: Amostras da água de abastecimento e do centro do viveiro foram utilizadas para as análises limnológicas e para avaliar estrutura da comunidade fitoplanctônica. Resultados: No viveiro de piscicultura, registramos aumento de 1.5 vezes nas concentrações de nitrogênio e sólidos totais suspensos e na ordem de 2 vezes incremento de fósforo comparado com a água de abastecimento. Durante o ciclo de produção (113 dias), foram registrados 134 táxons distribuídos em 10 classes taxonômicas. Chlorophyceae (60 táxons) e Cyanobacteria (26 táxons) foram as classes com maior riqueza e abundância de espécies. Os maiores biovolumes foram registradas no centro do viveiro. Espécies nanoplanctônicas foram as mais abundantes e representaram 35% das espécies descritoras da comunidade fitoplanctônica do centro do viveiro. Conclusões: A instabilidade do sistema, quanto ao controle do tempo de retenção hidráulica como consequência do método de criação utilizado, favoreceu a presença de espécies com pequenas dimensões celulares. Os decréscimos de temperatura do ar e da água registrados na etapa final de crescimento possivelmente favoreceram o aumento e manutenção das diatomáceas.
phytoplanktonic groups in the inflow water together with high nutrient concentrations and high temperature will induce the replacement by mainly filamentous and colonial cyanobacteria in the fishpond.
2. Material and Methods
This study was performed in excavated fishponds of a Nile tilapia production system, located in the Crustacean Sector of the Aquaculture Center of São Paulo State University - CAUNESP, Jaboticabal, SP, Brazil (21° 15’ 22” S and 48° 18’ 48” W) (Figure 1). The climate according to the Köppen classification is AW tropical rainy with dry winter and mean temperatures in the coldest month of 18ºC. Rainfall during the experimental period ranged from 183 mm in March to 7.8 mm in June 2010. The monthly average air temperature was higher in the first half of the grow-out period (24.6 ± 5.7 °C in March and 22.2 ± 6.1 °C in April) than at the end (19.5 ± 6.5 °C in May and 18.5 ± 7.7 °C in June) (CIIAGRO, 2012).
The fishpond had a surface area of 0.02 ha, a volume of 220 m3 and a residence time of 4 days. The male monosex Nile tilapias (Oreochromis niloticus Linnaeus 1758) were in the grow-out stage, with an individual weight of 17.5 g. The adopted production system was semi-intensive, stocked at 3 fishes/m2. Twice a day, tilapias were fed with a commercially formulated extruded diet, containing 28% of crude protein. The daily ration of feed ranged from 2.5 to 5% of fish weight, considering the population developmental stage (size/age) and the estimate of the biomass produced. To estimate the total biomass, fishes were measured periodically, considering the analysis of a batch containing 10% of the fishpond total population. At the end of the grow-out period (113 days), the final mean fish weight was 176.9 g, the production was 5.3 kg ha-1, and the total amount of feed was 5.987 kg ha-1.
For the analysis of limnological variables and phytoplankton, water samples from the inflow water and the fishpond were collected fortnightly for 113 days, from March 3 to June 24, 2010
(n = 9), using sterile bottles. The water temperature, dissolved oxygen, electrical conductivity, pH, and turbidity were measured in situ using portable sensors (Horiba U10). Total suspended solids (TSS) were determined according to APHA (2005), total Kjeldahl nitrogen (TKN), dissolved Kjeldahl nitrogen (DKN), nitrite-N and nitrate-N concentrations according to Mackereth et al. (1978) and ammoniacal-N according to Koroleff (1976). Total inorganic nitrogen concentration (TIN) was calculated as the sum of concentration values for nitrite-N, nitrate-N, and ammoniacal-N. Total phosphorus (TP), dissolved phosphorus (DP) and orthophosphate-P (P-ORT) concentrations were determined according to Golterman et al. (1978).
Samples for qualitative analyses of the phytoplankton community were collected using a 20 μm mesh plankton net (n = 9) and preserved in 4% formaldehyde solution. Taxa were identified under the light microscope (Zeiss Axioplan 2), with the aid of specialized literature for each algal group and following the class level classification of van-den-Hoek et al. (1995) and Bicudo & Menezes (2017). For quantitative analyses, samples were fixed in a 1% Lugol’s solution. Counting (ind mL-1) was performed in random fields (Utermöhl, 1958) under an inverted microscope (Zeiss Axiovert 25) at 630 × magnification. Sedimentation time was 3 h cm-1 (Lund et al., 1958). Counting limit was defined by the species rarefying curve until reaching 100 individuals (cells, colonies, coenobium, and filaments) of the most common species (Bicudo, 1990).
The biovolume was estimated by multiplying the mean cell volume of each taxon (n = 20) by the cell population density. Cell volume was calculated based on geometric models (Hillebrand et al., 1999). To determine the descriptor species of the phytoplanktonic community, species with a relative biovolume > 1% that totaled 80% of the phytoplankton biovolume and those with a total biovolume > 50% as dominant species. Abundant species had a higher occurrence than the mean total number of individuals of the sample (Lobo & Leighton, 1986).
A one-way analysis of variance (ANOVA) was used to evaluate the limnological variables between the inflow water and fishpond, followed by Tukey’s test (p < 0.05), using Statistica version 7.1
(SN: AX505B150718FA) (StatSoft, 2005). Canonical correspondence analysis (CCA) was performed to evaluate the effect of the limnological variables of the inflow water and the fishpond on
the main patterns of the phytoplankton community, during the Nile tilapia grow-out period. The biotic matrix was composed of the phytoplankton descriptor species while the environmental matrix included the limnological variables of the inflow water and the fishpond. The limnological variables that showed the highest Pearson correlation with axes 1 and 2 (r > 0.5) were retained whereas the variables that could cause multicollinearity were excluded (Legendre & Legendre, 2012). Analyses were performed in PC-ORD 6.0 for Windows (McCune & Mefford, 1997), using log-transformed [log (x + 1)] data, except for the pH.
3. Results
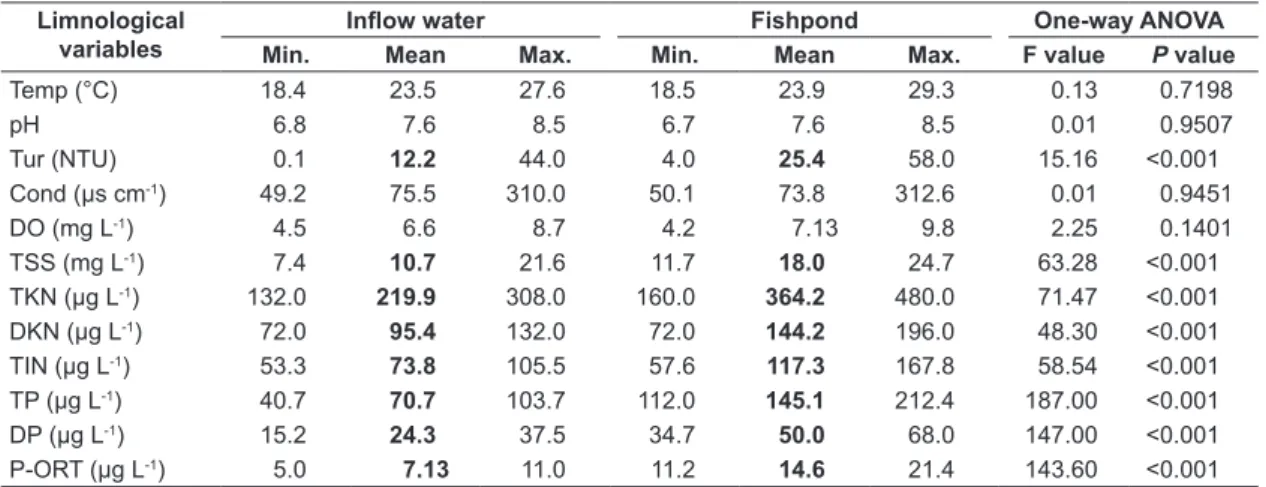
As shown in Table 1, the mean values of water temperature, pH, electrical conductivity and dissolved oxygen did not differ between water samples, although the average concentration of dissolved oxygen recorded in the fishpond (7.13 mg L-1) was higher than in the inflow water (6.62 mg L-1). In the fishpond water, the mean values of TSS (18.0 mg L-1), TKN (364.2 μg L-1), DKN (144.2 μg L-1) and TIN (117.3 μg L-1) were 1.5 times higher than in inflow water (TSS 10.7 mg L-1, TKN 219.9 μg L-1, DKN 95.4 μg L-1 and TIN 73.8 μg L-1). Mean values of TP (145.1 μg L-1), DP (50.0 μg L-1), P-ORT (14.6 μg L-1) and turbidity (25.4 NTU) recorded in the fishpond were 2 times higher than in inflow water (TP: 70.7 μg L-1, DP: 24.3 μg L-1, P-ORT: 7.13 μg L-1 and turbidity: 12.2 NTU).
The highest phytoplankton biovolumes were recorded in the inflow water during the first 28 days of the tilapia culture but thereafter, the highest values were found in the fishpond (Figure 2). Chlorophyceae and Cyanobacteria were abundant in both water samples (Figure 2). Cyanobacteria showed the greatest abundance in the first two samplings, with 49 and 30% of the total phytoplankton biovolume, respectively, while Bacillariophyceae were most abundant in the last two samplings, with 69 and 70% of the total phytoplankton biovolume, respectively (Figure 2A).
We identified 134 taxa; 29 taxa showed a mean biovolume > 1% of total biovolume and were classified as descriptors species and along with six limnological variables were used in the canonical correspondence analysis (CCA) (Table 2; Figure 3). The first two axes of the CCA explained 34.3% of the total variation (Axis 1: 17.5% and
Axis 2: 16.8%). Monte Carlo´s test proved that the eigenvalues for these axes (λ1 = 0.431 and 2 = 0.414 for axis 1 and axis 2, respectively) were statistically significant (p < 0.05). The correlation species-environment was significant (p < 0.05) for axis 1 (r = 0.933) and axis 2 (r = 0.950) indicating a strong relationship between the distribution of the phytoplankton taxa and the limnological variables of the inflow and fishpond water. Axis 2 evidenced a temporal variation over the grow-out period.
Intra-set correlation and canonical coefficients indicated that total suspended solids (TSS) (r = -0.8), total Kjeldahl nitrogen (TKN) (r = -0.8), total inorganic nitrogen (TIN) (r = -0.8), total phosphorus (TP) (r = -0.9) and orthophosphate-P (P-ORT) (r = -0.8) contributed to axis 1 and clustered together the samples of fishpond on the negative side. Chlamydomonas microscopica, Coelastrum proboscideum, Cryptomonas brasiliensis,
Cylindrospermopsis raciborskii, Isthmochloron neustonica and Peridinium cf. volzii showed a strong correlation (r > 0.5) with the highest nutrient concentrations while Chlorella minutissima,
Crucigenia fenestrata and Synechocystis aquatilis
characterized the inflow water and correlated with the lowest nutrient concentrations (r > 0.5).
In CCA, water temperature (Temp) was the variable that contributed most to axis 2 (r = 0.9) and evidenced the variation of the phytoplankton taxa over the grow-out period. On the positive side, samples of the first 56 days of culture were clustered together, associated mainly with Planktolyngbya contorta (r = 0.7) whereas, after this culture period, Figure 2. Fortnightly variation in the biovolume (mm3 L-1)
of phytoplankton groups, in the inflow water (A) and the fishpond (B) of a Nile tilapia production system during the grow-out period (n = 9). (Others = Chrysophyceae, Cryptophyceae, Euglenophyceae, Dinophyceae, Xanthophyceae and Zygnemaphyceae).
Table 1. Minimum (min.), mean, and maximum (max.) values of the water temperature (Temp), pH, turbidity (Tur), electrical conductivity (Cond), dissolved oxygen (DO), total suspended solids (TSS), total Kjeldahl nitrogen (TKN), dissolved Kjeldahl nitrogen (DKN), total inorganic nitrogen (TIN), total phosphorus (TP), dissolved phosphorus (DP) and orthophosphate-P (P-ORT), in the inflow water and the fishpond of a Nile tilapia production system during grow-out period (n = 9).
Limnological variables
Inflow water Fishpond One-way ANOVA
Min. Mean Max. Min. Mean Max. F value P value
Temp (°C) 18.4 23.5 27.6 18.5 23.9 29.3 0.13 0.7198
pH 6.8 7.6 8.5 6.7 7.6 8.5 0.01 0.9507
Tur (NTU) 0.1 12.2 44.0 4.0 25.4 58.0 15.16 <0.001
Cond (µs cm-1) 49.2 75.5 310.0 50.1 73.8 312.6 0.01 0.9451
DO (mg L-1) 4.5 6.6 8.7 4.2 7.13 9.8 2.25 0.1401
TSS (mg L-1) 7.4 10.7 21.6 11.7 18.0 24.7 63.28 <0.001
TKN (µg L-1) 132.0 219.9 308.0 160.0 364.2 480.0 71.47 <0.001
DKN (µg L-1) 72.0 95.4 132.0 72.0 144.2 196.0 48.30 <0.001
TIN (µg L-1) 53.3 73.8 105.5 57.6 117.3 167.8 58.54 <0.001
TP (µg L-1) 40.7 70.7 103.7 112.0 145.1 212.4 187.00 <0.001
DP (µg L-1) 15.2 24.3 37.5 34.7 50.0 68.0 147.00 <0.001
P-ORT (µg L-1) 5.0 7.13 11.0 11.2 14.6 21.4 143.60 <0.001
samples were associated with the lowest water temperature and characterized by the diatom
Fragilaria familiaris (r = -0.7).
4. Discussion
In our study, descriptor species were good indicators of the phytoplankton diversity of the fishpond. We classified 25 of 134 identified taxa as descriptor species, representing 82% of the phytoplankton community. Descriptor species were also an appropriate tool for the study of temporal dynamics of the phytoplankton community during the Nile tilapia grow-out period. Chlorophyceae
and Cyanobacteria, which are considered the most representative in fishponds (Boyd, 2016), were also abundant in the fishpond analyzed. Mercante et al. (2011) reported that Chlorophyceae and Cyanobacteria accounted for 60% and 10% respectively of the phytoplankton community of a Nile tilapia fishpond, while Costa et al. (2015) observed that 43% of the phytoplankton community of a tambaqui fishpond (Colossoma macropomum) was represented by the Chlorophyceae.
and a 2 times increase in P concentrations of the fishpond compared to the inflow water. Previous studies have also documented an increase in nutrients in the fishponds. Henry-Silva & Camargo (2006) reported an increase of 3.4 times for TP and 1.7 times for TKN in the outlet water compared with the inflow water in a tilapia fishpond, while Osti et al. (2018) registered that 15.931 g of N and 4.189 g of TP were exported during the grow-out period of tilapia and estimated that only 26% of the N and 45% of the P of the diet was converted into fish biomass. These authors found that this increase in nutrient concentrations in the fishponds was related to the entry of these compounds derived from the production practices (e.g. via inflow water and leftover fertilizers). In our study, the chemical fertilization with single superphosphate and ammonium, in addition to the diet provided (up to 68.8 kg ha-1 day-1 recorded at the end of the grow-out period), favored the entry of nutrients. However, the dynamics of the phytoplankton community in the fishpond was not only dependent on these factors. As previously observed by Boyd
(2016), the inflow water had a diverse resident community that influenced significantly the dynamics and structure of the phytoplankton in the fishpond. Of the 27 descriptor species recorded in the inflow water, only Aulacoseira sp. 1, Phacus sp., Sphaerocavum brasiliensis and
Trachelomonas volvocinopsis were not registered in the fishpond. We recorded high phytoplankton biovolumes in the inflow water during the first 28 days of the tilapia grow-out period. These high values might be related to the water source, since the inflow water comes from two dams that are oligo-mesotrophic and hypereutrophic and receives effluents from the sectors of fish and frog farming of CAUNESP (Pistori et al., 2010). Furthermore, this period coincided with harvesting in these sectors, when water is rich in nutrients and organic materials are released into the dam.
Management practices during the tilapia grow-out period also seem to have a significant effect on the phytoplankton structure of the fishpond. During the pond arrangements before the fish reception, we provided fertilization and stopped Table 2. Pearson´s correlations obtained for the biovolume of the phytoplankton species and axes 1 and 2 of the CCA.
Codes Axis 1 Axis 2
Achnanthidium sp. Achn 0.390 0.388
Aphanocapsa koordersii Ström Ako 0.423 0.346
Aulacoseira sp.1 Aula 0.329 0.014
A. granulata var. angustissima (Müller) Simonsen Agraa -0.167 -0.377
A. granulata var. granulata (Ehrenberg) Simonsen Agrag 0.381 0.349
Chlamydomonas microscopica West Cmic -0.520 0.490
C. planctogloea Skuja Cpla -0.345 0.394
Chlorella minutissima Fott & Nováková Clmi 0.850 -0.023
Chlorococcum cf. infusionum (Schrank) Meneghini Cinf -0.078 0.378
Chroococcus minutus (Kützing) Nägeli Crmi -0.296 -0.240
Coelastrum proboscideum Bohlin Cpro -0.616 -0.285
Coelosphaerium evidenter-marginatum Azevedo & Sant’Anna Cevi 0.062 0.458
Crucigenia fenestrata (Schmidle) Schmidle Cfen 0.792 0.108
Cryptomonas brasiliensis Castro, Bicudo & Bicudo Cbra -0.765 -0.083
C. erosa Ehrenberg Cero -0.447 -0.198
Cylindrospermopsis raciborskii (Woloszynska) Seenayya & Raju Crac -0.597 0.313
Dictyosphaerium pulchellum Wood Dpul 0.143 0.455
Fragilaria familiaris (Kützing) Hustedt Ffam 0.090 -0.666
Isthmochloron neustonica Zalocar & Pizarro Ineu -0.552 -0.248
Navicula cf. antonii Lange-Bertalot Nant 0.346 0.473
Pediastrum duplex var. duplex Meyen Pddu -0.388 0.227
Peridinium cf. umbonatum Stein Pumb -0.377 0.014
Peridinium cf. volzii Lemmermann Pvol -0.568 -0.031
Phacus sp. Phac 0.162 0.326
Planktolyngbya contorta (Lemmermann) Anagnostidis & Komárek Pcont 0.149 0.725
P. limnetica (Lemmermann) Komárek, Legn. & Cronberg Plimn 0.402 0.413
Sphaerocavum brasiliensis Azevedo & Sant’Anna Sbral 0.419 -0.455
Synechocystis aquatilis Sauvageau Saqu 0.819 0.017
the water renewal with the aim of stimulating algal growth. In the first collection, Chlamydomonas spp. presented the highest abundance, which represented 35% of the phytoplankton biovolume in the fishpond. These small algae have a faster growth than larger algae and are considered pioneer organisms in aquatic environments (Reynolds et al., 2002; Kruk & Segura, 2012).
In aquaculture ponds, the flowering of filamentous and colonial microorganisms, especially of cyanobacteria, is common during the production cycle. For example, Kopp et al. (2016) recorded the flowering of Planktothrix aghardii in fishponds in the Czech Republic and Beyruth & Tanaka (2000) registered the flowering of Eudorina elegans, Microcystis flos-aquae, Microcystis aeroginosa and
Anabaena solitary in ponds of prawn farming (Macrobrachium rosenbergii). Blooms are associated
with the entry of inoculum from varied taxonomic groups in the inflow water together with high nutrient concentrations and high temperatures. However, the constant water renewal (residence time: 4 days) seems to have favored small-sized species and/ or with the presence of flagella. On average, 35% of the descriptor species of the phytoplankton community in the fishpond were characterized as nanoplankton (maximum cell size between 2 - 20 μm). These organisms can be found in environments of different trophic levels (Kruk & Segura, 2012) and have peculiar traits, such as fast growth, high productivity, high nutrient stock and rapid light absorption (Reynolds, 1997). In cases of changes in the hydraulic conditions, particularly losses in the outflow, nanoplanktonic species have a competitive advantage over slow-growing species (Brasil & Huszar, 2011), such as the Cyanobacteria Cylindrospermopsis, Dolichospermum, Microcystis, and Planktothrix, which are affected to a greater extent (Reynolds, 1997). Flagellated species like Chlamydomonas plactogloea, C. microscopica, Cryptomonas brasiliensis, C. erosa
and Peridinium cf. volzii were also abundant during the production cycle.
Diatoms were abundant in both the inflow water and the fishpond at the end of the grow-out period of the Nile tilapia, associated with low water temperatures. Certain diatom species are good competitors in environments with low solar radiation and low water temperature (Kruk & Segura, 2012). In our study, the highest biovolume of diatoms was registered in the fishpond during the last two samplings and can be attributed to the proximity of the winter period that besides giving
the diatoms a competitive advantage over other algal groups, it may have affected the feeding efficiency of the tilapias.
Finally, the Nile tilapia is an omnivorous filter-feeding species in an intermediate trophic position between the primary producers and piscivorous predators (Attayde et al., 2007). Turker et al. (2003a, c) and Attayde et al. (2007) demonstrated that filtration favored the presence of small-sized algae since tilapias promoted a significant reduction in the abundance of large species (i.e.,
Microcystis and Desmodesmus) through non-selective
foraging (Turker et al., 2003d). Larger organisms such as colonial and filamentous Cyanobacteria were filtered more efficiently than smaller organisms, as demonstrated by the presence of the descriptor species Chlamydomonas plactogloea, C. microscopica,
Chroococcus minutus and Isthmochloron neustonica
in the fishpond. In agreement with our results, Turker et al. (2003a) compared a system with and without tilapias and found 2 to 3 times more cyanobacteria in the system without tilapia.
Acknowledgements
This work was supported by CNPq (Process no. 477878/2008-3). J. A. S. Osti thanks CAPES for providing a scholarship, and A. F. M. Camargo thanks CNPq for continuous funding through a Productivity Grant. We also thank Dr. Wagner Cotroni Valenti for logistical support for this study, and Carlos Fernando Sanches for valuable help in the fieldwork and laboratory analyses.
References
AMERICAN PUBLIC HEALTH ASSOCIATION – APHA. Standard methods for the examination of Water and Wastewater. 21st ed. Washington: APHA, 2005. ATTAYDE, J.L., OKUN, N., BRASIL, J., MENEZES,
R. and MESQUITA, P. Impactos da introdução da tilápia do Nilo, Oreochromis niloticus, sobre a estrutura trófica dos ecossistemas aquáticos do Bioma Caatinga. Oecologia Brasiliensis, 2007, 11(3), 450-461. http://dx.doi.org/10.4257/oeco.2007.1103.13. BEISNER, B.E., PERES-NETO, P.R., LINDSTRÖM,
E.S., BARNETT, A. and LONGHI, M.L. The role of environmental and spatial processes in structuring lake communities from bacteria to fish.
Ecology, 2006, 87(12), 2985-2991. http://dx.doi. org/10.1890/0012-9658(2006)87[2985:TROEAS] 2.0.CO;2. PMid:17249222.
BEYRUTH, Z. and TANAKA, F.M. Biovolume of the phytoplankton in aquaculture tropical ponds.
Verhandlungen - Internationale Vereinigung für Theoretische und Angewandte Limnologie, 2000, 27(5), 689-695. http://dx.doi.org/10.1080/03680770.199 8.11901322.
BEYRUTH, Z., MAINARDES-PINTO, C.S.R., FUSCO, S.M., FARIA, F.C. and SILVA, A.L. Utilização de alimentos naturais por Oreochromis niloticus em tanques de terra com arraçoamento.
Boletim do Instituto de Pesca, 2004, 30(1), 9-24. BICUDO, C.E.M. and MENEZES, M. Gêneros de algas
de águas continentais do Brasil: chave para identificação e descrições. 3. ed. São Carlos: RiMa, 2017.
BICUDO, D.C. Considerações sobre metodologias de contagem de algas do perifíton. Acta Limnologica Brasiliensia, 1990, 3, 459-475.
BOUVY, M., FALCÃO, D., MARINHO, M., PAGANO, M. and MOURA, A. Occurrence of
Cylindrospermopsis (Cyanobacteria) in 39 Brazilian
tropical reservoirs during the 1998 drought. Aquatic Microbial Ecology, 2000, 23, 13-27. http://dx.doi. org/10.3354/ame023013.
BOYD, C.E. Phytoplankton a crucial componente of aquaculture pond ecosystems. Portsmouth: Global
Aquaculture Advocate, 2016, 4 p.
BRASIL, J. and HUSZAR, V.L.M. O papel dos traços funcionais na ecologia do fitoplâncton continental.
Oecologia Australis, 2011, 15(4), 799-834. http:// dx.doi.org/10.4257/oeco.2011.1504.04.
BRRAICH, O.S. and SAINI, S.K. Phytoplankton abundance and species diversity in Ranjit Sagar Wetland, Punjab (India). Current World Environment, 2015, 10(1), 215-221. http://dx.doi.org/10.12944/ CWE.10.1.25.
CENTRO INTEGRADO DE INFORMAÇÕES AGROMETEOROLÓGICAS – CIIAGRO. 2012 [viewed 14 Oct. 2012]. Available from http://www. ciiagro.sp.gov.br
CHATVIJITKUL, S., BOYD, C.E., DAVIS, D.A. and MCNEVIN, A.A. Pollution potential indicators for feed-based fish and shrimp culture. Aquaculture, 2017, 477, 43-49. http://dx.doi.org/10.1016/j. aquaculture.2017.04.034.
COSTA, R.L., FIGUEIREDO, F.M., BAY, M., QUEIROZ, C.B. and BAY-HURTADO, F. Análise qualitativa da comunidade fitoplanctônica de uma piscicultura em Alvorada d’Oeste, Rondônia, Brasil.
Acta Agronomica, 2015, 64(3), 260-267. http:// dx.doi.org/10.15446/acag.v64n3.45113.
DAVID, F.S., PROENÇA, D.C. and VALENTI, W.C. Nitrogen budget in integrated aquaculture systems with Nile tilapia and Amazon River prawn.
Aquaculture International, 2017a, 25(5), 1733-1746. http://dx.doi.org/10.1007/s10499-017-0145-y. DAVID, F.S., PROENÇA, D.C. and VALENTI, W.C.
Phosphorus budget in integrated multitrophic aquaculture systems with Nile Tilapia, Oreochromis niloticus, and Amazon River prawn, Macrobrachium amazonicum.Journal of the World Aquaculture Society, 2017b, 48(3), 402-414. http://dx.doi.org/10.1111/ jwas.12404.
FERNANDES, V.O., CAVATI, B., OLIVEIRA, L.B. and SOUZA, B.A. Ecologia de cianobactérias: fatores promotores e consequências das florações. Oecologia Brasiliensis, 2009, 13(2), 247-258.
FOOD AND AGRICULTURE ORGANIZATION OF THE UNITED NATIONS – FAO. The state of world fisheries and aquaculture [online]. Rome: FAO, 2016 [viewed 22 Apr. 2017]. 200 p. Available from: http:// www.fao.org/3/a-i5555e.pdf
GOLTERMAN, H.L., CLYNO, R.S. and OHSNTAD, M.A.M. Methods for chemical analysis of fresh water. Boston: Blackwell, 1978.
GORLACH-LIRA, K., PACHECO, C., CARVALHO, L.C.T., MELO JÚNIOR, H.N. and CRISPIM, M.C. The influence of fish culture in floating net cages on microbial indicators of water quality. Brazilian Journal of Biology = Revista Brasileira de Biologia, 2013, 73(3), 457-463. http://dx.doi.org/10.1590/ S1519-69842013000300001. PMid:24212684. HENRY-SILVA, G.G. and CAMARGO, A.F.M.
63(5), 433-438. http://dx.doi.org/10.1590/S0103-90162006000500003.
H I L L E B R A N D , H . , D Ü R S E L E N , C . - D . , KIRSCHTEL, D., POLLINGHER, U. and ZOHARY, T. Biovolume Calculation for pelagic and benthic Microalgae. Journal of Phycology, 1999, 35(2), 403-424. http://dx.doi.org/10.1046/j.1529-8817.1999.3520403.x.
KOPP, R., ŘEZNÍČKOVÁ, P., HADAŠOVÁ, L., PETREK, R. and BRABEC, T. Water Quality and Phytoplankton Communities in Newly Created Fishponds. Acta Universitatis Agriculturae et Silviculturae Mendelianae Brunensis, 2016, 64(1), 71-80. http://dx.doi.org/10.11118/ actaun201664010071.
KOROLEFF, F. Determination of nutrients. In: K. GRASSHOFF, ed. Methods of seawater analysis. Weinhein: Verlag Chemie, 1976, pp. 117-181. KRUK, C. and SEGURA, A.M. The habitat template of
phytoplankton morphology-based functional groups.
Hydrobiologia, 2012, 698(1), 191-202. http://dx.doi. org/10.1007/s10750-012-1072-6.
LEGENDRE, P. and LEGENDRE, L.F. Numerical ecology. Hoboken: Elsevier, 2012.
LOBO, E.A. and LEIGHTON, G. Estructuras comunitarias de las fitocenosis planctónicas de los sistemas de desembocaduras de rios y esteros de la Zona Central de Chile. Revista de Biología Marina, 1986, 22, 1-29.
LUND, J.W.G., KIPLING, C. and LECREN, E.D. The invert microscope method of estimating algal numbers and the statistical basis of estimations by counting. Hydrobiologia, 1958, 11(2), 143-170. http://dx.doi.org/10.1007/BF00007865.
MACKERETH, J.F.H., HERON, J. and TALLING, J.F.
Water analysis: some revised methods for limnologists. vol. 36. Ambleside: Freshwater Biological Association,
1978, 121 p.
MARGALEF, R. Perspectivas de la teorıa ecologica. Barcelona: Blume, 1978.
MCCUNE, B. and MEFFORD, J.J. PC-ord: multivariate analysis of ecological data. Version 3.0. Oregon: MjM Software Design, 1997.
MERCANTE, C.T.J., CARMO, C.F., RODRIGUES, C.J., OSTI, J.A.S., MAINARDES-PINTO, C.S., VAZ-DOS-SANTOS, A.M., TUCCI, A. and DI GENARO, A. Limnologia de viveiro de criação de tilápias do nilo: avaliação diurna visando boas práticas de manejo. Boletim do Instituto de Pesca, 2011, 37(1), 73-84.
MERCANTE, C.T.J., MARTINS, Y.K., CARMO, C.F., OSTI, J.S., MAINARDES PINTO, C.S.R. and TUCCI, A. Qualidade de água em viveiro de Tilápia do Nilo (Oreochromis niloticus): caracterização diurna de variáveis físicas, químicas e biológica, São Paulo, Brasil. Bioikos, 2007, 21(2), 79-88.
MONTOYA, R.A., LAWRENCE, A.L., GRANT, W.E. and VELASCO, M. Simulation of phosphorus dynamics in an intensive shrimp culture system: effects of feed formulation and feeding strategies.
Ecological Modelling, 2000, 129(2-3), 131-142. http://dx.doi.org/10.1016/S0304-3800(00)00230-1. OSTI, J.A.S., MORAES, M.A.B., CARMO, C.F. and
MERCANTE, C.T.J. Nitrogen and phosphorus flux from the production of Nile tilapia through the application of environmental indicators.
Brazilian Journal of Biology = Revista Brasileira de Biologia, 2018, 78(1), 25-31. http://dx.doi. org/10.1590/1519-6984.02116. PMid:28699963. PA D I S Á K, J. Cy l i n d ro s p e r m o p s i s ra c i b o r s k i i
(Woloszynnska) Seenayya et Subba Raju, an expanding, highly adaptive cyanobacterium: worldwide distribution and review of its ecology.
Archiv für Hydrobiologie, 1997, 107, 563-593. PAERL, H.W. and TUCKER, C.S. Ecology of bluegreen
algae in aquaculture ponds. Journal of the Aquaculture Society, 1995, 26(2), 109-131. http://dx.doi. org/10.1111/j.1749-7345.1995.tb00235.x. PISTORI, R.E.T., HENRY-SILVA, G.G., BIUDES,
J.F.V. and CAMARGO, A.F.M. Influence of aquaculture effluents on the growth of Salvinia molesta. Acta Limnologica Brasiliensia, 2010, 22(02), 179-186. http://dx.doi.org/10.4322/ actalb.02202007.
REYNOLDS, C., HUSZAR, V., KRUK, C., NASELLI-FLORES, L. and MELO, S. Towards a functional classification of the freshwater phytoplankton.
Journal of Plankton Research, 2002, 24(5), 417-428. http://dx.doi.org/10.1093/plankt/24.5.417. REYNOLDS, C.S. Vegetation processes in the pelagic: a
model for ecosystem theory. Oldendorf: ECI, 1997. SANT’ANNA, C.L., AZEVEDO, M.T.P., AGUJARO,
L.F., CARVALHO, M.C., CARVALHO, L.R. and SOUZA, R.C.R. Identificação e contagem de cianobactérias planctônicas de águas continentais brasileiras. Rio de Janeiro: Interciência, 2006. STAT SOFT. Statistica: data analysis software system. For
Windows - Version 7.0. 2005 [viewed 18 Jul. 2013]. Available from: http://www.statsoft.com
TURKER, H., EVERSOLE, A.G. and BRUNE, D.E. Filtration of green algae and cyanobacteria by Nile tilapia, Oreochromis niloticus, in the Partitioned Aquaculture System. Aquaculture, 2003a,
215(1-4), 93-101. http://dx.doi.org/10.1016/S0044-8486(02)00133-3.
TURKER, H., EVERSOLE, A.G. and BRUNE, D.E. Effect of temperature and phytoplankton concentration on Nile tilapia Oreochromis niloticus
TURKER, H., EVERSOLE, A.G. and BRUNE, D.E. Comparative Nile tilapia and silver carp filtration rates of Partitioned Aquaculture System phytoplankton.
Aquaculture, 2003c, 220(1-4), 449-457. http:// dx.doi.org/10.1016/S0044-8486(02)00614-2. TURKER, H., EVERSOLE, A.G. and BRUNE, D.E.
Effect of Nile tilapia, Oreochromis niloticus (L.), size on phytoplankton filtration rate. Aquaculture Research, 2003d, 34(12), 1087-1091. http://dx.doi. org/10.1046/j.1365-2109.2003.00917.x.
UTERMÖHL, H. Zur Vervolkommung der quantitativen phytoplankton: methodik. Mitteilungen Internationale Vereinigung für Theoretische und Angewandte. Limnologie, 1958, 9, 1-38.
VAN DEN HOEK, C., MANN, D.G. and JAHNS, H.M. Algae: an introduction to phycology. Cambridge: Cambridge University Press, 1995.