Arq. Bras. Med. Vet. Zootec., v.69, n.3, p.637-643, 2017
Acid-base balance in sheep with experimentally induced acute
ruminal lactic acidosis
[Equilíbrio ácido-base em ovinos com acidose láctica ruminal aguda induzida experimentalmente]
A.F. Sabes, A.M. Girardi, D. Zangirolami Filho, G.M. Bueno, J.A. Oliveira, L.C. Marques
Faculdade de Ciências Agrárias e Veterinárias (FCAV) Universidade Estadual
Paulista “Júlio de Mesquita Filho” (UNESP) Jaboticabal, SP
ABSTRACT
This study aimed to investigate the changes in the acid-base balance of sheep with experimentally induced acute ruminal lactic acidosis (ARA). Ten ewes orally received 15 grams of sucrose per kilogram of body mass. Arterial blood samples for blood gas analysis were obtained at the following intervals: before the induction of ARA (control), and 2, 4, 6, 8, 10, 12, 16, 20, 24, 28, 32, 36, 48, 72, 96, 120 and 144 hours after sucrose administration. Urine samples for pH measurement were obtained at the following times: -15 days, -7 days, and immediately before sucrose administration, then at 24, 48, 72, 96, 120 and 144 hours. Thereafter, both blood and urine samples were obtained on the 2nd, 3rd, and 4th following weeks. From 4 hours after the induction, elevation of the pH, bicarbonate and base excess on the arterial blood was observed. After 12 hours, the animals showed a decrease of these parameters, as well as urine acidification, which are symptomatic of metabolic acidosis. Within 28 hours, all parameters were normalized except the base excess, which only returned to normal after 72 hours. Despite the occurrence of acidemia, there was no need for medication and no animals died.
Keywords: blood gas analysis, metabolic acidosis, Santa Inês
RESUMO
Este trabalho objetivou estudar as alterações referentes ao equilíbrio ácido-base de ovinos com acidose láctica ruminal aguda (ARA) induzida experimentalmente. Dez ovelhas receberam oralmente 15 gramas de sacarose por quilograma de peso corporal. Amostras de sangue arterial para realização da hemogasometria foram obtidas nos seguintes intervalos: antes da indução da ARA (controle), duas, quatro, seis, oito, 10, 12, 16, 20, 24, 28, 32, 36, 48, 72, 96, 120, 144 horas após a administração da sacarose. Amostras de urina para análise do pH urinário foram obtidas nos seguintes momentos: 15 dias, sete dias e imediatamente antes da administração da sacarose, 24, 48, 72, 96, 120 e 144 horas. Posteriormente, tanto as amostras de sangue quanto de urina foram obtidas na segunda, terceira e quarta semanas seguintes. A partir de quatro horas da indução, elevação do pH, do bicarbonato e excesso de base no sangue arterial foram observados. Após 12 horas, os animais apresentaram diminuição dos parâmetros acima citados, como também acidificação da urina, que são sintomas de acidose metabólica. Decorridas 28 horas, todos os parâmetros retornaram à normalidade, exceto o EB, que somente retornou à normalidade após 72 horas. Apesar da ocorrência da acidemia, não houve necessidade de tratamento medicamentoso e nenhum animal veio a óbito.
Palavras-chave: hemogasometria, acidose metabólica, Santa Inês
INTRODUCTION
The increase in the number of sheep in recent years is owing to the great adaptability of these animals to adverse environmental conditions and the increase of domestic demand for sheep meat (Gonzaga Neto et al., 2005). However, the intensification of the sheep meat system has led to the emergence of some problems such as an increase in nutritional and metabolic disorders (Vieira et al., 2006). For example, acute ruminal lactic acidosis (ARA) is known to cause considerable economic losses (Barros et al., 1997; Smith et al., 2014), and this disorder is the result of rapid and excessive intake of easily fermentable carbohydrates, causing different clinical signs, from lack of temporary appetite to severe gastrointestinal disorders (Dirksen et al., 2005).
Study of the acid-base balance can provide information for diagnosis and prognosis of various diseases. The most commonly observed type of acid-base disorder is metabolic acidosis (Kaneko et al., 1997; Maruta and Ortolani, 2002a). To diagnose this condition, blood gas analysis can be performed with venous and arterial blood, but arterial blood is preferable because of the higher oxygenation levels, and because blood gas results do not change in cases of blood flow stasis in patients with primary respiratory disorders or those who have received general anesthesia (DiBartola, 1992; Kaneko et al., 1997). Despite the large number of studies on this alteration in cattle, only few studies have examined this condition in sheep. Moreover, the comparison between cattle and sheep may be flawed because there are differences in the effects of ARA and metabolic acidosis even among bovine breeds (Maruta and Ortolani, 2002b; Ortolani et al., 2010). Considering the growth of the sheep meat industry in Brazil and consequent increase in the number of confined animals susceptible to various disorders such as metabolic acidosis, this study aimed to evaluate the acid-base balance in experimentally induced ARA in sheep by analyzing blood gas and urinary pH levels.
MATERIALS AND METHODS
animals were dewormed and fed a basal diet with coast cross hay (Cynodon dactylon), which provides the basic nutritional requirements of sheep (Silva Sobrinho et al., 1996). They also had free access to drinking water and mineral mixture. The adaptation period lasted 30 days.
At the beginning of the experiment (D [day] -15, -7 and 0), three blood and urine samples were collected from all animals to establish the basal values for blood gas variables and urinary pH, and the mean values were calculated. For induction of ARA, sucrose was administered orally in a single dose of 15g/kg body mass after dilution in warm water. After the administration of sucrose, arterial blood samples were obtained at the following intervals: 2, 4, 6, 8, 10, 12, 16, 20, 24, 28, 32, 36, 48, 72, 96, 120 and 144 hours, and urine samples were collected at 24, 48, 72, 96, 120, and 144 hours. Subsequently, samples were obtained every seven days for three further weeks.
Blood samples were collected by carotid and/or auricular artery puncture, with 25 x 7 mm or 25 x 8 mm disposable hypodermic needles connected to 3mL blood gas syringes containing the anticoagulant calcium-balanced lithium heparin (BD Preset® - BD Diagnostics - Preanalytical Systems, São Paulo, São Paulo, Brazil). The samples were collected with utmost care to avoid the formation of air bubbles, and the syringes were immediately sealed with syringe covers (BD Hemogard) to prevent the entry or exit of gases, as recommended by Sucupira and Ortolani (2003) and Leal et al. (2006). The blood gas analysis was performed with the Roche Omni C analyser (Roche Diagnostics GmbH, Mannheim, Germany), obtaining values for pH, partial pressures of oxygen (pO2) and carbon dioxide
(pCO2) (mmHg), oxygen saturation (SO2) (%),
bicarbonate concentration (HCO3-) (mmol/L),
base excess (BE) and total carbon dioxide concentration (ctCO2) (mmol/L).
digital pH analyser Digimed DM20 (Digicrom Analytics Ltda., São Paulo, São Paulo, Brazil), immediately after harvesting.
The data were submitted to variance analysis with repeated measures in which the factor tested was the harvest (20 levels for blood gas parameters, and nine levels for the urinary pH), with the animals constituting the 10 blocks. A regression analysis (linear, quadratic and cubic) was performed using the computer program General Linear Models Procedure (GLM) (SAS, 2005). The means were subjected to analysis by Tukey test at 5% significance. This study received ethical approval from Comissão de Ética no Uso de Animais (CEUA) FCAV/Unesp, Jaboticabal, São Paulo (Protocol nº. 03888/14).
RESULTS
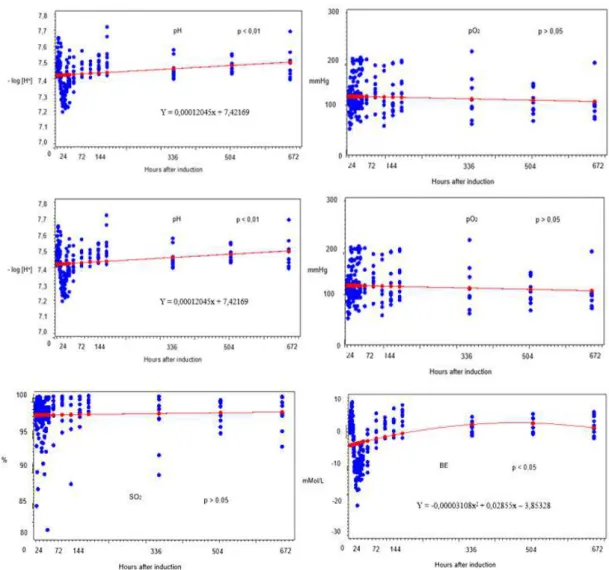
Among the blood gas variables, the pO2 and SO2
were not associated with time (P>0.05). The time
showed linear regression with the pH and pCO2
values (significant difference observed by Tukey test at 12, 16, 20, and 24 hours after induction compared to the control for pH, and at 28 hours for pCO2). The time showed quadratic regression
with the HCO3- and ctCO2 values (significant
difference at 10, 12, 16, 20, 24, 28, 32, 36, and 48 hours after induction by Tukey test for both values) and the BE values (significant difference at 4, 10, 12, 16, 20, 24, 28, 32, 36, and 48 hours compared to the control). Time showed cubic regression with the urinary pH values (significant difference at 24, 48, 72, 96, 120 hours, and second and third weeks after induction). The mean, standard deviation, and coefficient of variation (CV) of the blood gas values and the graphical representations of the regression analysis are shown in Table 1 and Figure 1, respectively. The mean, standard deviation, and coefficient of variation of the urine pH values are in Table 2 and the graph of the regression analysis is in Figure 2.
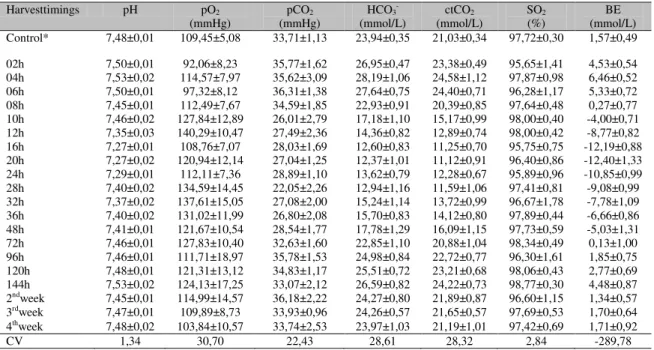
Table 1. Mean ± standard deviation and coefficient of variation (CV) of arterial blood gas analysis of sheep with ARA: pH; partial pressure of oxygen (pO2) (mmHg); partial pressure of carbon dioxide
(pCO2) (mmHg); bicarbonate concentration (HCO3-) (mmol/L); total carbon dioxide concentration
(ctCO2) (mmol/L); oxygen saturation (SO2) (%); and base excess (BE) (mmol/L). Harvest timings:
control*, 2, 4, 6, 8, 10, 12, 16, 20, 24, 28, 32, 36, 48, 72, 96, 120, and 144 hours, at 2nd, 3rd, and 4th weeks
after oral sucrose administration
Harvesttimings pH pO2
(mmHg)
pCO2
(mmHg)
HCO3
-(mmol/L)
ctCO2
(mmol/L)
SO2
(%)
BE (mmol/L)
Control* 7,48±0,01 109,45±5,08 33,71±1,13 23,94±0,35 21,03±0,34 97,72±0,30 1,57±0,49
02h 7,50±0,01 92,06±8,23 35,77±1,62 26,95±0,47 23,38±0,49 95,65±1,41 4,53±0,54
04h 7,53±0,02 114,57±7,97 35,62±3,09 28,19±1,06 24,58±1,12 97,87±0,98 6,46±0,52
06h 7,50±0,01 97,32±8,12 36,31±1,38 27,64±0,75 24,40±0,71 96,28±1,17 5,33±0,72
08h 7,45±0,01 112,49±7,67 34,59±1,85 22,93±0,91 20,39±0,85 97,64±0,48 0,27±0,77
10h 7,46±0,02 127,84±12,89 26,01±2,79 17,18±1,10 15,17±0,99 98,00±0,40 -4,00±0,71
12h 7,35±0,03 140,29±10,47 27,49±2,36 14,36±0,82 12,89±0,74 98,00±0,42 -8,77±0,82
16h 7,27±0,01 108,76±7,07 28,03±1,69 12,60±0,83 11,25±0,70 95,75±0,75 -12,19±0,88
20h 7,27±0,02 120,94±12,14 27,04±1,25 12,37±1,01 11,12±0,91 96,40±0,86 -12,40±1,33
24h 7,29±0,01 112,11±7,36 28,89±1,10 13,62±0,79 12,28±0,67 95,89±0,96 -10,85±0,99
28h 7,40±0,02 134,59±14,45 22,05±2,26 12,94±1,16 11,59±1,06 97,41±0,81 -9,08±0,99
32h 7,37±0,02 137,61±15,05 27,08±2,00 15,24±1,14 13,72±0,99 96,67±1,78 -7,78±1,09
36h 7,40±0,02 131,02±11,99 26,80±2,08 15,70±0,83 14,12±0,80 97,89±0,44 -6,66±0,86
48h 7,41±0,01 121,67±10,54 28,54±1,77 17,78±1,29 16,09±1,15 97,73±0,59 -5,03±1,31
72h 7,46±0,01 127,83±10,40 32,63±1,60 22,85±1,10 20,88±1,04 98,34±0,49 0,13±1,00
96h 7,46±0,01 111,71±18,97 35,78±1,53 24,98±0,84 22,72±0,77 96,30±1,61 1,85±0,75
120h 7,48±0,01 121,31±13,12 34,83±1,17 25,51±0,72 23,21±0,68 98,06±0,43 2,77±0,69
144h 7,53±0,02 124,13±17,25 33,07±2,12 26,59±0,82 24,22±0,73 98,77±0,30 4,48±0,87
2ndweek 7,45±0,01 114,99±14,57 36,18±2,22 24,27±0,80 21,89±0,87 96,60±1,15 1,34±0,57
3rdweek 7,47±0,01 109,89±8,73 33,93±0,96 24,26±0,57 21,65±0,57 97,69±0,53 1,70±0,64
4thweek 7,48±0,02 103,84±10,57 33,74±2,53 23,97±1,03 21,19±1,01 97,42±0,69 1,71±0,92
CV 1,34 30,70 22,43 28,61 28,32 2,84 -289,78
Figure 1. Regression analysis of arterial blood gas analysis of sheep with ARA, showing parameters of negative logarithm of the hydrogen ion concentration (pH), partial pressure of oxygen (pO2) (mmHg), partial
pressure of carbon dioxide (pCO2) (mmHg), bicarbonate concentration (HCO3-) (mmol/L), total carbon dioxide
concentration (ctCO2) (mmol/L), oxygen saturation (SO2) (%), base excess (BE) (mmol/L) and time.
Table 2. Mean ± standard deviation and coefficient of variation (CV) of pH values (negative logarithm of hydrogen ion concentration) of urine. Harvest timings: control*, 24, 48, 72, 96, 120, and 144 hours, at 2nd,
3rd, and 4th weeks after oral sucrose administration
Harvest timings urine pH
Control* 7,11 ± 0,11
24 h 5,28 ± 0,17
48 h 5,97 ± 0,14
72 h 5,65 ± 0,08
96 h 5,50 ± 0,16
120 h 6,96 ± 0,32
144 h 7,32 ± 0,31
2nd week 7,90 ± 0,00
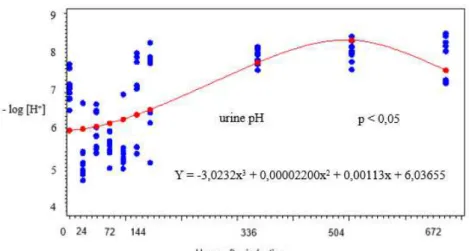
Figure 2. Regression analysis of the urine pH values (negative logarithm of the hydrogen ion concentration) of sheep with ARA.
DISCUSSION
The sucrose dose (15 g/kg body mass) was sufficient to induce ARA in all animals and without any mortalities. Hajikolaei et al. (2006) and Silva et al. (2013) used 18g and 10g of sucrose per kilogram of body mass, respectively for ARA induction in sheep. Four hours after ARA induction, increased mean values for arterial pH, bicarbonate, and base excess were observed. However, this increase was transient as also observed by Cao et al. (1987), Hajikolaei et al. (2006), and Kievitsbosch et al. (2011). After 6 hours, a decrease in the pH values was observed, with the lowest mean founded 20 hours after the induction of ARA. Similar trends were observed in the levels of bicarbonate and bass excess. According to Hajikolaei et al. (2006), an excessive carbohydrate intake leads to an increase in the amounts of volatile fatty acids and lactic acid produced in the rumen. As a result, not all of the lactic acid produced is used by the ruminal microflora, leading to a decrease of arterial pH, which is a feature of metabolic acidosis.
The serum bicarbonate levels showed a decrease between 6 and 20 hours after induction of ARA. The decrease of the blood pH activates compensatory mechanisms, and the bicarbonate ions are used to try to maintain the homeostasis. Seventy-two hours after development of ARA, the pH was stable along with the bicarbonate levels, possibly due to the reduced production and/or increased use of the lactic acid by ruminal
microflora, with consequent reduction of acidemia (Reece, 2006).
A significant decrease was observed in the urinary pH from the first sample taken at 24 hours, returning to normal values for the species within 120 hours. The consumption of large amounts of carbohydrates leads to the accumulation of both D (-) and L (+) optical isomers of lactic acid, with hepatic metabolism solely of the L (+) form and an increase in levels of the D (-) form, as it is not metabolized, resulting on metabolic acidosis (Hajikolaei et al., 2006). This acidemia stimulates the secretion of hydrogen ions through the renal tubular cells into the tubule filtrate, which ensures that all the bicarbonate in the glomerular filtrate is reabsorbed. The excess of hydrogen ions acidifies the urine, and most of this excess is excreted (Reece, 2006). With the restoration of blood pH to normal levels, the renal excretion of hydrogen ions stopped, and the urinary pH returned to the normal values five days after the ARA induction.
Up to 8 hours after induction of ARA, the pCO2
normal pH values were restored, the respiratory compensation mechanism stopped, and the pCO2
means were stabilized by the end of the experimental period.
The BE is calculated from the blood pH and the pCO2, and is an important parameter in
identifying acidosis or alkalosis (Sucupira and Ortolani, 2003). The BE levels behaved similarly to the pH levels, in that pH levels dropped and BE levels showed negative increases between ten and 20 hours, characterizing a relatively severe metabolic acidosis. After this period, the BE returned to the initial values gradually, reaching normal after 72 hours. The ctCO2 values also
showed a similar trend the other parameters. The concentration of ctCO2 is an indicator of carbon
dioxide saturation of blood plasma (Sucupira and Ortolani, 2003), and the respiratory compensation mechanism starts in minutes during metabolic acidosis.
CONCLUSION
The pH variations, bicarbonate concentration and base excess of the arterial blood of the sheep indicate that the animals had metabolic acidosis between 12 and 24 hours after oral administration of sucrose.
ACKNOWLEDGMENTS
The authors acknowledge the São Paulo Research Foundation (Fundação de Amparo à Pesquisa do Estado de São Paulo - FAPESP) for financial assistance.
REFERENCES
BARROS, N.N.; SIMPLÍCIO, A.A.;
FERNANDES, F.D. Terminação de borregos em confinamento no nordeste do Brasil. Sobral: EMBRAPA-CNPC, 1997. 24p. (Circular Técnica, 12).
CAO, G.R.; ENGLISH P.B.; FILIPPICH L.J. et al. Experimentally induced lactic acidosis in the goat. Aust. Vet. J., v.64, p.367-370, 1987. DIBARTOLA, S.P. Fluid therapy in small animal practice. Philadelphia: Saunders, 1992. 759p.
DIRKSEN, G.; GRUNDER, H.; STOBER, M. Medicina interna y cirurgía del bovino. Buenos Aires: Inter-médica, 2005. 1171p.
GONZAGA NETO, S.; SILVA SOBRINHO, A.G.; RESENDE, K.T. et al. Composição corporal e exigências nutricionais de macrominerais para cordeiros Morada Nova. Rev. Bras. Zootec., v.34, p.2133-2142, 2005. HAJIKOLAEI, M.R.H.; NOURI, M.; AFSHAR, F.S. et al. Effects of experimentally induced ruminal lactic acidosis on blood pH, bicarbonate and pCO2 in the sheep. Pak. J. Biol. Sci., v.9, p.2003-2005, 2006.
KANEKO, J.J.; HARVEY, J.W.; BRUSS, M.L. Clinical biochemistry of domestic animals. San Diego: Academic, 1997. 936p.
KIEVITSBOSCH, T.; DELFIOL, D.J.Z.; CUNHA, P.H.J. et al. Avaliação do pH sanguíneo em ovinos confinados recebendo dieta rica em carboidratos com adição de bicarbonato de sódio. Vet. Zootec., v.18, p.629-632, 2011. LEAL, M.L.R.; SOARES, P.C.; BERTAGNON, H.G. et al. Efeito da refrigeração sobre o exame gasométrico em sangue venoso de ovinos. Braz. J. Vet. Res. Anim. Sci., v.43, p.80-85, 2006.
MARUTA, C.A.; ORTOLANI, E.L.
Susceptibilidade de bovinos da raça Jersey e Gir a acidose láctica ruminal: I – Variáveis ruminais e fecais. Ciênc. Rural, v.32, p.55-59, 2002a.
MARUTA, C.A.; ORTOLANI, E.L.
Susceptibilidade de bovinos das raças Jersey e Gir à acidose láctica rumenal: II – Acidose metabólica e metabolização do lactato-L. Ciênc. Rural, v.32, p.61-65, 2002b.
ORTOLANI, E.L. Diagnóstico de doenças nutricionais e metabólicas por meio de exame de urina em ruminantes. In: SIMPÓSIO DE PATOLOGIA CLÍNICA VETERINÁRIA DA REGIÃO SUL DO BRASIL, Porto Alegre, 2003. Anais... Porto Alegre: Gráfica da Universidade Federal do Rio Grande do Sul, 2003. p.91-102.
ORTOLANI, E.L.; MARUTA, C.A.;
SAS user’s guide statistics. Version 9.1.3. Cary:
SAS Institute, 2005.
SILVA, S.T.G.; MIRANDA NETO, E.G.; MENDONÇA, C.L. et al. Avaliação clínico laboratorial do emprego da monensina sódica na prevenção da acidose láctica ruminal em caprinos. Rev. Bras. Med. Vet., v.35, p.76-84, 2013.
SIQUEIRA, E.R.; AMARNTE, A.F.T.; FERNANDES, S. Estudo comparativo da recria de cordeiros em confinamento e pastagens. Vet. Zootec., v.5, p.17-28, 1993.
SILVA SOBRINHO, A.G.; BATISTA, A.M.V.; SIQUEIRA, E.R. et al. Nutrição de ovinos. Jaboticabal: Funep, 1996. 258p.
SMITH, B. P. Large animal internal medicine. 5th ed. St. Louis: Mosby, 2014. 1712 p
SUCUPIRA, M.C.A.; ORTOLANI, E.L. Uso de sangue arterial e venoso no exame do equilíbrio ácido básico de novilhos normais ou com acidose metabólica. Ciênc. Rural, v.33, p.863-868, 2003.
VIEIRA, A.C.S.; AFONSO, J.A.B.;