Vol.53, n. 3: pp.563-574, May-June 2010
ISSN 1516-8913 Printed in Brazil BRAZILIAN ARCHIVES OF
BIOLOGY AND TECHNOLOGY
A N I N T E R N A T I O N A L J O U R N A L
Yield Response to Fertilization Strategies in No-Tillage
Soybean, Corn and Common Bean Crops
Volnei Pauletti1*, Beatriz Monte Serrat1, Antonio Carlos Vargas Motta1, Nerilde Favaretto1 and Adilson dos Anjos2
1
Universidade Federal do Paraná; Departamento de Solos e Engenharia Agrícola; Rua dos Funcionários, 1540;
80035-050; Curitiba - PR - Brasil. 2Universidade Federal do Paraná; Departamento de Estatística; Curitiba - PR -
Brasil
ABSTRACT
Two research fields were conducted on a Haplohumox from 1998 and to 2005. The study aimed to evaluate the strategies for starter fertilizer application on corn, soybean and common bean yield as well as the accumulation of earlier dry matter for corn in a no-tillage crop rotation system in south of Brazil. There was no increase in the yield of soybean with phosphorus and potassium application for at least seven seasons, while corn and common bean showed increased yields with phosphorus, potassium and nitrogen application. For soybean, corn and common beans in no-tillage systems with high levels of phosphorus and medium of potassium, the starter fertilizer can be applied in any of the methods evaluated and in any of the period considered. The presence or absence of potassium in the furrow, phosphorus sources and row preparation components provided similar yields to corn, soybean and common bean.
Key words: Starter fertilizer, application technique, fertilizer management, crop rotation, no-till
* Author for correspondence: vpauletti@ufpr.br
INTRODUCTION
Fertilizers in soybean, common bean and corn generally are applied in furrows, when sowing. This strategy, besides increasing cost, increases the time necessary to sow which can affect the use of potential soil moisture and the most adequate period to sow; it also demands more machinery and concentrates labor efforts. Furrowers more commonly used to incorporate fertilizers in no-tillage system are double-disc opener and coulter opener and can make furrows about 70 mm and 150 mm deep, respectively, positioning fertilizer under seeds (Coelho, 1998; Silva, 2003).
The adoption of no-tillage system decreases the soil, water and nutrient losses by erosion (Cogo et al., 2003; Guadgnin et al., 2005) and increases the nutrient and organic matter concentration in superficial layers (Eckert and Johnson, 1985; Merten and Mielniczuk, 1991; Pauletti et al., 1995). There is high root concentration (Yibirin et al., 1993) and hyphae and mycorrhiza spores (Kabir et al, 1998) in the first centimeters in the superficial layer in no-tillage systems which increases the possibility of absorption of nutrients applied or accumulated in this layer. In no-tillage, the superficial nutrient application has propitiated similar yields to the furrow application in several crops (Oliveira et al., 1992, Kochhann et al., 1998; Bordoli and Mallarino, 1998; Borges and Mallarino 2000; Heckman and Kamprath, 1992; Sguario Jr., 2000, Howard et al., 2002) or even superior (Buah et al., 2000), but can vary acording to crop (Pöttker, 1999).
This long period study aimed to evaluate the effect of strategies in the starter fertilizer application on grain yield and its components in corn, soybeans and common beans in rotation and no-tillage system.
MATERIALS AND METHODS
The experiment was carried out in the Experimental and Demonstrative Field belonging to the ABC Foundation, in Castro, PR state, latitude 24º51’44.35’’ S, longitude 49º56’0.40”W
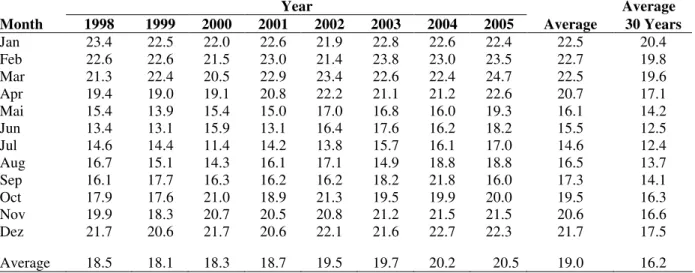
and altitude of 1030 m, south Brazil. According to Köppen, the climate of this region is Cfb (IAPAR, 2005). Table 1 shows the monthly average temperature during the study and the average of the last 30 years. The historical average temperatures of the colder months (May to August) varied from 12.4 to 14.2°C and in the warmer months (December to April) from 17.5 to 20.4°C. The annual average was 16.2°C. During this study, the average temperatures varied from 14.3 to 17.3°C in the colder months and between 20.6 and 22.5°C in the warmer months, with an annual average of 19°C.
In Table 2 the monthly average data of precipitation are shown for the period of study and the average of the last 30 years. The average annual rainfall was 1,573 mm; the drier months varied from 84 to 115 mm and the rainy months varied from 142 to 193 mm, which did not define a dry season. The average rainfall (September to April) varied from 134 to 213; the sum of these months was from 934 mm (1999/2000) to 1,455 mm (1998/99), with an average of 1,232 mm. The soil is characterized as Haplohumox typical, clayey texture, with smooth waved relief (EMBRAPA, 2002). Soil samples were collected before the experiment implantation and analyzed according the method described by Raij et al. (1987). According to Raij et al. (1996) the content of P, extracted with resin, was high (41 to 80 mg dm-3) and medium for K (1.6 a 3 mmol
c dm-3) in
the layer 0-20 cm (Table 3). The field was under no-tillage system for more than 10 years.
Table 1 - Monthly average temperature (oC) from 1998 to 2005 and monthly average of the last 30 years in Castro,
PR state, ABC Foundation.
Year Average
Month 1998 1999 2000 2001 2002 2003 2004 2005 Average 30 Years
Jan 23.4 22.5 22.0 22.6 21.9 22.8 22.6 22.4 22.5 20.4
Feb 22.6 22.6 21.5 23.0 21.4 23.8 23.0 23.5 22.7 19.8
Mar 21.3 22.4 20.5 22.9 23.4 22.6 22.4 24.7 22.5 19.6
Apr 19.4 19.0 19.1 20.8 22.2 21.1 21.2 22.6 20.7 17.1
Mai 15.4 13.9 15.4 15.0 17.0 16.8 16.0 19.3 16.1 14.2
Jun 13.4 13.1 15.9 13.1 16.4 17.6 16.2 18.2 15.5 12.5
Jul 14.6 14.4 11.4 14.2 13.8 15.7 16.1 17.0 14.6 12.4
Aug 16.7 15.1 14.3 16.1 17.1 14.9 18.8 18.8 16.5 13.7
Sep 16.1 17.7 16.3 16.2 16.2 18.2 21.8 16.0 17.3 14.1
Oct 17.9 17.6 21.0 18.9 21.3 19.5 19.9 20.0 19.5 16.3
Nov 19.9 18.3 20.7 20.5 20.8 21.2 21.5 21.5 20.6 16.6
Dez 21.7 20.6 21.7 20.6 22.1 21.6 22.7 22.3 21.7 17.5
Table 2 - Monthly average precipitation (mm) from 1998 to 2005 and monthly average of the last 30 years in
Castro, PR state, ABC Foundation.
Year Average
Month 1998 1999 2000 2001 2002 2003 2004 2005 Average 30 Years
Jan 267 227 120 193 213 181 261 245 213 193
Feb 270 229 313 275 113 200 104 34 192 156
Mar 458 121 104 141 68 152 185 63 162 142
Apr 196 103 19 72 29 145 228 103 112 111
Mai 67 91 45 176 192 44 328 160 138 125
Jun 97 83 153 171 9 42 97 111 95 127
Jul 76 144 92 127 68 115 173 70 108 90
Aug 183 5 141 73 119 24 18 67 79 84
Sep 334 110 174 114 201 87 88 285 174 126
Oct 236 78 185 265 185 120 256 258 198 146
Nov 28 76 172 144 214 215 128 95 134 116
Dez 177 113 215 174 149 235 162 48 159 158
Total 2,388 1,382 1,733 1,925 1,558 1,558 2,027 1,539 1,764 1,573
Table 3 - General chemical and textural analyses of the area, prior to the experiment implantation (1998).
Depth pH P† OC‡ K Ca Mg V§ Al Clay¶ Sand¶ Silt¶
cm CaCl2 mg dm-3 g dm-3 _ mmolc dm-3 _ __ % __ _____ g kg-1 _____
0-5 5.9 122 38 4.0 66 39 78 0 607 136 257
5-10 5.4 43 34 2.6 56 32 64 0 622 136 242
10-30 5.1 11 28 1.4 34 16 47 1,9 627 150 223
0-20 5.2 51 30 2.2 43 30 60 0 616 131 253
†Anionic resin; ‡Organic Carbon; §Basis saturation; ¶Pipette method.
Two experiments were conducted simultaneously during the seasons 1998/99 to 2004/05. Each experiment had an area of 50x50 m. The objective of having duplicates was to eliminate partially the effect of the year over the crops, since two of the evaluated crops were cultivated each year. The
adopted crop rotation was black oat (Avena
strigosa L.)/soybean/black oat/corn/wheat
(Triticum aestivum L.)/common bean. The study
started with soybean in one of the experiment and corn in the other one. Five seasons of corn, four of soybean and four of common bean were evaluated. In 2000, the data about soybean were not considered due to problems in the plant population. The spacing between the rows was 0.8 m for corn and 0.4 m for soybean and common bean. The corn sowing was done on 10/10/1998,
29/09/1999, 11/10/2001, 28/09/2002 and
22/10/2004. The soybean sowing was done on
03/11/1998, 27/11/2001, 11/12/2003 and
25/11/2004, and the common bean sowing was done on 21/12/1999, 07/12/2000, 27/12/2002 and 05/01/2004.
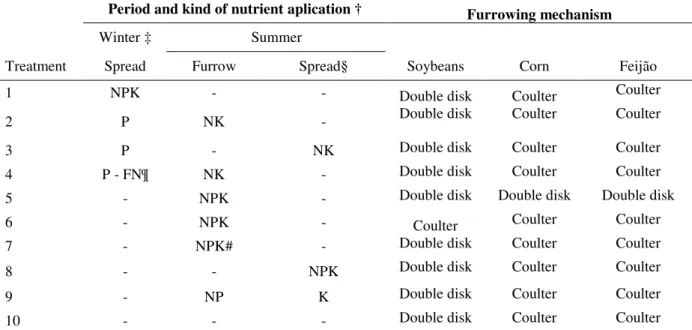
For each experiment, the same treatment was carried out (Table 4), combining P sources,
furrowing mechanisms and kinds and period of mineral fertilizer application. For corn and common bean, nitrogen (N), phosphorus (P) and potassium (K) were applied; for soybean, just P and K were applied. Urea, KCl and triple superphosphate as N, P and K sources were used, respectively. The exceptions were treatment 4, with natural phosphate instead of triple superphosphate, and treatment 10, without fertilizers. The treatment 10 was conducted to evaluate the effect of fertilizers on crops. The natural phosphate used was from North Carolina, up to the 2001/02 season, after this, phosphate from Gafsa was used, both in the milled form, and the total P content was considered to the determination of quantity to be applied. Immediately before the application, the mixture of these was prepared in order to obtain the necessary quantity per hectare to apply in the furrows during the sowing of each crop (Table 5), according to the treatments.
depth; and the double disk opener, one of 339 mm (14”) and other of 363 mm (15”). Both the furrowing devices worked aligned to the seed furrow, the first device put the fertilizer about 5 or 6 cm below the seeds, while the second (double disk) put the fertilizer about 2 or 3 cm below the seeds.
Since the application strategies were analyzed for the summer crops, to the wheat fertilizers in the winter were spread manually before sowing in all the plots (Table 4). The wheat fertilizer application was based in the reposition of P and K exported by the harvest, according to Pauletti (1998), and additionally the fertilizer to winter on treatments 1,
2, 3 and 4 (Table 4). The black out cover crop did not receive fertilizer application except those proposed to winter in the same treatments 1, 2, 3 and 4.
The experimental design was a randomized block, with four blocks and 10 treatments. The size of each experimental unit (parcel) was 5.55 x 12.5 m, and the useful area was 3.2 x 8.5 m (27.2 m2). All
the evaluations were done in the useful area of the plot. The wheat yield was evaluated only to further determination of nutrient exportation; it was obtained harvesting nine rows, spaced 17 cm, 5 meters each.
Table 4 - Period and kind of fertilization and furrowing devices per treatment.
Period and kind of nutrient aplication † Furrowing mechanism
Winter ‡ Summer
Treatment Spread Furrow Spread§ Soybeans Corn Feijão
1 NPK - - Double disk Coulter Coulter
2 P NK - Double disk Coulter Coulter
3 P - NK Double disk Coulter Coulter
4 P - FN¶ NK - Double disk Coulter Coulter
5 - NPK - Double disk Double disk Double disk
6 - NPK - Coulter Coulter Coulter
7 - NPK# - Double disk Coulter Coulter
8 - - NPK Double disk Coulter Coulter
9 - NP K Double disk Coulter Coulter
10 - - - Double disk Coulter Coulter
†In soybean N was not applied; ‡Immediately before sowing, without incorporation; §Immediately after sowing; ¶Natural phosphate of North Carolina up to the crop 2001/02 and Gafsa after this.
Table 5 - Quantity of nutrients applied and cultivars to each crop.
Crop (cultivar) N† P2O5 K2O Zn
--- kg ha-1 ---
Corn (XL 214) 30 60 60 3
Soybean(EMBRAPA 133) 00 40 40
Common bean (regular Carioca) 30 60 40
†Application of 90 and 35 kg ha-1 N in top dress fertilization in V3/V4, to corn and common bean, respectively, except treatment
10.
The corn, soybean and common bean were harvested in four rows, each five meters, weighed and corrected to 13% moisture and transformed per hectare. The a thousand grains mass (TGM) was obtained through accounting and weighting of 250 grains obtained after processing the sample for
The height of pod insertion in soybeans or ear insertion of corn were determined, measuring the distance between the soil and insertion of the first pod in the main stalk (soybean), or the first ear (corn) in five plants in sequence in two rows, total 10 plants per plot, while the plant height was obtained measuring the distance from the soil to the insertion of the last leaf, for soybean in the main stalk, in the same plants the height of pod and ear insertions were determined.
The biomass production in the beginning of the corn growth in the last crop (2004/05) was determined by cutting five plants in sequence approximately one centimeter from soil, on day 35 and 47 after the emergence and determining the dry matter by putting the plants in a forced air
oven at 65oC until constant weight.
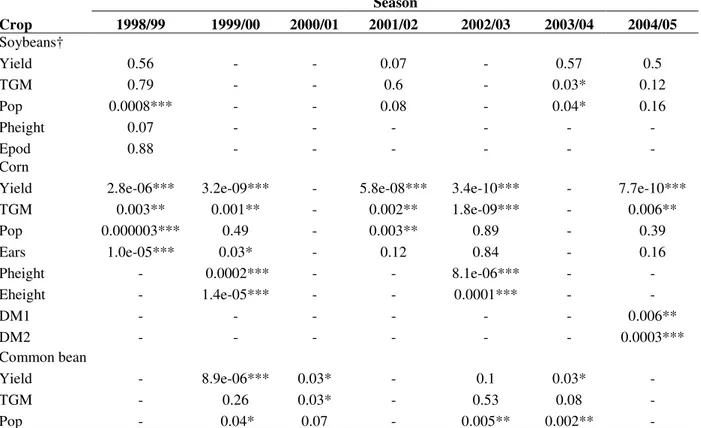
Before statistical analysis the discrepant data (outliers) were eliminated after being identified through the criterion of standard normal distribution, using the criterion of more or less three times the standard deviation. For the statistical treatment of the data, the variance analysis per year and crop was performed individually, using the randomized complete block design. In case of significant variance analysis, the Scheffé test was applied in order to evaluate the contrasts (Montgomery, 2001). A confidence level of 5% was considered. The contrasts are presented in Table 6. The statistical analyses were done in the software R 2.1.1 (R Development Core Team, 2005).
Table 6 - Contrasts used in the evaluation of experimental data and objectives.
Contrast Objective Treatments†
I To evaluate the effect of fertilization 1,2,3,4,5,6,7,8,9 vs
10 II To evaluate the fertilization in the winter comparing to summer 1 vs 8 III With P application in the winter, to compare the NK application in the winter
with the summer application 1 vs 3
IV With P application in the winter, to compare the NK in furrow with NK in
total area in the summer 2 vs 3
V To compare P from natural phosphate with soluble P 2 vs 4
VI To compare NP in furrow with NP out of furrows in summer 5 and 6 vs 7 and 8
VII To compare furrowing devices 5 vs 6
VIII To evaluate the K application in furrows comparing to K out of furrows 5 and 6 vs 9
IX To compare NPK in bands with NPK in total area 7 vs 8
†According to Table 4.
RESULTS AND DISCUSSION
The effect of treatments for soybean variables occurred only in the plant population (Pop) in 1998/99 and 2003/04 and on the TGM in 2003/04 (Table 7). However, the contrast analyses done for this crop did not show significance for all crop yields (Table 8) and for the other variables (data not shown). There was no effect of fertilizer over soybean yields (Table 8), which were higher than Parana state average (from 2,550 to 2,880 kg ha-1)
for the period studied (Conab, 2006) as well as the regional yield of the last three agricultural years evaluated in this study, which varied from 2,360 to
3,040 kg ha-1 (SEAB, 2006).
The high yields could be related to the climate
Table 7 - P-values of variance analyses (ANOVA) for soybean, corn and common bean variables. Season
Crop 1998/99 1999/00 2000/01 2001/02 2002/03 2003/04 2004/05
Soybeans†
Yield 0.56 - - 0.07 - 0.57 0.5
TGM 0.79 - - 0.6 - 0.03* 0.12
Pop 0.0008*** - - 0.08 - 0.04* 0.16
Pheight 0.07 - - - -
Epod 0.88 - - - -
Corn
Yield 2.8e-06*** 3.2e-09*** - 5.8e-08*** 3.4e-10*** - 7.7e-10***
TGM 0.003** 0.001** - 0.002** 1.8e-09*** - 0.006**
Pop 0.000003*** 0.49 - 0.003** 0.89 - 0.39
Ears 1.0e-05*** 0.03* - 0.12 0.84 - 0.16
Pheight - 0.0002*** - - 8.1e-06*** - -
Eheight - 1.4e-05*** - - 0.0001*** - -
DM1 - - - 0.006**
DM2 - - - 0.0003***
Common bean
Yield - 8.9e-06*** 0.03* - 0.1 0.03* -
TGM - 0.26 0.03* - 0.53 0.08 -
Pop - 0.04* 0.07 - 0.005** 0.002** -
†TGM: thousand grain mass; Pop: plants per ha, Ears: ears per ha; Pheight: plant height; Epod: height of first pod insertion; AltEsp: height of ear insertion; DM1 and DM2: dry matter of 3 plants day 35 and 47 after emergence, respectively.
Table 8 - Effect of fertilization in the yields (kg ha-1) of corn, soybean and common bean (contrasts using the
Scheffé test).
†Treat 10: average of the treatment without fertilizer; others treatments: average over all treatments, except the treatment 10; ‡ P: * <0.05, ns: not significant.
No difference among fertilizer application methods was also obtained by Oliveira et al. (1992) and Lantmann et al. (1996). Working with a Rhodic Ferralsol with high P and K content, Lantmann et al. (1997) found that in the succession wheat/soybean the application of 50 kg ha-1 of P2O5 and 30 kg ha-1 of K2O only in the
wheat crop was enough to keep the yield similar to the treatment that had fertilizer for soybean (60 kg ha-1 of P
2O5 and 100 kg ha-1 of K2O) and in the
wheat (50 kg ha-1 of P2O5 and 30 kg ha-1 of K2O)
during four years. In the areas with 10 years of no-tillage system and in rotation corn/soybean, Buah et al. (2000) observed equal or higher yields for
Crop Season
Contrast† 1998/99 1999/00 2000/01 2001/02 2002/03 2003/04 2004/05 Soybeans
Trat 10 3,130 - - 3,211 - 3,180 2,869
vs. ns‡ ns ns ns
Other trat 3,171 - - 3,564 - 3,245 3,031
Corn
Trat 10 4,355 5,997 - 6,165 6,004 - 4,051
vs. * * * * *
Other trat 7,328 10,450 - 10,280 10,215 - 8,330
Common bean
Trat 10 - 2,488 2,724 - 2,612 2,138 -
vs. * ns ns ns
soybeans when P and K were applied superficially compared to the furrow application, suggesting that corn and soybean fertilizer could be performed totally in the corn for soil with high or very high nutrients availability. These results indicated that in the areas with high content of P and K, the system fertilization can be implemented for soybean, where nutrient application could be performed independent on its kind (furrow or surface) and in precedent crops, supporting Parana state recommendation (EMBRAPA, 2006).
No difference between no-fertilized (treatment 10) and fertilized soybean crop (Tables 8) even after seven years suggested a high extraction capacity for residual fertilization of this crop. In contrast, Lantmann et al. (1996) found that it was possible to relinquish the soybean fertilization only when the wheat was fertilized. What can explain the difference in the obtained results is the kind of soil in these studies, due to the different P and K availability for the plants. Martins et al. (2004) observed a great variation in the potential supply of K from non-exchangeable form to wheat plants in soils of the region from actual work, where up to 54% was absorbed by the plants. In their study, in Haplohumox, the non-exchangeable K contributed with 10%.
The superficial nutrient concentration and the higher moisture in this layer due to the presence of straw (Muzzili 1983; Stecker et al., 1988) could also contribute positively to the nutrient absorption by the soybean and consequently affect the absence of effects of the fertilizer application, besides the favorable climatic conditions during the crops (Tables 1 and 2). Lack of significant difference occurred between the furrow devices over yield and other variables, possibly indicating the absence of physical limitation.
Like soybean, the yields for common bean were superior to the average of the Parana state that varied from 850 to 1,340 kg ha-1 in the same
period in which this study was done (Conab, 2006) or in this region, from 1,290 to 1,840 kg ha-1 in the
last two agricultural years this study evaluated (SEAB, 2006), respectively. Considering that the common bean yield in the treatment without fertilizer was always inferior (Table 8), although there was no significance in the crops 2000/01, 2002/03 and 2003/04. This difference also could be due to N application considering that the treatment without fertilizer (Treatment 10) this nutrient was not applied. On average, the treatment
propitiated yields 27% higher than the one without fertilizers.
Differently from the results for soybeans, the treatment affected the common bean yield in three of the four evaluated crops (Table 7). The same occurred to the final plant population while the TGM was affected only in the crop 2002/03. However, in the contrast analysis (Table 8), only the yield in the first agricultural year was significant to the contrast I, which compared the treatment without fertilizer (treatment 10) with the other ones.
In general, the common bean plant is considered as highly affected by P (Fageria et al., 2004) and lowly affected by K (Sguário Jr., 2000). This suggests that the fertilization effects were especially due to P or even N. Common bean yield response to N application has been shown to be variable with positive results (Silveira and Damasceno, 1993; Barbosa Filho and Silva, 2000) or no effect (Arf et al., 1999). It is important to define which is the minimum P dose demanded for each season and the remainder can be applied in other culture or in the same season, considering the crop rotation adopted.
Corn was the only crop in which the yield and TGM were affected by the treatments in all the evaluated years (Table 7). The yields (Table 8) were highly superior to the state average (from 3,780 to 5,600 kg ha-1) in the same period in which
this data was developed (Conab, 2006), and higher than the regional yield in the last three years of this study which varied from 6,360 to 6,700 kg ha
-1 (SEAB, 2006). This demonstrates the high
productive potential of this crop in the region. Yield and TGM increased with fertilization according to the contrast analyses presented in Tables 8 and 9, without significant difference between the application strategies (data not shown).
Table 9 - Effect of fertilization on the thousand grain mass (g) for corn (contrasts using the Scheffé test).
Contrast† Season
1998/99 1999/00 2001/02 2002/03 2004/05
Trat 10 257 322 346 311 273
vs. *‡ * * * *
Other trat 290 369 392 393 307
†Trat 10: average of the treatment without fertilizer; Other trat: average of all treatments, except the treatment 10; ‡ P: * <0.05.
Working with a clayey oxisol with high P content under no-tillage and in the same region of actual work, Sá (2004) obtained increases between 8 and 19% in the accumulated yield of two corn crops in rotation with wheat and soybean when applying P in furrows. This yield increment was far below than near 70% observed in this work (Table 8) what reinforced the possibility of larger effects of N. Nevertheless, considering other comparisons among the treatments, one could infer that the starter fertilization in the corn crop could be performed with furrowing devices, period and application ways, in agreement with Bordoli and Mallarino (1998) who studied P and with Pavinato and Ceretta (2004) who studied the ways and periods of P and K application in a succession of wheat/corn.
Similarity of response between P sources evaluated could be related to extractable P level since high P contents in soil generally favor equality between the soluble sources and natural phosphates (Sousa and Lobato, 2004).
The presence of the K application in furrows also did not interfere in the yield and other evaluated variables, disagreeing with Fancelli and Dourado Neto (2005), who did not recommend to apply doses up to 50 kg ha-1 of K
2O through KCl due to
its saline effect. Heckman and Kamprath (1992), working in sandy soil with high K content where K was broadcast applied and incorporated, with or without complementary application in the sowing
furrow, obtained an increase in the corn yield with K application only when there was hydric deficit with no difference for the way of application. The abundance of straw on the soil surface of experimental area also could influence the nutrient availability for corn, as observed by Yibirin et al. (1993). The authors found reduction of K response and plant demand by this nutrient applied in the furrows, where a larger amount of straw was found on the surface due to the higher root growth in those plants.
The corn dry mass at the beginning of the crop development was influenced significantly by the treatments (Table 7), with lower values occurring in the treatment without fertilizer (Table 10). But the contrast analysis, therefore, was not significant (data not shown), which disagreed with several studies that although did not find differences in
corn yield, obtained significant biomass
accumulation in the initial phases of the crop development when the fertilizer was applied locally (Anghinoni, 1992; Model and Anghinoni, 1992; Silva et al., 1993; Bordoli and Mallarino, 1998; Mallarino et al., 1999; Kaiser et al., 2005). The high P and medium K contents in the soil and the superficial concentrations of these nutrients, associated to the high initial moisture due to regular rainfalls occurred in the beginning of the crop development (Table 2- year 2004 and 2005), could justify the difference of this study compared to the others.
Table 10 -Average dry mass per corn plant (DM), due to the strategy of fertilization.
Trat 1 2 3 4 5 6 7 8 9 10
Dry mass - g plant-1
DM1† 5.7 6.7 6.7 6.3 8.4 7.8 7.6 6.6 6.6 4.9
DM2† 25.2 30.3 33.1 24.6 33.9 28.7 35.3 29.9 27.4 20.7
The final number of plants was lower in the treatment without fertilizers (treatment 10) compared to other treatments only in the season 1998/99 and 2001/02, while the final number of ears was lower in treatment 10 compared to the others only in the season 1998/99 (Table 11), possibly due to the less nutrient availability to the plants in treatment 10. The plant height and ear insertion for corn were also influenced in the two seasons in which these variables were measured (Table 7), differences occurring only with applying fertilizers (Table 11). Possibly these higher values for the number of plants and ears
and plant height are related mainly to the N covering application.
The temperature (Table 1) seemed to have no effect in the methods of application, as suggested by Stecker et al. (1988).
Considering the data obtained in this work, the fertilization in the no-tillage system can be performed independent of period and method of application, using natural phosphate as P source and with or without the application of K in furrows for the studied region when the P content was high and K content was medium in the soil.
Table 11 - Effect of fertilization in the plant number (Pop) and ears (Ears) per hectare and in the plant height
(Pheight) and ear insertion (Eheight) for corn (contrasts using the Scheffé test).
Contrast† Season Contraste† Season
1998/99 2001/02 1999/00 2002/03
Value Value cm cm
Pop Pheight
Trat 10 43438 48750 Trat 10 200 190
vs. *‡ * vs. * *
Other trat 59462 61904 Other trat 217 217
Ear Eheight
Trat 10 43750 56250 Trat 10 90 91
vs. * ns vs. * *
Other trat 57836 61319 Other trat 109 113
††Trat 10: average of the treatment without fertilizer; Other trat: average of all treatments, except the treatment 10. ‡ P: * <0.05; ns= not significant
CONCLUSIONS
The results obtained in this study indicated that the soybean crop was not affected by fertilization with P and K for at least seven years when the contents of P and K were high and medium in the soil, respectively. The corn and common bean yield were increased by nitrogen, phosphorus and potassium application. The application of fertilizers for soybean, corn and common bean in the established no-tillage system and with high P content and medium K content could be performed independent of the localization (furrow or total area) and period (winter and summer). Although there was medium K content, there was no need to apply this in the sowing furrow, not even the presence of this nutrient in the furrow interfered negatively on the yields of corn, common bean and
soybean. The natural phosphate provided the same yield as triple superphosphate provides for these crops. The furrowing devices with double disk or coulter had similar results for corn, common bean and soybean. The corn dry mass in the beginning of the crop development was not influenced by the localization and period of fertilizer application.
ACKNOWLEDGEMENTS
RESUMO
Dois ensaios foram conduzidos simultaneamente a campo entre os anos de 1998 e 2005, em um Latossolo bruno, no sul do Brasil. O objetivo foi avaliar o efeito de estratégias de aplicação de adubo mineral de semeadura sobre a produtividade de milho, soja e feijão, bem como sobre o acúmulo inicial de matéria seca no milho, em uma rotação de culturas e no sistema plantio direto. A ausência de aplicação de fósforo e potássio por sete anos não diminuiu a produtividade da soja, mas a aplicação destes nutrientes e nitrogênio aumentou a produtividade de milho e feijão. Para soja, milho e feijão, sob sistema plantio direto e altos teores de fósforo e médios de potássio, a adubação de semeadura pode ser realizada de todas as formas avaliadas e em qualquer época considerada. A presença ou não de potássio no sulco, as fontes de fósforo e os mecanismos sulcadores proporcionaram produtividades semelhantes de milho, soja e feijão.
REFERENCES
Anghinoni, I. (1992), Uso de fósforo pelo milho afetado pela fração de solo fertilizada com fosfato solúvel. R. Bras. Ci. Solo, 16, 349-353.
Arf, O.; Silva, L.S.; Buzetti, S.; Alves, M.C.; Sá, M.E.; Rodrigues, R.A.F. and Hernadez, F.B.T. (1999), Efeito da rotação de culturas, adubação verde e nitrogenada sobre o rendimento do feijão. Pesq. Agropec. Bras., 34, 2029-2036.
Barbosa Filho, M.P. and Silva, O.F. (2000), Adubação e calagem para o feijoeiro irrigado em solo de cerrado.
Pesq. agropec. bras., 35, 1317-1324.
Bordoli, J.M. and Mallarino, A.P. (1998), Deep and shallow banding of phosphorus and potassium as alternatives to broadcast fertilization for no-till corn.
Agron. J., 90, 27-33.
Borges, R. and Mallarino, A.P. (2000), Grain yield, early growth, and nutrient uptake of no-till soybean as affected by phosphorus and potassium placement.
Agron. J., 92, 380-388.
Broch, D.L. and Chueiri, W.A. (2005), Estratégia de adubação: cultura da soja cultivada sob sistema plantio direto. Maracaju: Fundação MS/Manah, 53
pp.
Buah, S.S.J.; Polito, T.A. and Killorn, R. (2000), No-tillage soybean response to banded and broadcast and direct an residual fertilizer phosphorus and potassium applications. Agron. J., 92, 657-662.
Bundy, L.G. and Andraski, T.W. (2001), Starter fertilizer response on high and very high testing soils.
Better Crops., 85, 3-4.
Chaib, S.L.; Bulisani, E.A. and Castro, L.H.S.M. (1984), Crescimento e produção do feijoeiro em resposta à profundidade de aplicação do adubo fosfatado. Pesq. Agropec. Bras., 19, 817-822.
Coelho, J.L.D. (1998), Avaliação de elementos sulcadores para semeadoras-adubadoras utilizadas em sistemas conservacionistas de manejo do solo.
Msc Thesis, Faculdade de Engenharia Agrícola, Universidade Estadual de Campinas, Campinas. 71pp.
Cogo, N.P.; Levien, R. and Schwarz, R.A. (2003), Perdas de solo e água por erosão hídrica influenciadas por métodos de preparo, classes de declive e níveis de fertilidade do solo. R. Bras. Ci. Solo, 27, 743-753.
CONAB (2006), Companhia Nacional de
Abastecimento. Disponível em
<http://www.conab.gov.br/download/safra> Accessed on 15 de feb. 2006.
Correa, J.C.; Mauad, M. and Rosolem, C.A. (2004), Fósforo no solo e desenvolvimento de soja influenciados pela adubação fosfatada e cobertura vegetal. Pesq. Agropec. Bras., 39, 1231-1237.
Eckert, D.J. and Johnson, J.W. (1985), Phosphorus fertilization in no-tillage corn production. Agron. J.,
77, 789-792.
EMBRAPA (2002), Caracterização dos solos do município de Castro. Elabored by: Fasolo, P.J.;
Carvalho, A.P.; Pötter, R.O.; Bognola, I.A.; Bhering, S.B. and Martorano, L.G., Rio de Janeiro: Embrapa Solos, Boletim de pesquisa e desenvolvimento 09. EMBRAPA (2005), Tecnologias de produção de soja:
Paraná 2006. Londrina: EMBRAPA Soja, 208 pp.
Fageria, N.K.; Barbosa Filho, M.P. and Stone, L.F. (2004), Nutrição de fósforo na produção de feijoeiro. In-Simpósio sobre fósforo na agricultura brasileira,
eds. T. Yamada and R.S. Abdalla. Piracicaba: POTAFÓS, pp. 435-455.
Fancelli, A.L. and Dourado Neto, D. (2005), Produção de milho em terras baixas. In: Milho: tecnologia e produção, eds. A.L. Fancelli and D. Dourado Neto.
Piracicaba: ESALQ/USP/LVP, pp. 21-33.
Fontoura, S.M.V. (2005), Adubação nitrogenada na cultura do milho em Entre Rios, Guarapuava, Paraná. Guarapuava: Fundação Agrária de Pesquisa
Agropecuária, 94 pp.
Fontoura, S.M.V.; Bayer, C.; Ernani, P.R. and Clazer, E.R. (1999), Adubação nitrogenada na cultura do milho no sistema plantio direto: aplicação na semeadura vs em cobertura. In: Reunião Técnica Catarinense de Milho and Feijão, 2, 1999, Lages.
Gordon, W.B. (1999), Starter fertilizers containing potassium for ridge-till corn and soybean production.
Better Crops., 83, 22-23.
Guadagnin, J.C.; Bertol, I.; Cassol, P.C. and Amaral, A.J. (2005), Perdas de solo, água e nitrogênio por erosão hídrica em diferentes sistemas de manejo. R. Bras. Ci. Solo, 29, 277-286.
Heckmann, J.R. and Kamprath, E.J. (1992), Potassium accumulation and corn yield related to potassium fertilizer rate and placement. Soil Sci. Soc. Am. J., 56,
141-148.
Howard, D.D.; Essington, M.E. and Logan, J. (2002), Long-term broadcast and banded phosphorus fertilization of corn produced using two tillage systems. Agron. J., 94, 51-56.
IAPAR (2005), Cartas climáticas do estado do Paraná
- 2000. Disponível em:
<http://www.iapar.br/Sma/Cartas_Climaticas>. Accessed on 23 de jan..
Kabir, Z.; O'Halloran, I. P.; Widden, P. and Hamel, C. (1998), Vertical distribution of arbuscular mycorrhizal fungi under corn (Zea mays L.) in no-till
and conventional tillage systems. Mycorrhiza, 8,
53-55.
Kaiser, D.E.; Mallarino, A.P. and Bermudez, M. (2005), Corn grain yield, early growth, and early nutrient uptake as affected by broadcast and in-furrow starter fertilization. Agron. J., 97, 620-626.
Kaspar, T.C.; Brown, H.J. and Kassmeyer, E.M. (1991), Corn root distribution as affected by tillage, wheel traffic, and fertilizer placement. Soil Sci. Soc. Am. J.,
55, 1390-1394.
Klepker, D. and Anghinoni, I. (1995), Crescimento radicular e aéreo do milho em vasos em função do nível de fósforo no solo e da localização do adubo fosfatado. R. Bras. Ci. Solo, 19, 403-408.
Kochhann, R.A.; Denardin, J.E. and Faganello, A. (1998), Adubação profunda no sistema plantio direto.
Revista Plantio Direto, julho/agosto, pp. 35-36.
Lantmann, A.F.; Oliveira, M.C.N.; Roessing, A.C. and Sfredo, G.J. (1997), Produtividade do trigo em sucessão a soja não fertilizada em Latossolo roxo distrófico. Pesq. Agropec. Bras., 32, 257-265.
Lantmann, A.F.; Roessing, A.C.; Sfredo, G.J. and Oliveira, M.C.N. (1996), Adubação fosfatada e potássica para sucessão soja-trigo em latossolo roxo
distrófico sob semeadura direta. Londrina:
EMBRAPA Soja, Circular Técnica 15. 44 pp.
Martins, R.; Melo, V.F. and Serrat, B.M. (2004), Métodos de determinação da disponibilidade de potássio para a cultura do trigo em solos dos Campos Gerais, Estado do Paraná. Revista Ceres, 51, 787-801.
Merten, G.H. and Mielniczuk, J. (1991), Distribuição do sistema radicular e dos nutrientes em latossolo roxo sob dois sistemas de preparo de solo. R. Bras. Ci. Solo, 15, 369-374.
Montgomery, D. C. (2001), Design and analysis of experiments, John Wiley and Sons, 5 ed. 684 pp.
Mullins, G.L.; Reeves, D.W.; Burmester, C.H. and Bryant, H.H. (1994), In-row subsoiling and potassium placement effects on root growth and potassium content of cotton. Agron. J., 86, 136-139.
Muzilli, O. (1983), Influência do sistema de plantio direto, comparado ao convencional, sobre a fertilidade da camada arável do solo. R. Bras. Ci. Solo, 7, 95-102.
Oliveira, F.A.; Silva, J.J.S.; Vilela, L. and Sousa, D.M.G. (1992), Doses e métodos de aplicação de potássio na soja em solo dos cerrados da Bahia. Pesq. Agropec. Bras., 27, 1485-1495.
Pauletti,V. (1998). Nutrientes: teores e interpretações.
Fundação Cargill, Campinas. 59 pp.
Pauletti,V. 2004. Nutrientes: teores e interpretações.
Castro. 86 pp.
Pauletti, V. and Costa, L.C. (2000), Época de aplicação de nitrogênio no milho cultivado em sucessão à aveia preta no sistema plantio direto. Ciência Rural, 30,
599-603.
Pauletti, V.; Vieira, S.M.; Santos, A.F.; Oliveira, S.O. and Motta, A.C.V. (1995), Avaliação da fertilidade do solo em profundidade e da palhada em áreas sob plantio direto. In: Congresso Brasileiro de Ciência do Solo, 25, 1995, Viçosa. Anais. Soc. Bras. Ci. do Solo.
pp. 630-632.
Pavinato, P.S. and Ceretta, C.A. (2004), Fósforo e potássio na sucessão trigo/milho: épocas e formas de aplicação.Ciência Rural, 34, 1779-1784.
Pöttker, D. (1999), Aplicação de fósforo no sistema
plantio direto. Passo Fundo: EMBRAPA Trigo,
Boletim de pesquisa 2. 32 pp.
Prado, R.M.; Fernandes, F.M. and Roque, C.G. (2001), Resposta da cultura do milho a modos de aplicação e doses de fósforo, em adubação de manutenção. R. Bras. Ci. Solo, 25, 83-90.
R DEVELOPMENT CORE TEAM. R, (2005), A language and environment for statistical computing.
R Foundation for Statistical Computing, Vienna, Austria. ISBN 3-900051-07-0, URL http://www.R-project.org..
Raij, B.Van; Cantarella, H.; Quaggio, J.A. and Furlani, A.M.C. (1996), eds. Recomendação de calagem e adubação para o Estado de São Paulo. Campinas:
Instituto Agronômico de Campinas, Boletim técnico 100. 2 ed. 285 pp.
Raij, B.Van; Quaggio, J.A.; Cantarella, H.; Ferreira, M.E.; Lopes, A.S. and Bataglia, O.C. (1987), Análise química do solo para fins de fertilidade. Fundação
Cargill, Campinas. 170 pp.
Sá, J.C.M.(1995a), Fósforo: resposta das culturas de milho, trigo e soja no sistema plantio direto. In: Curso sobre manejo do solo no sistema plantio direto. Castro, 1995. Anais. Castro: Fundação ABC. pp.
Sá, J.C.M. (1995b), Nitrogênio: influência da rotação de culturas e resposta da cultura do milho em solos sob plantio direto. In: Curso sobre manejo do solo no sistema plantio direto. Castro, 1995. Anais. Castro:
Fundação ABC. pp. 213-227.
Sá, J.C.M. (2004), Adubação fosfatada no sistema plantio direto. In-Simpósio sobre fósforo na agricultura brasileira. In: Simpósio sobre fósforo na agricultura brasileira, eds. T. Yamada and R.S.
Abdalla. Piracicaba: POTAFÓS, pp. 201-222. SEAB (2006), Comparativo de área, produção e
produtividade. Secretaria de estado da agricultura e
do abastecimento - Paraná. Disponível em <http://www.pr.gov.br/seab/deral>. Accessed on 15 feb. 2006.
SEMEATO (2006), Disponível em
<http://www.semeato.com.br>. Accessed on 15 de feb. 2006.
Sguario Jr., J.C. (2000), Doses e formas de aplicação de potássio na cultura do feijoeiro em sistema de plantio direto na palha. Msc Thesis, Universidade
Federal do Paraná, Curitiba. 43 pp.
Silva, P.R.A. (2003), Mecanismos sulcadores de semeadora-adubadora na cultura do milho (Zea mays L.) no sistema de plantio direto. Msc Thesis,
Faculdade de Ciências Agronômicas – UNESP, Botucatu. 84 pp.
Silva, D.J.; Alvarenga, R.C.; Alvarez, V.H. and Soares, P.C. (1993), Localização de fósforo e de cálcio no solo e seus efeitos sobre o desenvolvimento inicial do milho. R. Bras. Ci. Solo, 13, 203-209.
Silveira, P.M. and Damasceno, M.A. (1993), Doses e parcelamento de K e de N na cultura do feijoeiro irrigado. Pesq. Agropec. Bras., 28, 1269-1276.
Sousa, D.M.G. and Lobato, E. (2004), Adubação fosfatada em solos da região do cerrado. In-Simpósio sobre fósforo na agricultura brasileira. eds. T.
Yamada and R.S. Abdalla. Piracicaba: POTAFÓS, pp. 157-200.
Stecker, J.A.; Sander, D.H.; Anderson, F.N. and Peterson, G.A. (1988), Phosphorus fertilizer placement and tillage in a wheat-fallow cropping sequence. Soil Sci. Soc. Am. J., 52, 1063-1068.
Tessaro, L.C.; Pauletti, V.; Marques, R. and Bortoleto, S. (2000), Efeito de formas de aplicação e fontes de nitrogênio na cultura do milho em solo arenoso, sob plantio direto. In: Reunião Brasileira de Fertilidade do Solo e Nutrição de Plantas, 25, 2000, Santa Maria. UFSM. (CD-ROM).
Yibirin, H.; Johnson, J.W. and Eckert, D.J. (1993), No-till corn production as affected by mulch, potassium placement, and soil exchangeable potassium.Agron. J., 85, 639-644.