A spreadsheet for calculation of ingredients for standardization of
requeijão
cremoso
[Planilha eletrônica para cálculos de ingredientes visando à padronização de requeijão cremoso]
R.C.S.N. Silva, V.P.R. Minim, A.N. Silva, A.F. Carvalho, L.A. Minim
Universidade Federal de Viçosa (UFV) Viçosa, MG
ABSTRACT
The standardization of requeijão cheese quality characteristics is a processing stage which is directly influenced by the chemical composition of the raw material. Fat and water concentrations are the main factors that cause variation in quality properties of the requeijão and, when not thoroughly controlled, may cause a lack in standardization of the food. Calculations of ingredients for effective standardization must be made in relation to the final product through of iterative calculations, which makes the manual process unfeasible. Thus, the objective of the present study was to develop a spreadsheet for ingredient calculation, with restrictions being the different concentrations of fat and water in order to standardize the final products. The spreadsheet was developed using the Excel 2007® Solver function, with just four input
data: quantity of mass, water and fat content of the mass and fat content of the cream. The optimal solution was that which maximizes the amount of final product while meeting the stipulated constraints of fat and water. Results obtained with the spreadsheet were validated by processing the requeijão cheeses and comparison of the theoretical and practical parameters using the t-test. There was no significant difference between fat and water contents (p>0.10) estimated and verified in practice. Therefore, the use of the spreadsheet proved to be efficient for standardization of requeijão formulations.
Keywords: quality control, calculation of ingredients, excel, solver function
RESUMO
A padronização das características de qualidade do requeijão é uma etapa do processamento, a qual é diretamente influenciada pela composição química da matéria-prima. Os teores de gordura e água são os principais fatores que acarretam variação nas propriedades de qualidade do requeijão e, quando não controlados minuciosamente, causam despadronização do alimento. Os cálculos de ingredientes para efetiva padronização devem ser realizados em relação ao produto final, por meio de cálculos iterativos, o que inviabiliza o processo manual. Nesse contexto, o presente trabalho teve por objetivo desenvolver uma planilha eletrônica para cálculo de ingredientes, tendo como restrições diferentes teores de gordura e água, visando à padronização dos produtos. A planilha foi desenvolvida utilizando-se o suplemento Solver do Excel 2007®, sendo que os únicos parâmetros de entrada após a implementação da planilha
foram: quantidade de massa, teor de gordura e de água na massa e teor de gordura do creme. A solução ótima foi a maximização da quantidade do produto final que satisfizesse as restrições dos teores de gordura e água estipulados. Os resultados obtidos pela planilha foram validados por meio do processamento dos requeijões e da comparação dos parâmetros teóricos e práticos utilizando-se o teste t. Não houve diferença significativa entre os teores de gordura e de água (p>0,10) estimados e verificados na prática. Portanto, a utilização da planilha eletrônica se apresenta eficiente para padronização de formulações de requeijão cremoso.
Palavras-chave: controle de qualidade, cálculo de ingredientes, Excel, Solver
INTRODUCTION
The technology of processed cheeses initiated in the early twentieth century, with the need to deter microbial and enzymatic processes in Swiss and German cheeses, so as to facilitate exports to countries with hot climates (Garruti et al., 2003). Requeijão cheese is a type of cheese originating in Brazil, produced on a large scale within the country (Alves et al., 2007) and, according to decree 359/97, must be obtained by fusing a washed mass of curd, obtained by acid and/or enzyme coagulation of milk, with addition of cream and/or butter and/or anhydrous milk fat and/or butter oil (Brazil, 1997).
Products on the market denominated requeijão cremoso possess different concentrations of fat and water, presenting extremely varied textures (Gallina et al. 2008; Gomes and Penna, 2010). The creamy consistency of the requeijão is due to the absence of a rigid protein matrix as a result of strong agitation and homogenization to which
the requeijão is subjected during processing
(Vélez-ruiz and Barbosa-Cánovas, 1997). This mechanical treatment is necessary for hydration of proteins, which together with the thermal treatment, curd type, content of fat and emulsifying salts, pH and cooking time of the mass will determine the texture of the final product, which is recognized as one of its key quality attributes (Baroni et al., 1999).
The variation in composition between the different requeijão cheeses found in the market is related to a broad spectrum of consistency of these products (Metzger and Mistry, 1995, Cunha et al., 2006) and, when not properly controlled, it is the main factor responsible for the lack of standardization in quality characteristics of this product (Cavalcante and Costa, 2005).
For effective standardization of foods the percentage of ingredients must be obtained in relation to the final product (Van Dender, 2006), thus, calculation of the quantities to be added during processing is a complex and arduous task to be performed manually. It is therefore necessary to implement a spreadsheet for this purpose. The Solver function is a tool within an
2006; Martins and Silva, 2009). There are other specific software to solve this kind of problem, but the solver function has the advantage of using a user-friendly interface and has widespread use, in addition to easy integration with other tools because it is a supplement of Excel® (Brown, 2001; Dasgupta , 2008).
In this context, the objective of this study was to develop a spreadsheet in Excel® software using
the Solver function to calculate formulations of requeijão cremoso with the different restrictions in regards to fat and water contents, aiming for the standardization of this product.
MATERIAL AND METHODS
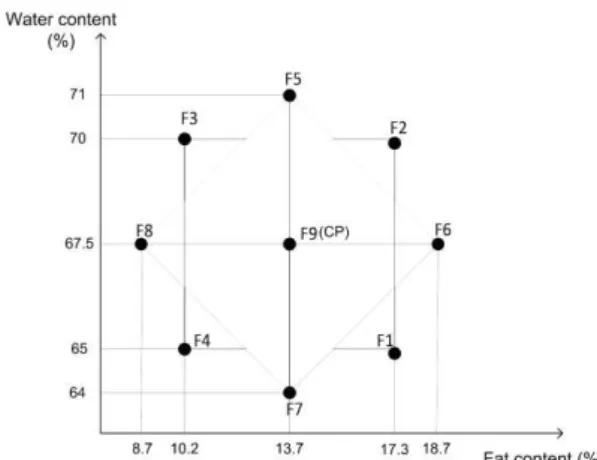
To define the composition of light requeijão cheeses, the Central Composite Rotatable Design (CCRD) was used with two factors (fat and water) at two levels (22), plus four axial points
(2x2) and one central point. The central point was repeated three times to estimate the pure error, totaling 11 trials (Fig. 1).
Figure 1. Disposition of the experimental points in the Central Composite Rotatable Design (CCRD).
The requeijão processing was performed at the pilot plant in the Departamento de Tecnologia de Alimentos of Universidade Federal de Viçosa. Products were composed of the mass (raw skim milk and lactic acid), water, milk cream, whey protein concentrate (WPC), NaCl, emulsifying salt and preservatives (potassium sorbate and nisin). The concentration of whey protein concentrate (WPC 34 Gemacom) was set at 2% in relation to the final product for all formulations. Concentrations of NaCl (0.80%
Cisne), emulsifying salt (0.70% Joha S9), potassium sorbate (0.020% Gemacom) and nisin (0.017% Danisco) were defined according to literature (Van Dender, 2006). Processing was conducted in an open vessel with mechanical agitation at 50 rpm.
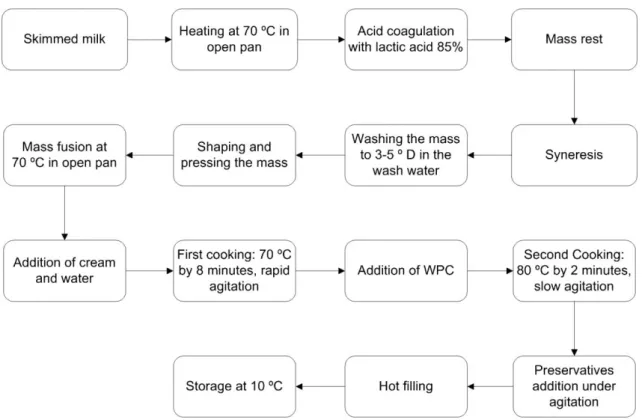
Production flowchart of Requeijão (Fig. 2) was according to the method proposed by Fernandes and Martins (1980) with modifications determined in preliminary tests.
Figure 2. Flowchart production for requeijão.
To define the amount of each ingredient to be added during processing, so that the fat and water concentrations in the final formulations correspond to the levels stipulated by the experimental design CCRD, the following variables were taken into account: mass, water concentration and fat mass, percent of fat in cream and quantity of water lost by evaporation during the fusion process.
To perform the calculations a spreadsheet was developed in the Excel 2007 ® software and the
Solver function was used to add the constraints of fat and water, as stipulated by the experimental design. The optimal solution is defined as the maximal amount of the final product that meets the constraints of fat and water stipulated by the design.
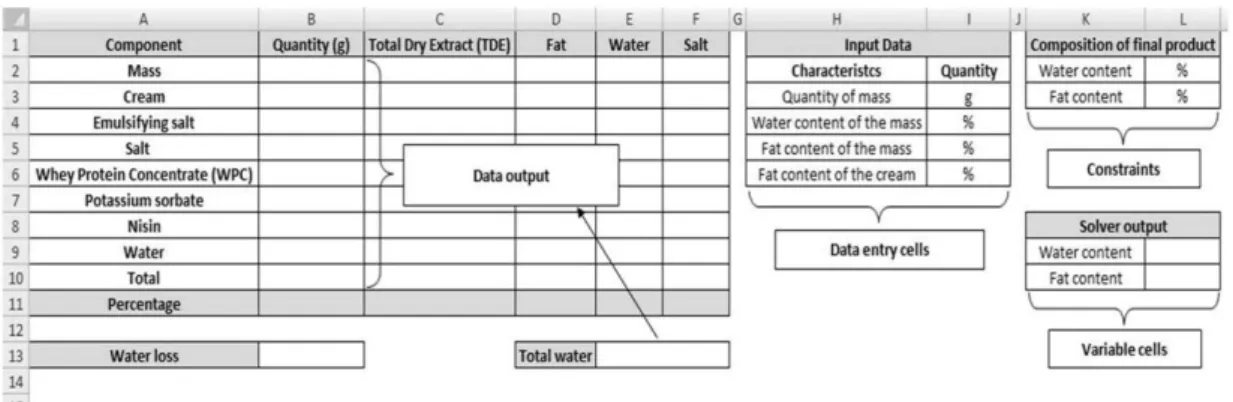
Figure 3. Structure of the spreadsheet implemented in the Excel 2007® software.
For the calculations some information is needed on the ingredients that are to be used, such as: quantity of mass (g), water content and fat in the mass (%) and fat content of the cream (%); therefore, data entry cells were created (I3: I6). Because each formulation must present different characteristics (fat and water concentration), it was necessary to define the characteristics desired in the final product and cells were also creased to define such characteristics (L2, L3). In preliminary tests it was determined that 1.300kg of water was evaporated during the fusion process (30 minutes) in the equipment test regardless of the amount processed, therefore this quantity of water was added to the total amount of water to be added during processing to obtain the desired water content in the final product.
To allow for the calculation of the amount of ingredients, formulas were added that correspond to the characteristics of each ingredient (Tab. 1). Because the amounts were calculated in relation to the final product and the final total of
requeijão depends on the quantities of
ingredients added in the process, the iterative calculation option of the Excel 2007® software
was used. In order for the software calculations to take into consideration the fat and water concentrations defined for each formulation, the following constraints were placed on the solver function: (1) B11 = 100 and (2) L9:L10 = L2:L3. Constraint (1) indicates that the final product amount should be equal to 100 % and constraint (2) indicates that the fat (L9) and water contents (L10) resultant of the calculations performed by
and L10 (variable cells) are empty, being satisfied after performing the calculation by the Solver function. After the construction of the spreadsheet and addition of the constraints, the input data was entered and the characteristics desired for the final product were defined for each formulation separately.
Thus, the fat content from cream and the fat mass were determined by the Gerber method, according to methods described in Brazil (2005). Water content was determined in a Consul brand microwave oven (Luz et al., 1998; Valentini et al., 1998; Pastorini, et al., 2002; Nery et al., 2004) (5 minutes at 70% power). To determine the water content, the mass was mixed with sand in equal proportions. The input data for processing is described in Tab. 2.
The output responses of the software were the quantities of ingredients that must be added in processing. Thus, the nine formulations were processed using the mass obtained by direct acidification of milk with 85% lactic acid P.A at 70ºC, according to the technology described by Alves et al.(2007). Processing was carried out in an open pan fitted with a mechanical stirrer at 50 rpm.
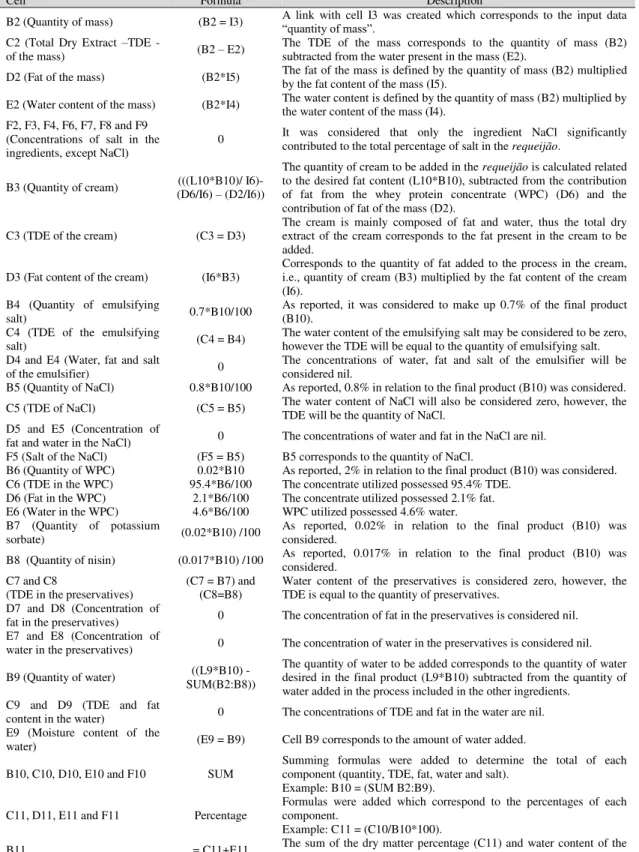
Table 1. Formulas entered in cells of the spreadsheet corresponding to the characteristics of the ingredients
Cell Formula Description
B2 (Quantity of mass) (B2 = I3) A link with cell I3 was created which corresponds to the input data
“quantity of mass”.
C2 (Total Dry Extract –TDE -
of the mass) (B2 – E2)
The TDE of the mass corresponds to the quantity of mass (B2) subtracted from the water present in the mass (E2).
D2 (Fat of the mass) (B2*I5) The fat of the mass is defined by the quantity of mass (B2) multiplied by the fat content of the mass (I5).
E2 (Water content of the mass) (B2*I4) The water content is defined by the quantity of mass (B2) multiplied by the water content of the mass (I4). F2, F3, F4, F6, F7, F8 and F9
(Concentrations of salt in the
ingredients, except NaCl) 0
It was considered that only the ingredient NaCl significantly contributed to the total percentage of salt in the requeijão.
B3 (Quantity of cream) (D6/I6) (((L10*B10)/ I6)-– (D2/I6))
The quantity of cream to be added in the requeijão is calculated related
to the desired fat content (L10*B10), subtracted from the contribution of fat from the whey protein concentrate (WPC) (D6) and the contribution of fat of the mass (D2).
C3 (TDE of the cream) (C3 = D3) The cream is mainly composed of fat and water, thus the total dry extract of the cream corresponds to the fat present in the cream to be added.
D3 (Fat content of the cream) (I6*B3)
Corresponds to the quantity of fat added to the process in the cream, i.e., quantity of cream (B3) multiplied by the fat content of the cream (I6).
B4 (Quantity of emulsifying
salt) 0.7*B10/100
As reported, it was considered to make up 0.7% of the final product (B10).
C4 (TDE of the emulsifying
salt) (C4 = B4)
The water content of the emulsifying salt may be considered to be zero, however the TDE will be equal to the quantity of emulsifying salt. D4 and E4 (Water, fat and salt
of the emulsifier) 0 The concentrations of water, fat and salt of the emulsifier will be considered nil. B5 (Quantity of NaCl) 0.8*B10/100 As reported, 0.8% in relation to the final product (B10) was considered. C5 (TDE of NaCl) (C5 = B5) The water content of NaCl will also be considered zero, however, the TDE will be the quantity of NaCl. D5 and E5 (Concentration of
fat and water in the NaCl) 0 The concentrations of water and fat in the NaCl are nil. F5 (Salt of the NaCl) (F5 = B5) B5 corresponds to the quantity of NaCl.
B6 (Quantity of WPC) 0.02*B10 As reported, 2% in relation to the final product (B10) was considered. C6 (TDE in the WPC) 95.4*B6/100 The concentrate utilized possessed 95.4% TDE.
D6 (Fat in the WPC) 2.1*B6/100 The concentrate utilized possessed 2.1% fat. E6 (Water in the WPC) 4.6*B6/100 WPC utilized possessed 4.6% water. B7 (Quantity of potassium
sorbate) (0.02*B10) /100
As reported, 0.02% in relation to the final product (B10) was considered.
B8 (Quantity of nisin) (0.017*B10) /100 As reported, 0.017% in relation to the final product (B10) was considered. C7 and C8
(TDE in the preservatives)
(C7 = B7) and (C8=B8)
Water content of the preservatives is considered zero, however, the TDE is equal to the quantity of preservatives.
D7 and D8 (Concentration of
fat in the preservatives) 0 The concentration of fat in the preservatives is considered nil. E7 and E8 (Concentration of
water in the preservatives) 0 The concentration of water in the preservatives is considered nil.
B9 (Quantity of water) SUM(B2:B8)) ((L9*B10)
-The quantity of water to be added corresponds to the quantity of water desired in the final product (L9*B10) subtracted from the quantity of water added in the process included in the other ingredients.
C9 and D9 (TDE and fat
content in the water) 0 The concentrations of TDE and fat in the water are nil. E9 (Moisture content of the
water) (E9 = B9) Cell B9 corresponds to the amount of water added.
B10, C10, D10, E10 and F10 SUM
Summing formulas were added to determine the total of each component (quantity, TDE, fat, water and salt).
Example: B10 = (SUM B2:B9).
C11, D11, E11 and F11 Percentage
Formulas were added which correspond to the percentages of each component.
Example: C11 = (C10/B10*100).
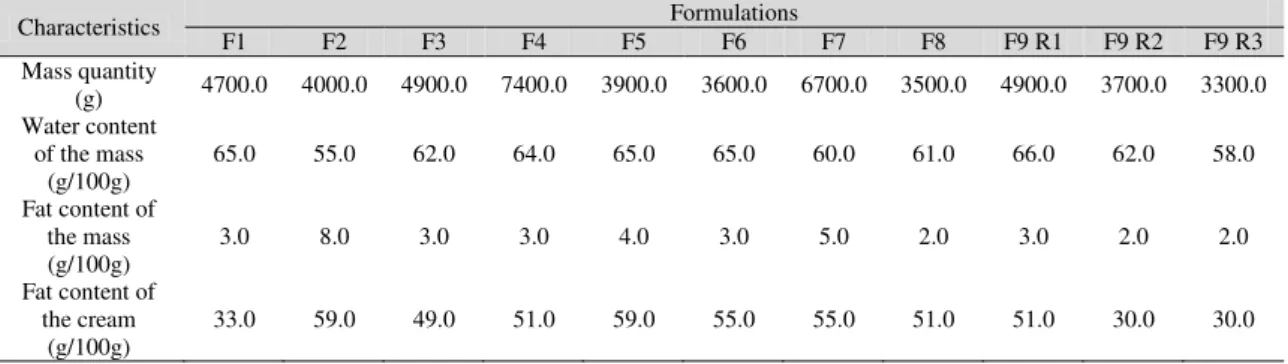
Table 2. Characteristics of the mass and cream utilized in processing of the requeijão formulas (input data to the spreadsheet)
Characteristics Formulations
F1 F2 F3 F4 F5 F6 F7 F8 F9 R1 F9 R2 F9 R3
Mass quantity
(g) 4700.0 4000.0 4900.0 7400.0 3900.0 3600.0 6700.0 3500.0 4900.0 3700.0 3300.0 Water content
of the mass
(g/100g) 65.0 55.0 62.0 64.0 65.0 65.0 60.0 61.0 66.0 62.0 58.0 Fat content of
the mass (g/100g)
3.0 8.0 3.0 3.0 4.0 3.0 5.0 2.0 3.0 2.0 2.0
Fat content of the cream
(g/100g)
33.0 59.0 49.0 51.0 59.0 55.0 55.0 51.0 51.0 30.0 30.0
RESULTS AND DISCUSSION
The structure of the developed spreadsheet and formulas inserted in each cell are shown in Fig. 4.
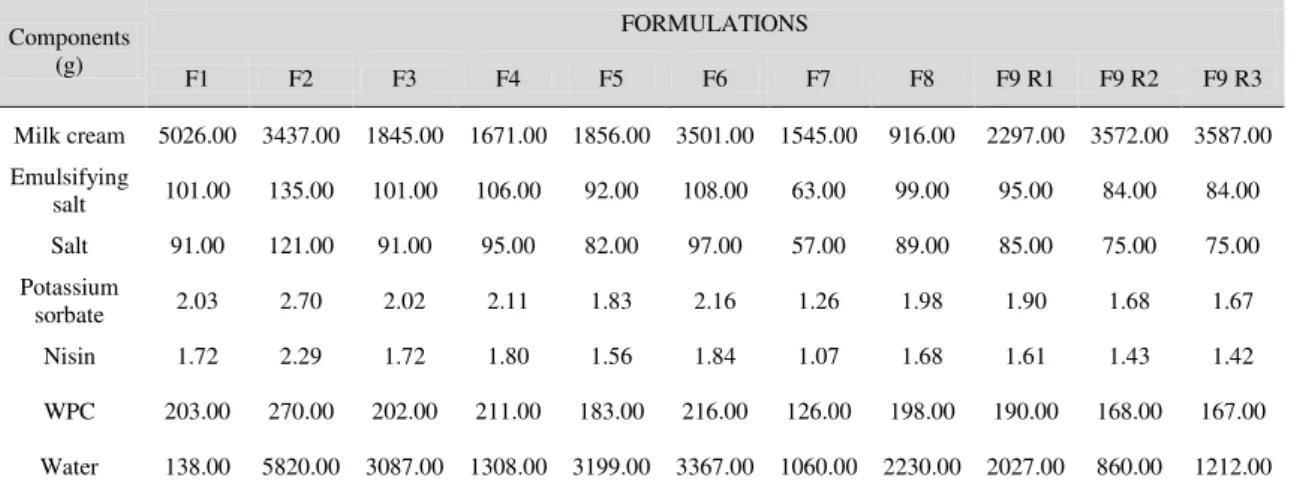
After the insertion of the restrictions and the input data for each formulation separately, the spreadsheet provided the quantity of each ingredient that should be used in processing the requeijão (output data), which is encountered in Tab. 3.
The obtained values of fat and water contents of the processed requeijão cheeses are shown in Tab. 4. Theoretical and experimental levels of fat and water in the requeijão samples did not differ significantly by the t-test and presented p-values of 0.8670 and 0.7887, respectively. This indicates that the processed formulations met the requirements stipulated by the design, and therefore the worksheet was efficient for calculating ingredient quantities to obtain standardized cheeses.
Table 3. Quantity of ingredients used in processing each formulation (output data from the spreadsheet)
Components (g)
FORMULATIONS
F1 F2 F3 F4 F5 F6 F7 F8 F9 R1 F9 R2 F9 R3
Milk cream 5026.00 3437.00 1845.00 1671.00 1856.00 3501.00 1545.00 916.00 2297.00 3572.00 3587.00 Emulsifying
salt 101.00 135.00 101.00 106.00 92.00 108.00 63.00 99.00 95.00 84.00 84.00 Salt 91.00 121.00 91.00 95.00 82.00 97.00 57.00 89.00 85.00 75.00 75.00 Potassium
sorbate 2.03 2.70 2.02 2.11 1.83 2.16 1.26 1.98 1.90 1.68 1.67 Nisin 1.72 2.29 1.72 1.80 1.56 1.84 1.07 1.68 1.61 1.43 1.42
WPC 203.00 270.00 202.00 211.00 183.00 216.00 126.00 198.00 190.00 168.00 167.00
Water 138.00 5820.00 3087.00 1308.00 3199.00 3367.00 1060.00 2230.00 2027.00 860.00 1212.00
Table 4.Fatand water concentrations of the processed requeijão cheeses
Formulations Constituents
Water content Fat content
F1 64.90±0.10 16.50±0.20
F2 69.75±0.10 16.40±0.10
F3 69.75±0.10 10.50±0.13
F4 65.47±0.10 11.50±0.32
F5 71.02±0.10 13.00±0.18
F6 67.20±0.00 18.50±0.53
F7 63.50±0.10 13.10±0.08
F8 66.67±0.05 8.45±0.13
F9 R1 (CP) 67.15±0.00 13.60±0.15
F9 R2 (CP) 67.02±0.10 13.75±0.20
F9 R3 (CP) 67.23±0.24 13.20±0.18
It should be noted that the repetitions of formulation F9 (CP) were obtained from raw materials with different characteristics (water and fat mass contents and fat content in the cream) and presented a similar centesimal composition. This shows that proper use of the mass balance generated more standardized final products, which indicates that the spreadsheet developed in this work is an interesting alternative allowing for simple and economical quality control of dairy products.
The developed spreadsheet can be applied to control the quality of other products, dairy and non-dairy, where the restrictions of the formulations can be adapted to other constituents (e.g. additives, proteins, salt and others). Additionally, the number of restrictions inserted
in the spreadsheet is not limited and is a simple process, requiring only that the insertion process be repeated as often as necessary. The use of this tool in quality control allows for acquisition of products from different batches with the same characteristics, meeting market demands.
CONCLUSIONS
ACKNOWLEDGMENTS
We thank Conselho Nacional de Desenvolvimento Científico e Tecnológico (CNPq) and the Fundação de Amparo à Pesquisa de Minas Gerais (Fapemig) for their financial support.
REFERENCES
ALVES, R.M.V.; VAN DENDER, A.G.F.; JAIME, C.B.M. et al. Effect of light and packages on stability of spreadable processed cheese. Int. Dairy J., v.17, p.365-373, 2007. BARONI, A.F.; FREITAS, I.C.; CUNHA, R.L. et al. Caracterização Reológica de Requeijão Cremoso Tradicional e com Teor Reduzido de Gordura: Viscosidade Extensional e em Cisalhamento. Braz. J. Food Technol., v.2, p.21-29, 1999.
BRASIL. Ministério da Agricultura, da Pecuária e do Abastecimento. Secretaria de Defesa Agropecuária. Regulamentos Técnicos de Identidade e Qualidade de Leite e Produtos
Lácteos. Portaria nº 359. Regulamento técnico
para fixação de identidade e qualidade do requeijão cremoso ou requesón. Brasília, 1997. BRASIL. Vigilância Sanitária, Ministério da Saúde (ANVISA). Portaria nº 27, de 13 de Janeiro de 1998. Regulamento Técnico de Informação nutricional complementar. Diário Oficial da União, Brasília, DF, 1998.
BRASIL. Instituto Adolfo Lutz. Métodos Físico-Químicos para Análise de Alimentos. Brasília. IV Edição, 2005. 1018p.
BROWN, A.M. A step-by-step guide to non-linear regression analysis of experimental data using a Microsoft Excel spreadsheet. Comp. Meth. Prog. Bio., v.65, p.191-200, 2001.
CAVALCANTE, A.B.D; COSTA, J.M.C. Padronização da tecnologia de fabricação do queijo manteiga. Rev. Cienc. Agron., v.36, p.215-220, 2005.
CUNHA, C.R.; VIOTTO, W.H.; VIOTTO, L.A. Use of low concentration factor ultrafiltration
retentates in reduced fat ‘‘Minas Frescal’’ cheese
manufacture: Effect on composition, proteolysis,
DASGUPTA, P.K. Chromatographic peak resolution using Microsoft Excel Solver The merit of time shifting input arrays. J. Chromatogr., v.1213, p.50-55, 2008.
FERNANDES, A.G.; MARTINS, J.F.P. Fabricação de requeijão cremoso a partir de massa obtida por precipitação ácida a quente de leite de búfala e de vaca. Rev. Inst. Laticínios Cândido Tostes, v.35, p.7-13, 1980.
GALLINA, D.A.; VAN DENDER, A.G.F.; YOTSUYANAGI, K.; RODRIGUES DE SÁ, P.B.Z. Influence of storage temperature on the texture profile and colour characteristics of UHT Requeijão cremoso. Braz. J. Food Technol., v.11, p.169-174, 2008.
GARRUTI, D.S.; BRITO, E.S.; BRANDÃO, T.M. et al. Desenvolvimento do perfil sensorial e aceitação de requeijão cremoso. Ciencia Tecnol. Alime., v.23, p.434-440, 2003.
GOMES, R.G.; PENNA, A.L.B. Caracterização de requeijão cremoso potencialmente prebiótico pela adição de inulina e proteína de soja. B. Cent. Pesq. Proc. A., v.28, p.289-302, 2010.
LUZ, C.; BAUDET, L.; FRANDOLOSO, V. Determinação do teor de água de sementes de arroz por secagem com micro-ondas. Rev. Bras. Sem, v.20, p.70-74, 1998.
MARTINS, D.D.S.; SILVA, A.N. Ferramentas
computacionais para auxílio a decisões
logísticas. Viçosa: Editora da Universidade
Federal de Viçosa, 2009. 119p.
METZGER, L.E.; MISTRY, V.V.A new approach using homogenization of cream in the manufacture of reduced fat cheddar cheese. J. Dairy Sci., v.78, p.1883-1895, 1995.
NERY, M.C.; CARVALHO, M.L.M.; OLIVEIRA, L.M. Determinação do grau de umidade de sementes de ipê-do-cerrado Tabebuia ochracea ((Cham.) Standl.) pelos métodos de estufa e forno de microondas. Cienc. Agrotec., v.28, p.1299-1305, 2004.
REYCK, B.; DEGRAEVE, Z. MABS: Spreadsheet-based decision support for precision marketing. European J. Operational Rese., v.171, p.935-950, 2006.
VALENTINI, S.R.T.; CASTRO, M.F.P.M.; ALMEIDA, F.H. Determinação do teor de umidade de milho utilizando aparelho de micro-ondas. Cienc. Tecnol. Alime., v.18, p.237-240, 1998.
VAN DENDER, A.G.F. Requeijão cremoso e
outros queijos fundidos: tecnologia de
fabricação, controle do processo e aspectos do mercado. Campinas, S.P. Fonte Comunicações e Editora Ltda, 2006. 390 p.