Article
J. Braz. Chem. Soc., Vol. 23, No. 8, 1469-1475, 2012. Printed in Brazil - ©2012 Sociedade Brasileira de Química 0103 - 5053 $6.00+0.00
A
*e-mail: [email protected]
Spectrophotometric Evaluation of the Behavior of Disperse Red 1 Dye in Aqueous
Media and its Interaction with Calf Thymus ds-DNA
Carolina V. Uliana, Gustavo S. Garbellini* and Hideko Yamanaka
Instituto de Química, Universidade Estadual Paulista (Unesp), Rua Prof. Francisco Degni, 55, 14800-900 Araraquara-SP, Brazil
A espectrofotometria UV-Vis foi utilizada para medir a solubilidade do corante disperso red 1 (DR1) em soluções aquosas, com diferentes solventes e dispersantes. O corante foi quantificado em amostras de águas, e sua interação com o ds-DNA de timo de vitelo foi investigada. Os resultados mostraram que o dispersante comercial Fongranal® FB foi adequado para a preparação das
soluções aquosas do DR1. Para a determinação de DR1 em água pura, o limite de detecção foi de 2,47 × 10⁻⁶ mol L-1, e o limite de quantificação, 8,22 × 10⁻⁶ mol L-1. Porcentagens de recuperação
de 91,2 e 103% foram obtidas para as concentrações de DR1 em 3,00 × 10⁻⁶ e 40,0 × 10⁻⁶ mol L-1,
respectivamente. As recuperações alcançadas de DR1 em água de torneira e de rio ficaram na faixa de 85,9-113%. A interação de DR1 com o DNA de timo de vitela foi acompanhada por efeitos de hipocromismo e hipercromismo, que foram relacionados à mudanças conformacionais e lesão na dupla hélice do DNA.
UV-Vis spectrophotometry was used to measure the solubility of disperse red 1 (DR1) dye in aqueous solutions, using different solvents and dispersants. The dye was quantified in water samples, and its interaction with calf thymus ds-DNA was investigated. The results showed that the commercial dispersant Fongranal® FB was suitable for the preparation of aqueous DR1 solutions.
For the determination of DR1 in purified water, the limit of detection was 2.47 × 10⁻⁶ mol L-1, and
the limit of quantification was 8.22 × 10⁻⁶ mol L-1. Percentage recoveries of 91.2 and 103% were
obtained for DR1 concentrations of 3.00 × 10⁻⁶ and 40.0 × 10⁻⁶ mol L-1, respectively. The recoveries
achieved for DR1 present in tap and river water were in the range 85.9-113%. The interaction of DR1 with calf thymus DNA was accompanied by hypochromic and hyperchromic effects, which were related to conformational changes and damage to the DNA double helix.
Keywords:disperse red 1, textile dye, solubility, ds-DNA
Introduction
Synthetic dyes can be defined as intensely colored substances that, when applied to a material, give it color that exhibits some degree of permanence.1 These dyes are
extensively used in the textile, food processing, and leather tanning industries, as well as in paper production and agricultural products.1 The textile dyes show considerable
structural diversity, and can be classified according to either the chromophore (including azo, anthraquinone, indigoid and triphenylmethyl groups) or the method of attachment to the textile fiber (direct, basic, acidic, reactive, disperse, etc.).1,2
An estimated 700,000 to 850,000 tons of dyes are produced worldwide each year, and 26,500 tons per
year are consumed in Brazil.3,4 An amount equivalent to
approximately 20-50% of the quantity of textile dyes used is released into natural waters due to losses that occur during the process of fixing the dye to the fibers.5 Dyes
are potentially harmful to the environment and human health.6-9 According to Resolution N. 357 of the National
Environment Council of Brazil (CONAMA),10 dyes derived
from anthropogenic sources should be virtually absent in natural waters, indicating that these pollutants may be present at low concentrations.
The most widely used group of compounds is the azo dyes, whose molecules contain one or more azo groups (–N=N–) attached to aromatic systems. Azo dyes account for around 60% of the dyes currently used globally, and are extensively employed in textile dyeing.11 Disperse
(Figure 1), which can contain azo groups in their structures, are nonionic aromatic compounds suitable for dyeing polyester fibers, cellulose triacetate, and polyamide. Since an important characteristic of these dyes is their very low solubility in water, evaluations of mutagenicity have been performed using either solutions of disperse dyes in organic solvents such as dimethyl sulfoxide (DMSO) and acetonitrile,12,13 or commercial formulations containing
dispersing agents.14,15 The presence of water obviously
cannot be eliminated in the analysis of wastewater containing dyes. In order to facilitate the monitoring of these compounds in natural waters, it is therefore necessary to study their solubility in aqueous media.
Human exposure to azo dyes occurs mainly through ingestion of contaminated water, dermal absorption from wearing azo-dyed clothing and footwear, or inhalation in occupational settings.16 Nonionic azo dyes, such as DR1,
are considered potentially toxic.17 They can be metabolized
by azoreductase enzymes at the gastrointestinal cells, producing free aromatic amines that are potentially carcinogenic and mutagenic.13,18-20 Several studies have
indicated that azo dyes can cause DNA damage.4,21-24
DNA plays a key role in cell proliferation, synthesis of proteins, and transcription of genetic information in living cells.25 Damage to cell DNA following interaction with
toxic compounds causes mutations that can result in the development of cancers.26
UV-Vis spectrophotometry is a useful tool for use in preliminary investigations of the genotoxicity of chemical substances, and has been employed to evaluate the interaction of toxic compounds with DNA.27-29 The aim of
this work was to investigate the solubility of disperse red 1 textile dye in aqueous solutions, develop a methodology for its determination in tap and river water, and evaluate the interaction of the dye with calf thymus ds-DNA, using UV-Vis spectrophotometry.30-32
Experimental
Reagents and instrumentation
Disperse red 1 dye (95%, CAS 2872-52-8) and calf thymus double-stranded DNA (ds-DNA, CAS 73049-39-5) were both purchased from Sigma-Aldrich. Ethanol, acetone,
acetonitrile (ACN), and N,N-dimethylformamide (DMF) were acquired from J.T. Baker. The dispersants Tamol® L-M
(Basf), Setamol® L-CA (Basf) and Fongranal® FB (Clariant)
were kindly provided by Lupo S. A. (Araraquara, São Paulo, Brazil). Aqueous DR1 stock solutions (4.00 × 10⁻⁴ mol L-1)
containing 5.0% (v/v) Fongranal® FB were prepared for
use in the water sample analyses and the DNA interaction experiments. A stock solution of 2.00 mg mL-1 DNA was
prepared by dissolving a small quantity of DNA in purified water, overnight at 4 ºC. The solution was then shaken gently before use as needed, and the nucleotide (monomer units) concentration was calculated using the molar absorption coefficient at 260 nm (ε260 = 6600 L mol-1 cm-1).28 The ratio
of the DNA absorbance intensities at 260 and 280 nm was 1.88, indicating that the DNA was free from protein. The river water samples were collected from the Tietê River and the Jacaré-Guaçu River, in the municipalities of Barra Bonita and Araraquara, respectively. Samples of tap water were collected from the electroanalytical laboratory of the Institute of Chemistry (Unesp), in Araraquara.
Purified water (ρ = 18.2 MΩ cm) was obtained from
a Milli-Q system (Millipore). Absorbance measurements were performed using a Hewlett Packard Model 8453 spectrophotometer, fitted with a 1.0 cm optical path length quartz cuvette. All experiments were carried out at 25 ± 1 oC.
Solubility of the dye and its determination in water
Stock solutions of 4.00 × 10⁻⁴ mol L-1 DR1 were
prepared using purified water, pure solvents (acetone, dimethylformamide, acetonitrile or ethanol) and water containing the dispersants 3.0% (m/v) Tamol® L-M,
5.0% (v/v) Setamol® L-CA, and 5.0% (v/v) Fongranal® FB.
Working standard solutions were prepared by dilution of the stock solutions with purified water to give final concentrations of 5.00 × 10⁻⁵ mol L-1. UV-Vis spectra were
recorded using the same solutions on different days (during storage at 4 oC), and the intensities of the absorption band
at 505 nm were compared in order to estimate the stability of the dye solution.
Analytical curves were prepared to follow the analysis of aqueous solutions containing known amounts of analyte standard. The limits of detection (LOD) and quantification (LOQ) were determined using the standard deviation of the mean absorbance value (measured at 505 nm) for eight blank spectra (SB), together with the slope of the straight
line obtained from the analytical curve (b):33
LOD = 3SB / b (1)
LOQ = 10SB / b (2)
N N
N
CH2CH3
CH2CH2OH
O2N
Recovery experiments were performed by adding fixed aliquots of analyte (at concentrations of 3.00 × 10⁻⁶ and
40.0 × 10⁻⁶ mol L-1) to deionized, tap and river water,
followed by additions of known amounts of analyte standard. Recovery percentages (Rec%) were calculated according to equation 3, where the value of the analyte concentration found refers to the value obtained experimentally.
Rec% = ([analyte]found / [analyte]added) × 100 (3)
Interaction between disperse red 1 and ds-DNA
Interaction between DR1 and DNA was investigated since DR1 is potentially genotoxic. The interaction of 5.00 × 10⁻⁵ mol L-1 aqueous DR1 solution containing 0.6%
(v/v) Fongranal® FB with 7.00 × 10⁻⁵ mol L-1 calf thymus
DNA was evaluated by recording UV-Vis spectra from 0 to 162 h (ca. 7 days) for reaction of (a) DR1 + dispersant + DNA, and (b) dispersant + DNA.
The DNA damage caused by DR1 + dispersant was determined by subtraction of the spectrum for DR1 + dispersant from that obtained for DR1 + dispersant + DNA, resulting in the spectrum for the damaged DNA alone. Similarly, the spectrum of the damaged DNA was determined by subtraction of the spectrum for the dispersant from that obtained for dispersant + DNA. The interaction of pure ds-DNA with different concentrations of DR1 + dispersant was then evaluated for dye concentrations from 1.00 × 10⁻⁶ to 3.00 × 10⁻⁵ mol L-1, using the same subtraction
procedure described above.
Results and Discussion
Determination of the solubility of DR1 using UV-Vis spectrophotometry
The characteristic absorption band of DR1 lies in the wavelength range from 390 to 550 nm, and is due to π→π*
electronic transitions of the amino-4-nitroazobenzene chromophore.34 The intensity of the absorption band in this
region of the spectrum was used to compare the solubility of DR1 in different solutions.
Purified water was investigated first, with heating to 100 oC. The solution was highly turbid, as expected,
and no signal was observed in the chosen wavelength range. The formation of suspensions must be avoided in optical measurements, in order to ensure compliance with the Beer-Lambert Law.35 It is therefore vital to select an
appropriate solvent or additive, as well as the best solvent/ water ratio. Wetting of the particles by the liquid phase, deagglomeration of particle aggregates by mechanical
destruction, stabilization of the dispersed suspension, and prevention of reagglomeration are required for successful dye dissolution and dispersion.36,37 Due to the high surface
tension of water, special additives (dispersants in the present case) are required to reduce the surface tension and ensure adequate dye wetting. Spectra obtained for the 5.00 × 10⁻⁵ mol L-1 aqueous DR1 solutions prepared
using the different solvents and additives are illustrated in Figure 2.
The UV-Vis spectra obtained using acetone, DMF, ACN and ethanol (spectra 1 to 4 of Figure 2) presented a maximum absorption band at 406 nm, with intensities in the order: DMF > ethanol > ACN > acetone. Applying the equation ε = A M-1, where A is the absorbance at 406 nm
for different solvents and M is the molar concentration of the dye,38 the molar absorptivity of DR1 (L mol-1 cm-1) was
calculated as 3,208 for acetone, 15,846 for DMF, 11,174 for ACN and 13,708 for ethanol. A less well-defined band in the region from 450 to 600 nm was also observed in the spectra of the dye solutions prepared using these solvents. No absorption bands were observed in the spectrum of the dye solution containing Tamol® L-M (spectrum 5 in
Figure 2), which is a product of naphthalene sulfonic acid and it has patented composition, used in the commercial industry in concentration 1 to 3% (m/v) for dyeing.39
Although it has a high dispersant power, Tamol® L-M
is an anionic surfactant, which can be the reason for no dissolution of the nonionic DR1. The spectrum of DR1 solution containing Setamol® L-CA, a product of aromatic
sulfonic acid condensation commonly used at concentration from 1 to 20 g L-1,40 presented a band from 450 to 600 nm
(spectrum 6 in Figure 2) and an intense absorption band from 400 to 600 nm, with maximum intensity at 505 nm,
was obtained for the dye solutions containing Fongranal®
FB (spectrum 7, Figure 2).
The UV-Vis absorption spectrum may be influenced by non-specific ion-dipole, dipole-dipole (Keesom) and permanent dipole-induced dipole (Debye) interactions, or by specific interactions such as hydrogen bonds with the solvents. The type of solvent used therefore plays an important role in the physical and chemical processes involved, influencing the position, intensity, and shape of absorption bands.34 The 5.00 × 10⁻⁵ mol L-1 aqueous DR1
solutions containing Fongranal® FB were visibly clear, with
a higher absorbance intensity and better spectral profile than obtained for dye solutions containing Setamol® L-CA.
It is important to note that no spectrophotometric signals were observed in the dye absorption region when solvents or dispersant solutions were used alone.
Fongranal® FB is a water soluble product that is nonionic,
colorless and of neutral pH.41 It is used in the textile industry,
at concentrations from 0.5 to 2 mL L-1 (0.05 to 0.2%),41 as a
dispersing agent to ensure penetration and uniformity during dyeing and printing. The composition and chemical structure of Fongranal® FB are protected by a patent. Since the highest
concentration used industrially is 0.2%, a fresh aqueous stock solution of 4.00 × 10⁻⁴ mol L-1 of DR1 was prepared using
0.2% (v/v) Fongranal® FB. A working solution was prepared
from this stock solution using purified water, to give a final DR1 concentration of 5.00 × 10⁻⁵ mol L-1 (resulting in 0.03%
of dispersant, after dilution). The spectrum obtained for this working solution showed that the intensity of the band at 505 nm was 85% lower than the intensity obtained for a working solution containing 5.00 × 10⁻⁵ mol L-1 of DR1 and
0.6% of dispersant.
Spectra for an aqueous solution containing 5.00 × 10⁻⁵ mol L-1 DR1 and 0.6% Fongranal® FB were
recorded on different days (during storage at 4 oC), and
solution stability was evaluated by comparison of the intensities of the absorption band at 505 nm. The signal intensity decreased by 12% on the second day after solution preparation, and by 41% after 90 days of storage. This indicated that the dye solution should be prepared immediately prior to the measurements.
Development of the methodology for determination of DR1 in aqueous solutions
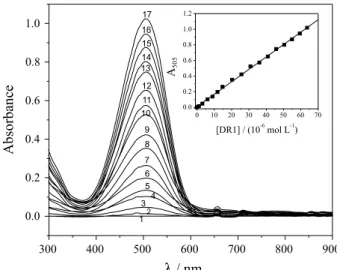
The spectra obtained for different DR1 concentrations are shown in Figure 3. The inset in Figure 3 illustrates the analytical curve, and shows that there was a linear relationship between absorbance and dye concentration within the concentration range investigated (1.00-64.0 × 10⁻⁶ mol L-1).
The equation of the analytical curve was A = 0.0090 + 0.016 [DR1] (µmol L-1), and the value of the correlation
coefficient (r) was 0.9993. The LOD and LOQ were determined according to the procedure described in the experimental section, and the values obtained were 2.47 × 10⁻⁶ mol L-1 (0.770 mg L-1) and 8.22 × 10⁻⁶ mol L-1
(2.56 mg L-1), respectively. The repeatability was determined
by sequential measurements (n = 10) of DR1 solutions at concentrations of 6.00 × 10⁻⁶ mol L-1 and 5.00 × 10⁻⁵ mol L-1,
resulting in relative standard deviations (coefficients of variation) of 0.29 and 0.064%, respectively. The accuracy of the method was evaluated in recovery studies using DR1 at concentrations of 3.00 × 10⁻⁶ and 40.0 × 10⁻⁶ mol L-1, and
the values obtained were 91.2 and 103%, respectively. The results showed that the dispersant was able to maintain dye solubility across the entire concentration range studied. The methodology developed was therefore employed for the measurement of DR1 in water samples.
Spectrophotometric determination of DR1 in water samples
No absorption bands were observed in the spectra recorded for the tap, Tietê River and Jacaré-Guaçu River water samples, showing that no detectable residues of DR1 were present. The accuracy of the technique was determined from the recovery of analyte intentionally added to water samples to give dye concentrations of 3.00 × 10⁻⁶ and
40.0 × 10⁻⁶ mol L-1. The recoveries of DR1 were in the range
85.9-113% (Table 1). According to Brito et al.,42 recoveries
of 60-115 and 80-110% are considered to be satisfactory for analyte concentrations of 10-6 and 10-5 mol L-1, respectively.
The values obtained therefore confirmed that reliable measurement of DR1 in water samples could be achieved using Fongranal® FB.
Investigation of the interaction of DR1 with DNA using UV-Vis spectrophotometry
The interaction of DR1 with calf thymus ds-DNA was studied by following the changes in UV-Vis absorbance intensities (hyperchromic or hypochromic) and/or wavelength shifts (bathochromic or hypsochromic).
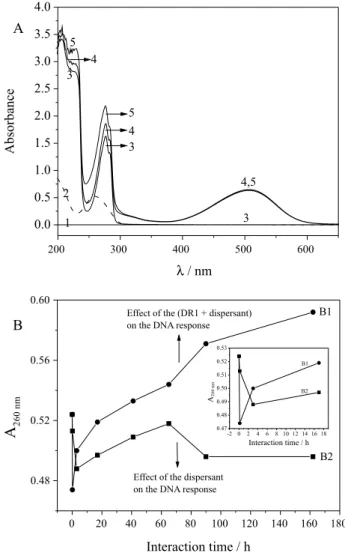
Figure 4A presents the spectra obtained for 7.00 × 10⁻⁵ mol L-1 ds-DNA, 0.6% Fongranal® FB and
aqueous 5.00 × 10⁻⁵ mol L-1 DR1 solutions containing
either 0.6% Fongranal® FB or 0.6% Fongranal® FB
plus 7.00 × 10⁻⁵ mol L-1 ds-DNA. The DNA, dye and
dispersant bands overlapped between 250 and 300 nm. The procedure employing subtraction of the spectral values for different times was therefore performed in order to obtain the response for damaged DNA, as described in the experimental section. The results are illustrated in Figure 4B. Figure 4B1 shows the absorbance intensity of the DNA band at 260 nm after the interaction of DR1 + dispersant with DNA for up to 162 h (around 7 days).
The spectrophotometric signal for the DNA band after interaction with DR1 + dispersant showed a decrease of absorbance up to 10 min (Figure 4B inset), and an increase in the signal from 10 min to 162 h, indicative of hypochromic and hyperchromic effects, respectively. Between 0 min and 162 h, there was an increase of 11.5% in the DNA band absorbance signal.
For interaction with the dispersant (Figure 4B (B2)), the absorbance of the DNA band at 260 nm decreased during the first 3 h of interaction (Figure 4B inset), and increased between 3 and 65 h of interaction. After 65 h, the DNA band signal decreased, and then remained constant up to 162 h. This could have been due to weak interaction of the dispersant with the DNA, resulting in a conformational change in the double helix caused by contraction of the molecule.43 The dispersant solution itself was stable for
over 162 h (as shown by a constant absorbance intensity). No shift in wavelength of the DNA band was observed in any of the experiments.
The comparison of the absorbance at 260 nm for the damaged DNA band (after interaction with DR1 + dispersant at 162 h) with the initial DNA absorbance at 0 min (prior to any interaction) revealed hyperchromic effect, as it can be
seen clearly in Figure 4B. On the other hand, hypochromic effect was observed after DNA interaction with the dispersant in the absence of DR1, considering the absorbance values at 162 h and 0 min (Figure 4B).
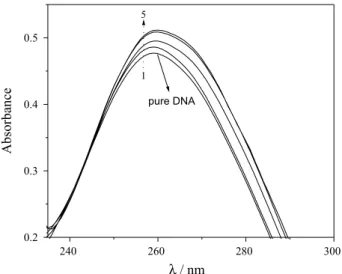
The interaction of DNA with dye + dispersant was evaluated using dye concentrations from 1.00 × 10⁻⁶ to
3.00 × 10⁻⁵ mol L-1. Figure 5 shows the DNA band before
and after interaction with dye + dispersant, employing the
Table 1. Percentage recoveries of DR1 obtained for different water samples (n = 3)
DR1 concentration / (× 10-6 mol L-1)
% Recovery value ± sd / % error*
Tap Tietê River Jacaré-Guaçu River
3.00 85.9 ± 0.8 / −14.3 113.0 ± 0.7 / +13.0 90.4 ± 0.9 / −9.6
40.0 98.3 ± 0.1 / −1.75 103.8 ± 0.2 / +3.75 100.6 ± 0.1 / +0.5
*Error = {([DR1]obtained – [DR1]known) / [DR1]known} × 100
spectra subtraction procedure. There was a small but clear increase of the DNA response with dye concentration, indicative of hyperchromism. Similar results have been obtained previously for the interaction of DNA with the herbicide chloridazon.28 For the calculation
of binding constant of DR1 + dispersant with DNA, absorbance measurements were performed by keeping the concentration of DNA constant (7.00 × 10⁻⁵ mol L-1), while
varying the concentration of dye + dispersant (1.00 × 10⁻⁶
to 30.0 × 10⁻⁶ mol L-1). The procedure was carried out
according to Ahmadi et al.28 and Marty et al.44 The double
reciprocal plot of 1/(A-A0) versus 1/[DR1+dispersant], in
which A0 is the initial absorbance of free DNA at 260 nm
and A is the recorded absorbance of DNA at different dye concentrations, was linear (r = 0.99) and the binding constant (K) calculated from the ratio of the intercept to the slope was found to be 3.11 × 10⁵ L mol-1. This
value is higher than those found for several carcinogenic compounds28 with an affinity binding in the range of
3.5 × 10³ to 1.6 × 10⁴ L mol-1, indicating that DR1 in the
presence of the dispersant has a significant effect on DNA. These spectrophotometric effects reflect changes in the conformation and structure of DNA following analyte binding. Hypochromism results from the contraction of DNA in the helical axis, as well as from conformational changes in the DNA. Hyperchromism is due to damage of the DNA double helix structure.45
Conclusions
Knowledge of the solubility of dyes in water, rather than in organic solvents, is important for toxicological studies of
aquatic environments affected by industrial effluents. DR1 is not soluble in water alone, however the Fongranal® FB
dispersant commonly utilized by the textile industry was found to be suitable for obtaining an aqueous solution. Environmental protection agencies generally have policies designed to restrict the concentrations of dyes in aquatic systems, and hence limit the ability of these substances to interact with DNA; importantly, the results obtained suggest that Fongranal® FB also presents genotoxicity.
The potential threat to animals and humans of the presence of disperse dyes and industrial dispersants in natural waters was demonstrated by in vitro studies employing ds-DNA. The interaction of dye+dispersant with calf thymus DNA was dependent on both reaction time and DR1 concentration, with the spectrophotometric behavior of the DNA band indicating the existence of hypochromic and hyperchromic effects. The UV-Vis spectrophotometric methodology developed was successfully applied to the determination of DR1 in purified water and tap/river water samples, for which analyte recoveries of between 85.9 and 113% were achieved.
Acknowledgments
The authors are grateful for the financial support provided by the São Paulo State Research Foundation (FAPESP) (Proc. 2008/08990-1, 2009/08161-8 and 2008/10449-7) and CNPq (Proc. 313307/2009-1).
References
1. Soon, A. N.; Hameed, B. H.; Desalination2011, 269, 1. 2. Guaratini, C. C. I.; Zanoni, M. V. B.; Quim. Nova2000, 23, 71. 3. Kunz, A.; Peralta-Zamora, P.; Moraes, S. G.; Durán, N.; Quim.
Nova2002, 25, 78.
4. Chequer, F. M. D.; Angeli, J. P. F.; Ferraz, E. R. A.; Tsuboy, M. S.; Marcarini, J. C.; Mantovani, M. S.; Oliveira, D. P.; Mutat. Res., Genet. Toxicol. Environ. Mutagen.2009, 676, 83. 5. Frijters, C. T. M. J.; Vos, R. H.; Scheffer, G.; Mulder, R.; Water
Res.2006, 40, 1249.
6. Banat, I. M.; Nigam, P.; Singh, D.; Marchant, R.; Bioresour. Technol. 1996, 58, 217.
7. Zanoni, M. V.; Carneiro, P. A.; Ciência Hoje2001, 29, 61. 8. Chatzisymeon, E.; Xekoukoulotakis, N. P.; Coz, A.;
Kalogerakis, N.; Mantzavinos, D.; J. Hazard. Mater. 2006,
B137, 998.
9. Saratale, R. G.; Saratale, G. D.; Chang, J. S.; Govindwar, S. P.;
J.Taiwan Inst. Chem. Eng.2011, 42, 138.
10. http://www.cetesb.sp.gov.br/Agua/praias/res_conama_357_05. pdf accessed in September 2011.
11. Forgacs, E.; Cserháti, T.; Oros, G.; Environ. Int.2004, 30, 953. Figure 5. UV-Vis spectra for 7.00 × 10⁻⁵ mol L-1 pure ds-DNA (1), and after
12. Carneiro, P. A.; Umbuzeiro, G. A.; Oliveira, D. P.; Zanoni, M. V. B.; J. Hazard. Mater.2010, 174, 694.
13. Lima, R. O. A.; Bazo, A. P.; Salvadori, D. M. F.; Rech, C. M.; Oliveira, D. P.; Umbuzeiro, G. A.; Mutat. Res. Genet. Toxicol. Environ. Mutagen.2007, 626, 53.
14. Umbuzeiro, G. A.; Freeman, H. S.; Warren, S. H.; Kummrow, F.; Claxton, L. D.; Food Chem. Toxicol.2005, 43, 49.
15. Tsuboy, M. S.; Angeli, J. P. F.; Mantovani, M. S.; Knasmüller, S.; Umbuzeiro, G. A.; Ribeiro, L. R.; Toxicol. in Vitro2007,
21,1650.
16. http://www.epa.gov/oppt/existingchemicals/pubs/actionplans/ DCB%20Action%20Plan_06232010.noheader.pdf accessed in October 2011.
17. Novotný, C.; Dias, N.; Kapanen, A.; Malachová, K.; Vándrovcová, M.; Itävaara, M.; Lima, N.; Chemosphere2006,
63, 1436.
18. Golka, K.; Kopps, S.; Myslak, Z. W.; Toxicol. Lett.2004, 151, 203.
19. Xu, H.; Heinze, T. M.; Chen, S.; Cerniglia, C. E.; Chen, H.;
Appl. Environ. Microbiol.2007, 73, 7759.
20. Pricelius, S.; Held, C.; Murkovic, M.; Bozic, M.; Kokol, V.; Cavaco-Paulo, A.; Guebitz, G. M.; Appl. Microbiol. Biotechnol. 2007, 77, 321.
21. Ferraz, E. R. A.; Grando, M. D.; Oliveira, D. P.; J. Hazard. Mater. 2011, 192, 628.
22. Zhang, Y.; An, Y.; Jiang, L. P.; Geng, C. Y.; Cao, J.; Jiang, L. J.; Zhong, L, F.; Environ. Toxicol. 2011, 26, 292.
23. An, Y.; Jiang, L. P.; Cao, J.; Geng, C. Y.; Zhong, L. F.; Mutat. Res. Genet. Toxicol. Environ. Mutagen.2007, 627, 164. 24. Chequer, F. M. D.; Lizier, T. M.; de Felício, R.; Zanoni, M. V. B.;
Debonsi, H. M.; Lopes, N. P.; Marcos, R.; de Oliveira, D. P.;
Toxicol. in Vitro, in press.
25. Lehninger, A. L.; Nelson, D. L.; Cox, M. M.; Principles of Biochemistry, 2nd ed., Worth Publishers: New York, 1993.
26. Jackson, S. P.; Barek, J.; Nature2009, 461, 1071.
27. Kashanian, S.; Gholivand, M. B.; Ahmadi, F.; Ravan, H.; DNA Cell Biol.2008, 27, 325.
28. Ahmadi, F.; Jamali, N.; Jahangard-Yekta, S.; Jafari, B.; Nouri, S.; Najafi, F.; Rahimi-Nasrabadi, M.; Spectrochim. Acta, Part A 2011, 79, 1004.
29. Ortiz, M.; Fragoso, A.; Ortiz, P. J.; O’Sullivan, C. K.;
J. Photochem. Photobiol., A2011, 218, 26.
30. Pinheiro, H. M.; Touraud, E.; Thomas, O.; Dyes Pigm.2004,
61, 121.
31. Şahin, S.; Demir, C.; Güçer, Ş.; Dyes Pigm.2007, 73, 368. 32. Cosa, G.; Focsaneanu, K.; McLean, J. R N.; McNamee, J. P.;
Scaiano, J. C.; Photochem. Photobiol. 2001, 73, 585. 33. Ingle, J. D.; Crouch, S. R.; Spectrochemical Analysis, Prentice
Hall: Englewood Cliffs,1988.
34. Airinei, A.; Homocianu, M.; Dorohoi, D. O.; J. Mol. Liq.2010,
157, 13.
35. Golob, V.; Tusek, L.; Dyes Pigm.1999, 40, 211. 36. Bernhardt, C.; Adv. Colloid Interface Sci.1988, 29, 79. 37. Schmitz, J.; Frommelius, H.; Pegelow, U.; Schulte, H.;
Höfer, R.; Prog. Org. Coat.1999, 35, 191.
38. Alves, L. D. S.; Rolim, L. A.; Fontes, D. A. F.; Rolim-Neto, P. J.; Soares, M. F. L. R.; Sobrinho, J. L. S.; Quim. Nova2010,
33, 1967.
39. Technical Information Tamol® L-M; Basf S.A.: São Paulo,
Brazil, 2008.
40. Technical Information Setamol® L-CA; Basf S.A.: São Paulo,
Brazil, 2005.
41. Technical Information Fongranal® FB; Clariant S.A.: São Paulo,
Brazil, 2009.
42. Brito, N. M.; Junior, O. P. A.; Polese, L.; Ribeiro, M. L.;
Pesticidas: R. Ecotox. Meio Ambiente 2003, 13, 129. 43. Strekowski, L.; Wilson, B.; Mutat. Res.2007, 623, 3. 44. Marty, R.; Nsoukpoé-Kossi, C. N.; Charbonneau, D.; Weinert,
C. M.; Kreplak, L.; Tajmir-Riahi, H.; Nucleic Acids Res. 2009,
37, 849.
45. Kashanian, S.; Dolatabadi, J.; Ezzati, N.; Food Chem.2009,
116, 743.
Submitted: December 15, 2011
Published online: July 12, 2012