0103 - 5053 $6.00+0.00
A
r
ti
c
le
* e-mail: [email protected]
Molecular Graphics-Structural and Molecular Graphics Descriptors in a QSAR Study
of 17-
α
-Acetoxyprogesterones
Rudolf Kiralj and Márcia M. C. Ferreira*
Instituto de Química, Universidade Estadual de Campinas, CP 6154, 13084-971 Campinas - SP, Brazil
Neste trabalho, foi feito um estudo de relações quantitativas entre a estrutura e a atividade biológica de 21 derivados de progesteronas ministrados via oral, dentre os quais 19 são 17-α -acetoxiprogesteronas. O método de quadrados mínimos parciais foi usado para construir modelos de regressão de boa qualidade, com Q2 = 0,707 e R2 = 0,811 utilizando duas componentes principais e
quatro descritores. A maioria dos descritores moleculares foi obtida a partir de gráficos moleculares das geometrias otimizadas por meio de cálculos ab initio com um conjunto de base DFT 6-31G** (descritores moleculares gráficos). Os outros descritores foram obtidos pela combinação dos descritores anteriores com parâmetros estruturais experimentais extraídos do complexo progesterona-receptor da progesterona (descritores gráfico-estruturais ou descritores gráficos e de modelagem). Os modelos de regressão empregando somente cinco descritores gráficos e três componentes principais foram satisfatórios, Q2=0,556, R2=0,718, demonstrando a utilidade dos mesmos em
estudos QSAR. Neste trabalho, onde foram estudados derivados de progesterona, ficou evidente que os descritores moleculares gráficos descreveram com sucesso os efeitos conformacionais, estéreos e eletrônicos dos diferentes substituintes.
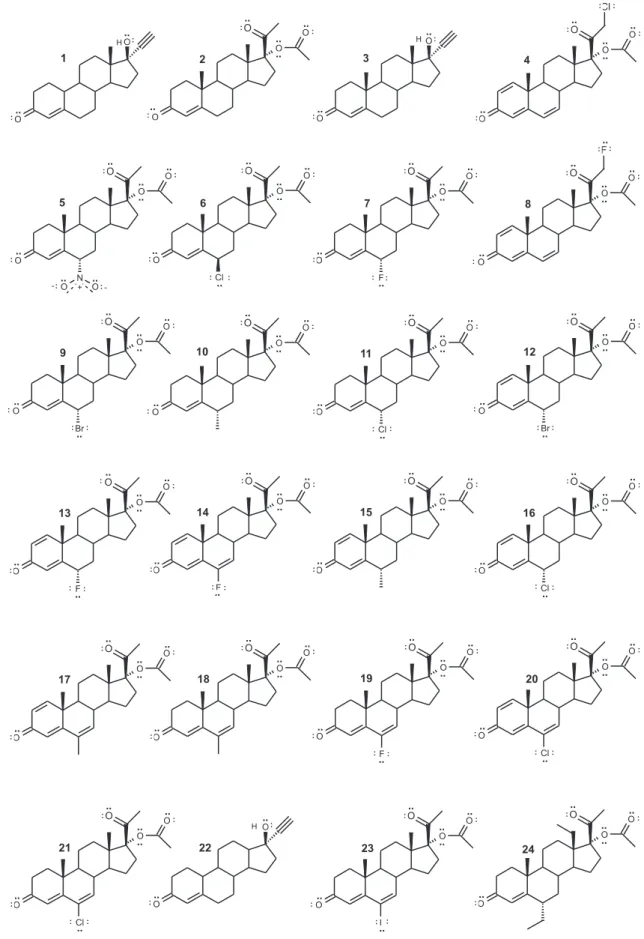
Quantitative Structure-Activity Relationship study on 21 oral progestogens, 19 of which are
17-α-acetoxyprogesterones, was performed by using Partial Least Squares. Fairly good regression models were achieved, the best being Q2=0.707, R2=0.811 with two Principal Components and four
descriptors. Most of the molecular descriptors were generated from molecular graphics of DFT 6-31G** optimized geometries (molecular graphics descriptors) or were additionally combined with experimental structural parameters of progesterone receptor - progesterone complex (molecular graphics-structural, or molecular graphics and modeling descriptors). Regression models employing only these molecular graphics-based descriptors reached Q2=0.556, R2=0.718 with three Principal
Components and five descriptors, demonstrating their usefulness in QSAR studies. In the case of progesterone derivatives, molecular graphics descriptors successfully included various conformational, steric and electronic substituent effects.
Keywords: progesterone derivatives, partial least squares, molecular graphics descriptors, molecular graphics-structural descriptors
Introduction
Progestogens, progesterone derivatives, nowadays are widely known as oral contraceptives. Besides that, health research1-4 (hormone replacement and anti-cancer therapies, gynecological disorders etc.) and veterinary practice (animal birth control)5,6 are today the two most promising areas of progestogen applications. It is difficult to have an entirely clear picture of the progestogen behavior at atomic level due to the lack of large amount and homogeneity of progestogen activity data. Progesterone derivatives have
been used as target of various Structure-Activity Relationship (SAR) and Quantitative SAR (QSAR) studies since four decades ago.7 Progesterone (Figure 1), although having relatively simple structure, is a quite complicated molecular system. That is why researchers had to confront with the difficulty in quantifying the progestogen molecular properties without knowing 3D receptor-drug structure, and also to develop appropriate methods to treat the nonlinearity of steroid QSAR.8 Recently, the crystal structure of progesterone receptor (PR) – progesterone complex9 made possible to explain mutations at atomic level10 and perform more advanced drug design.
oral progestational activity (relative to norethisterone, IC),14 19 of which are 17-α-acetoxyprogesterones (Figure 2, Table 1), at the level of prediction using Partial Least Squares (PLS)15 regression models. In previous work13 various classes of molecular descriptors, as a priori,16 computed (at DFT ab initio level) and some molecular graphics-based descriptors were calculated, and PLS models were constructed and validated. It was observed that the new class of descriptors, molecular graphics-based descriptors, had significant contribution in PLS models, but more extensive study about this finding has not been performed yet. High-quality 2D projections of molecules or molecular aggregates obtained by current molecular graphics techniques can be an extensive source of quantitative information on molecular properties. In general, quantities directly “measured” from pictures using some digital or analogue technique can be 1D (linear, like molecular dimensions), 2D (surface areas of various molecular fragments projected onto the plane of projection or screen) or 3D (as molecular volume in some cases). Such measured descriptors, their combinations or functions can be named
molecular graphic descriptors. Combination of these descriptors with some structural information from other sources (like data from experimental structure determination or molecular modeling), yields composite functions which can be called molecular graphics-structural descriptors or
molecular graphics and modeling descriptors. Both classes of descriptors can be global (describing the entire molecule) or local (being related to some molecular fragment). Using
molecular graphics descriptors and some structural information from PR - progestogen complex modeling13 based on crystal structure of PR – progesterone complex,9 three sets of molecular graphics-structural descriptors were generated in this work. PLS models were built and validated for each data set, and the prediction of activity for three progestogens was performed (Figure 2). Finally, two composite descriptors, unweighted 3D-Morse signals 4 and 11,17 were added to the data set and new PLS models were constructed, validated and the predictions were performed. The meaning of the molecular-graphics based descriptors as well as their usefulness is discussed. The main goal of the regression analysis is to estimate the predictive power of PLS models based exclusively on molecular graphics-based descriptors, or on these and other types of molecular descriptors.
Methods
Molecular graphics descriptors
In previous work13 molecular geometries of progestogens 1-24 were optimized at DFT 6-31G** level, and high-quality figures of the molecules were constructed by positioning them along the C6(sp2)-substituent or C6(sp3)-α-substituent bond. Two projected surface areas were measured by analogue, empirical method16 as shown in Figure 3: the projected surface areas of substituent at C6 (S6 – including, and S6’ - excluding hydrogens), and the projected surface area S of atoms or groups describing structural variations of the set 1-21 (H6β and substituents at C1, C2, C6-β, C9-C13, C21). S6’ was set to zero for
C6-αH atom. The choice of surfaces S6 and S as molecular descriptors seemed to be reasonable as their structural variations are in accordance with the induced fit model.7
Most of substitutions in 1-21 are at position C6-α, and it was preliminary observed13 that the biological activity of this set of compounds is a quadratic function of the
Figure 1. Progesterone nomenclature system.
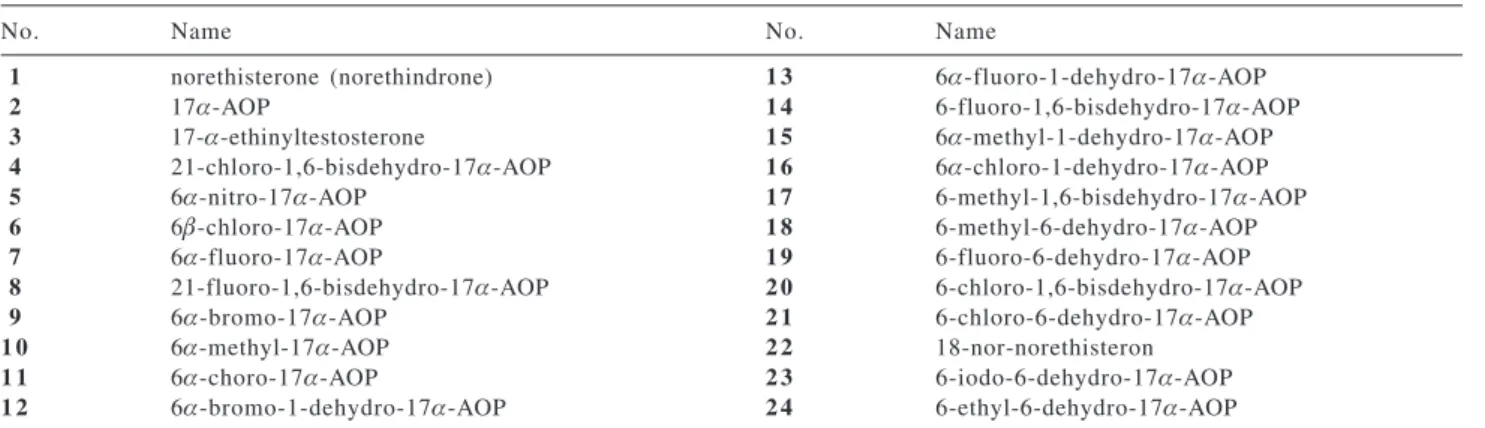
Table 1. Progestogens under study (AOP=acetoxyprogesterone)
No. Name No. Name
1 norethisterone (norethindrone) 1 3 6α-fluoro-1-dehydro-17α-AOP
2 17α-AOP 1 4 6-fluoro-1,6-bisdehydro-17α-AOP
3 17-α-ethinyltestosterone 1 5 6α-methyl-1-dehydro-17α-AOP
4 21-chloro-1,6-bisdehydro-17α-AOP 1 6 6α-chloro-1-dehydro-17α-AOP
5 6α-nitro-17α-AOP 1 7 6-methyl-1,6-bisdehydro-17α-AOP
6 6β-chloro-17α-AOP 1 8 6-methyl-6-dehydro-17α-AOP
7 6α-fluoro-17α-AOP 1 9 6-fluoro-6-dehydro-17α-AOP
8 21-fluoro-1,6-bisdehydro-17α-AOP 2 0 6-chloro-1,6-bisdehydro-17α-AOP
9 6α-bromo-17α-AOP 2 1 6-chloro-6-dehydro-17α-AOP
1 0 6α-methyl-17α-AOP 2 2 18-nor-norethisteron
1 1 6α-choro-17α-AOP 2 3 6-iodo-6-dehydro-17α-AOP
substituent size. On the other side, groups at positions C10, C13 or C21 also affect the activity. The third phenomenon to be taken into account is the saturation
e.g. the presence of double bonds C1=C2, C4=C5 and/or C6=C7, as has been observed almost four decades ago.14 All these phenomena define the active conformation of the steroids, as Zeelen concluded more than two decades ago.18 Molecular graphics observations on studied compounds13 suggested that most of these structural changes can be better viewed along certain directions. The following composite molecular graphics descriptors were calculated:
P1 = S6 + S (1)
P2 = S6’ + S (2)
P3 = waS6’ + S (3)
P4 = wbS6 + S (4)
where wa = c3/c2, wb = d3/d2, ci and di are the coefficients from the linear regression equations y = c1 + c2S6’ + c3S
and y = d1 + d2S6 + d3S, and y is the biological activity (log IC50). The descriptors S6, S, S6’, P1 – P4 are presented in Table 2.
Molecular graphics-structural descriptors
Preliminary molecular graphics and modeling study on PR - progestogen complexes13 including compounds
1-21 revealed that the nonlinear character of progestogen activity is mainly related to sterical relationships between the substituent at C6 (especially the substituent atom bound to C6) and sulfur atom from methionine 801 residue (Figure 4). The most appropriate substituents at C6 are Cl and CH3, while small (H, F) and big (Br) ones reduce the activity. Electronic relationships were not so clearly observed, but the polar NO2 group which is of the appropriate size to fit in the hole between S(Met801) and C6 significantly reduces the activity with respect to that of 1. S(Met801) participates in interactions with C7-H2 group, which can be disturbed by large C6 substituents. On the other side, hydrophobic Met801 residue prefers to
interact with substituents of similar hydrophobicity, i.e. with non-polar or slightly polar groups such as CH3 or higher halogens. The steric effects of C6 substituents were incorporated into new molecular graphics-structural descriptors in the following way: interatomic distances between S(Met801) and atoms of C6 substituent were measured;13D
XS – X…S distance (X is the substituent atom covalently bound to C6); DYS – Y…S distance (Y is the closest substituent atom to the Met801 sulfur); DZS – equals to DXS.
Van der Waals radii determined by Bondi18 were used: RX – vdW radius of atom X, RY – vdW radius of Y, RZ – equals to RX with exception of CH3 group (2.0 instead of 1.70 Å), and RS = 1.80 Å for S. The measure of S-X,Y proximity was calculated as
∆T = DTS – (RS + RT) (5)
where T=X, Y, Z. The three sets of DTS, RT values and experimental biological activities11 are in Table 2. In this way, the substituent sterical effect was linearized. Six molecular graphics-structural descriptors were calculated for each data set:
M1T = (wa – |∆T| / RS ) S6’ + S (6)
M2T = (wa – ∆T / RS ) S6’ + S (7)
M3T = (wb – |∆T| / RS ) S6’ + S (8)
M4T = (wb – ∆T / RS ) S6’ + S (9)
P5T = S (RS - |∆T|) / DTS (10)
P6T = S (RS - ∆T) / DTS (11)
Partial Least Squares models
Three data sets I, II and III were generated such that the descriptors S6, S, S6’, P1 – P4 were common to all of them. In
Figure 4. PR – 6α-choro-progesterone complex at the active site of
the protein. The closest amino-acid residues are shown. The drug (dark) was modeled by replacing 6α-H of progesterone by chlorine atom in the crystal structure of PR – progesterone complex (PDB code: 1A289). Sulfur from methionine 801 (light) is in close contact
with Cl atom of the drug.
Figure 3. Definition of molecular graphics descriptors S6 and S for
addition, the descriptors M1T – M4T, P5T, P6T (for T = X, Y, and Z) were calculated for data sets I, II and III, respectively. Variable selection, validation (leave-one out crossvalidation) of the models and prediction were performed using Pirouette software.20 The data sets were treated independently. The main purpose of this data analysis was to evaluate the binding power and usability of molecular graphics and molecular graphics-structural descriptors for the progestogen QSAR. Finally, knowing that these descriptors cannot describe entirely the 17-a-acetoxyprogesterone activity, two more descriptors previosly calculated13 - unweighted 3D-Morse signals 4 (M04) and 11 (M11),17 were added to each data set. The final models were compared to molecular graphics-based models.
Results and Discussion
Correlations of all molecular descriptors with the biological activity (log IC) are presented in Table 3. PLS models for data sets I, II and III and predictions for 22-24 are in Table 4; the models are named (a) when using all molecular graphics-based descriptors, (b) after variable selection of these descriptors, (c) all descriptors from (a) plus two 3D-Morse signal descriptors, (d) models analogous to the best model from our previous work13 which is presented in Figure 5 (Id).
The correlation coefficients from Table 3 reveal interesting structure-activity relationships. Correlations concerning S, S6, S6’ are low, moderate and high, respectively. By other words, the activity for 1-21 is determined more by C6 substituents than by any other (at C18, C19, C21 substitution sites), what is expected since the active site hole of PR, even after its complexation with progesterone, has the largest unoccupied space around C6.13 Exclusion of hydrogens in S6’ showed to be even a better choice, as they could be considered soft atoms, and so methyl and ethyl groups can be approximated as one or two carbon atoms. Weighted and unweighted linear combinations of descriptors P1 – P4 (equations 1-4) result in better descriptors, what is in accordance with above mentioned induced fit model when all the changes (substitutions, saturations, etc.)
Table 3. Correlation coefficients between the biological activity
(log IC) and molecular descriptors
S6 0.448 M3X 0.631 P6Y 0.703
S 0.168 M3X 0.640 M1Z 0.535
S6’ 0.708 P5X 0.786 M2Z 0.643
P1 0.536 P6X 0.755 M3Z 0.671
P2 0.752 M1Y 0.596 M4Z 0.656
P3 0.732 M2Y 0.612 P5Z 0.788
P4 0.743 M3Y 0.561 P6Z 0.778
M1X 0.608 M4Y 0.594
M2X 0.621 P5Y 0.671
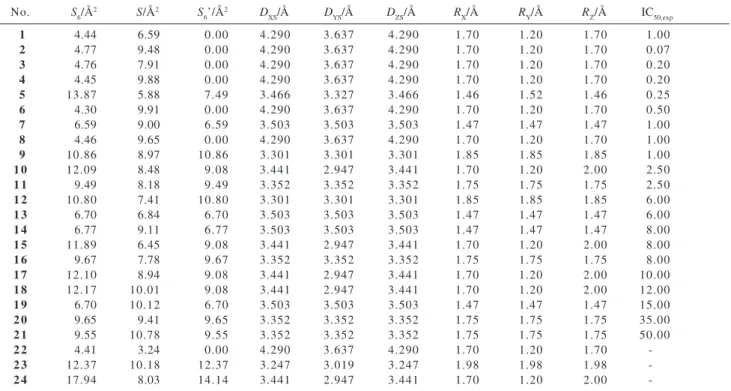
Table 2. QSAR data for progestogens 1-24
No. S6/Å2 S/Å2 S 6’/Å
2 D
XS/Å DYS/Å DZS/Å RX/Å RY/Å RZ/Å IC50,exp
1 4.44 6.59 0.00 4.290 3.637 4.290 1.70 1.20 1.70 1.00
2 4.77 9.48 0.00 4.290 3.637 4.290 1.70 1.20 1.70 0.07
3 4.76 7.91 0.00 4.290 3.637 4.290 1.70 1.20 1.70 0.20
4 4.45 9.88 0.00 4.290 3.637 4.290 1.70 1.20 1.70 0.20
5 13.87 5.88 7.49 3.466 3.327 3.466 1.46 1.52 1.46 0.25
6 4.30 9.91 0.00 4.290 3.637 4.290 1.70 1.20 1.70 0.50
7 6.59 9.00 6.59 3.503 3.503 3.503 1.47 1.47 1.47 1.00
8 4.46 9.65 0.00 4.290 3.637 4.290 1.70 1.20 1.70 1.00
9 10.86 8.97 10.86 3.301 3.301 3.301 1.85 1.85 1.85 1.00
1 0 12.09 8.48 9.08 3.441 2.947 3.441 1.70 1.20 2.00 2.50
1 1 9.49 8.18 9.49 3.352 3.352 3.352 1.75 1.75 1.75 2.50
1 2 10.80 7.41 10.80 3.301 3.301 3.301 1.85 1.85 1.85 6.00
1 3 6.70 6.84 6.70 3.503 3.503 3.503 1.47 1.47 1.47 6.00
1 4 6.77 9.11 6.77 3.503 3.503 3.503 1.47 1.47 1.47 8.00
1 5 11.89 6.45 9.08 3.441 2.947 3.441 1.70 1.20 2.00 8.00
1 6 9.67 7.78 9.67 3.352 3.352 3.352 1.75 1.75 1.75 8.00
1 7 12.10 8.94 9.08 3.441 2.947 3.441 1.70 1.20 2.00 10.00
1 8 12.17 10.01 9.08 3.441 2.947 3.441 1.70 1.20 2.00 12.00
1 9 6.70 10.12 6.70 3.503 3.503 3.503 1.47 1.47 1.47 15.00
2 0 9.65 9.41 9.65 3.352 3.352 3.352 1.75 1.75 1.75 35.00
2 1 9.55 10.78 9.55 3.352 3.352 3.352 1.75 1.75 1.75 50.00
2 2 4.41 3.24 0.00 4.290 3.637 4.290 1.70 1.20 1.70
-2 3 12.37 10.18 12.37 3.247 3.019 3.247 1.98 1.98 1.98
-should determine the active conformation of a progestogen.
M1 – M4 descriptors (equations 6-9) represent extended weighting scheme for linear combination of S and S6’; variable D includes information about the proximity between sulfur from Met801 residue and some substituent atom. If the distance between the atoms is much greater than van der Waals sum of the atomic radii (usually with 0.2 Å tolerance), the atoms have no contact and so no interaction occur. If the atoms penetrate to each other beyond this tolerance, electron correlation would set them at an equilibrium distance, interfering into other drug-protein interactions; by other words, the steric effect would reduce the activity. This substituent size-activity relationship showed to be strictly quadratic at substitution sites C6 and C21.13 Thus the absolute value of ∆ (equation 5) would linearize this effect. M1 – M4 seem not to be better than S6’ and P1 – P4 (Table 3). Inclusion of ∆ into P5 and P6 (equations
10 and 11) give new variables which are much better than
P1 – P4 and even more suitable than S6’ (correlation coefficients reaching 0.79). One could conclude a priori
that S6’, P5 and P6 would be the best variables for QSAR models, but more precise study on the subject should be carried out in variable selection.
The PLS study presented in Table 4 suggests which descriptors would be the most appropriate for progestogen QSAR, and also that models with good quality can be achieved using only these molecular graphics-based descriptors. Two cases should be distinguished among the twelve models: models based only on molecular graphics and molecular graphics-structural descriptors, and models including 3D-Morse variables. In the first case, data compression yields three significant Principal Components (models Ia, IIa, IIIa) and reaches R=0.841, Q=0.695 (model IIa). After variable selection further compression is achieved for Ib and IIIb, while not for IIb; these models include two more variables than the models just suggested above (P1
and P3 show to be the best descriptors, Table 3). These models are not much better than the previous ones (R=0.847,
Q=0.746), but nicely illustrate the meaning and usefulness of molecular graphics-based descriptors: five of them are necessary for a QSAR model, and they can describe the PR - progestogen binding as 2D phenomena. These facts encourage the search for other types of descriptors which can bring some new information on molecular properties, so new PLS models would be more quantitative. Models Ic, IIc, IIIc are such an attempt. The best R=0.932, Q=0.829 (IIc) and standard error of prediction (SEP) was reduced with respect to the previous models. On the other side, these models use three or more PCs and all the variables. Descriptors M04 and M11 contain some information in common with molecular graphics-based descriptors, so only
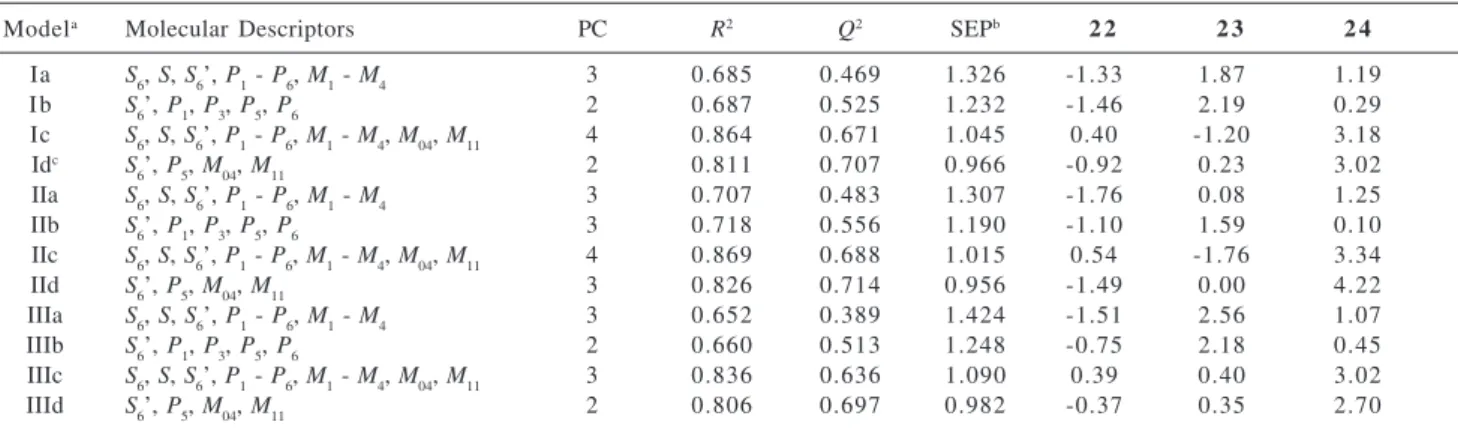
Table 4. PLS models and predictions for 22-24
Modela Molecular Descriptors PC R2 Q2 SEPb 2 2 2 3 2 4
Ia S6, S, S6’, P1 - P6, M1 - M4 3 0.685 0.469 1.326 -1.33 1.87 1.19
I b S6’, P1, P3, P5, P6 2 0.687 0.525 1.232 -1.46 2.19 0.29
Ic S6, S, S6’, P1 - P6, M1 - M4, M04, M11 4 0.864 0.671 1.045 0.40 -1.20 3.18 Idc S
6’, P5, M04, M11 2 0.811 0.707 0.966 -0.92 0.23 3.02
IIa S6, S, S6’, P1 - P6, M1 - M4 3 0.707 0.483 1.307 -1.76 0.08 1.25
IIb S6’, P1, P3, P5, P6 3 0.718 0.556 1.190 -1.10 1.59 0.10
IIc S6, S, S6’, P1 - P6, M1 - M4, M04, M11 4 0.869 0.688 1.015 0.54 -1.76 3.34
IId S6’, P5, M04, M11 3 0.826 0.714 0.956 -1.49 0.00 4.22
IIIa S6, S, S6’, P1 - P6, M1 - M4 3 0.652 0.389 1.424 -1.51 2.56 1.07
IIIb S6’, P1, P3, P5, P6 2 0.660 0.513 1.248 -0.75 2.18 0.45
IIIc S6, S, S6’, P1 - P6, M1 - M4, M04, M11 3 0.836 0.636 1.090 0.39 0.40 3.02
IIId S6’, P5, M04, M11 2 0.806 0.697 0.982 -0.37 0.35 2.70
aIndexes X, Y, Z for variables M
1-M4, P5, P6 were omitted as the variables were named for each data set I, II, III; bStandard error of prediction for validation;
cThe best model in previous work.13
four descriptors (S6’, P5, M04, M11) are sufficient to build a good PLS model (Id, IId, IIId) with only two PCs (the best
R=0.909, Q=0.845 in model IId). These three models seem to be the best ones in QSAR studies.
Prediction of activities for 22-24, compared to the expected13 (22 – non-active due to lack of Me at C18 and C19; 23 – less active than its chlorine analogue; 24 – highly active due to Et placed left to S from Met801), is an additional criterion for searching the best models. Molecule 22 should be even less active than 2 (IC<0.07), the activitiy of 23 in between that of 19 and 21 (IC=23 to 50), and 24 is expected to be far more active than 10 (IC>3) and even more than 21 (IC>50). Models Ic, IIc and IIIc predicted the activities in decreasing order 24 – 22 - 23 instead of 24 – 23 – 22 as expected. Considering all the parameters, Id (Figure 5), IId and IIId can be used as the best PLS models. Of course, in the case where only molecular graphics based-descriptors are utilized, Ia, IIa and IIIa are recommendable models.
Conclusions
New molecular graphics-based descriptors were defined and calculated for 24 progestogens in a QSAR study. Biological activities (oral progestational activities relative to norethisterone) were calculated for 1-21 and predicted for 22-24 employing various PLS models. The best PLS models include molecular graphics-based and 3D-Morse descriptors, and reproduce biological activities for 1-21 satisfactorily well. PLS models show that molecular graphics and molecular graphics-structural descriptors, although having prevalent contribution, are not sufficient to build a high-quality PLS model. The chemical meaning of molecular graphics-based descriptors for progestogens is fully understandable in terms of induced fit model. Prediction of activity for for 22-24 using the best models is in accord with expectations.
Acknowledgment
The authors acknowledge FAPESP for the financial support.
References
1. Gambrell, R. D., Jr.; Arch. Family Med. 1996, 5, 341. 2. Gambrell, R. D., Jr.; Int. J. Fertility1989, 34, 315.
3. Desport, J. C.; Blanc-Vincent, M. P.; Gory-Delabaere, G.; Bachmann, P.; Beal, J.; Benamouzig, R.; Colomb, V.; Kere, D.; Melchior, J. C.; Nitenberg, G.; Raynard, B.; Scheiner, S.; Senesse, P.; Bull. Cancer2000, 87, 315.
4. Baziad, A.; Pache, T.; First Consensus Meeting on Menopause
in the East Asian Region, Geneva, Switzerland, 1997; http:// matweb.hcuge.ch/matweb/bookmp/, accessed: 6 August 2001. 5. Kustritz, M. V. R. In Recent Advances in Small Animal Repro-duction; Concannon, P. W.; England, G.; Verstegen, J., eds.; International Veterinary Information Service: Ithaca; New York. www.ivis.org, accessed: 6 August 2001.
6. Löfstedt, R., In VETGATE, The UK’s Gateway to High Quality Internet Resources in Animal Health. http://www.upei.ca/ ~lofstedt/opence/pande.html, accessed: 6 August 2001. 7. Bursi, R.; Groen, M. B.; Eur. J. Med. Chem. 2000, 35, 787. 8. So, S.-S.; van Helden, S. P.; Geerestein, J. V.; Karplus, M.; J.
Chem. Inf. Comput. Sci. 2000, 40, 762.
9. Williams, S. P.; Sigler, P. B.; Nature1998, 393, 392. 10. Matias, P. M.; Donner, P.; Coelho, T.; Thomaz, M.; Peixoto,
C.; Macedo, S.; Otto, N.; Joschko, S.; Scholz P.; Wegg, A.; Bäslersm S.; Schäfer, M.; Egner, U.; Carrondo, M. A.; J. Biol. Chem. 2000, 275, 26164.
11. Vendrame, R.; M. Ferreira, M. M. C.; Collins, C. H.; Takahata, Y.; J. Mol. Graph. Mod. 2002, 20, 345.
12. Braga, R. S.; Vendrame, R.; Galvão, D. S.; J. Chem. Inf. Comput. Sci.2000, 40, 1377.
13. Kiralj, R.; Takahata, Y.; Ferreira, M. M. C.; Quant. Struct.-Act. Relat., accepted for publication.
14. Shoppe, C. W.; Chemistry of the steroids, 2nd ed., Butterworth:
London, 1964, p. 178.
15. Beebe, K. R.; Pell, R. J.; Seasholtz,; M. B.; Chemometrics: A Pratical Guide, Wiley: New York, 1998.
16. Kiralj, R.; Ferreira, M. M. C.; J. Mol. Graph. Mod., in press. 17. Schuur, J.; Gasteiger, J.; Anal. Chem. 1997, 69, 2398. 18. Zeelen, B. J.; Biol. Act. Chem. Struct. 1977, 147. 19. Bondi, A.; J. Phys. Chem. 1964, 68, 441.
20. Pirouette 3.01, Infometrix, Inc., Seattle, WA, 2001.
Received: November 11, 2001
Published on the web: November 19, 2002