ABSTRACT
ORIGINAL AR
Gilberto Kac
Department of Maternal and Child Nursing and Public Health,
School of Nursing, Universidade Federal de Minas Gerais (UFMG),
Belo Horizonte, MG, Brazil
CONTEXT AND OBJECTIVE: Metabolic syndrome (MS) is recognized worldwide as an important public health concern. However, little information is available for rural populations in Brazil. The aim was to determine the prevalence and risk factors associated with MS in a rural village in Brazil in 2004.
DESIGN AND SETTING: Cross-sectional popula-tion-based study, in Virgem das Graças, a rural community in the Jequitinhonha Valley, State of Minas Gerais.
METHODS: MS was the dependent variable, defined as any three of these risk factors: arte-rial hypertension, high glucose or triglyceride concentrations, low high-density lipoprotein cho-lesterol and abdominal obesity. MS prevalence, according to selected socioeconomic and demo-graphic variables (age, skin color, marital status, schooling and smoking habits), was determined in 251 subjects aged 20-88 years. Multivariate logistic regression was used to estimate odds ratios (OR) and 95% confidence intervals.
RESULTS: MS prevalence was 21.6% (7.7% for men and 33.6% for women); the age-adjusted prevalence was 19.0%. The highest prevalences were observed for women > 60 years of age (52.9%) and women with body mass index (BMI)
≥ 25 kg/m2 (64%). Age, sex and BMI were as-sociated risk factors for MS, while skin color was only significantly associated with MS for women. The models were adjusted for age, smoking habits, marital status, skin color and schooling.
CONCLUSIONS: BMI and age were indepen-dently associated factors for MS in this rural community. These findings provide important evidence on the prevalence of MS as a public health problem, particularly for women and overweight individuals.
KEY WORDS: Metabolic syndrome X. Hyperten-sion. Obesity. Body mass index. Rural popula-tion. Brazil.
INTRODUCTION
Chronic and degenerative diseases are the most important causes of mortality among the population of Brazil. In 2001, dis-eases of the circulatory system such as heart ischemia and cerebrovascular disorders were the primary causes of death, responsible for approximately 32% of the cases, followed by external trauma (15%) and neoplasia (14%). In contrast, infectious and parasitic diseases were responsible for just 6% of deaths during the same period.1
Overall, in the past decades, the Brazil-ian population has experienced relatively rapid socioeconomic improvement, resulting in many lifestyle modifications that have promoted increased prevalence of obesity and associated diseases, such as diabetes and dyslipidemias, which are considered to be part of the nutritional transition process. For example, consumption of high energy density foods that are rich in fats and sugar has increased. In contrast, physical activity and grain/legume intake have decreased.2
The main risk factors for the occurrence of circulatory diseases are obesity, hyperten-sion, diabetes, metabolic dyslipidemias and an inadequate lifestyle. Metabolic syndrome (MS) has been described as being the condi-tion in which at least three of the acknow- ledged risk factors are observed simultane-ously.3 Epidemiological studies have shown
that MS is relatively common in societies that have undergone alterations in lifestyle habits, typically occasioned by economic and technological changes. Thus, it has been estimated that 44% of the American population above 50 years of age are affected with MS.4
Cross-sectional population-based studies have shown that the presence of MS is as-sociated with the risk of myocardial infarc-tion and stroke.5,6 These results have been
confirmed by cohort studies.7 Furthermore,
the components of MS, either independently or together, are considered to be important risk factors for mortality, even in the ab-sence of evident diabetes and cardiovascular diseases.8 Thus, these studies suggest that
diagnosing MS may contribute towards identifying groups that are at increased risk of suffering from cardiovascular diseases and their consequences.
A number of authors have reported high MS prevalence and increased mortality rates in specific populations and ethnic groups, mostly among those that are in the active stages of epidemiological transition and are more vulnerable to cardiovascular diseases.9-11
However, the data concerning the prevalence of MS among urban and rural populations in Brazil are very limited.
OBJECTIVE
The aim of the present study was to deter-mine the prevalence and risk factors associated with MS in a rural area in the state of Minas Gerais (MG), Brazil.
METHODS
oth-ers are migrant workoth-ers from other areas in search of work. In spite of access to a public school and a health district outpost, access to health and education is limited.
The settlements studied, referred to as Taboca, Cardoso I, II and III and Sussuarana, are located along the Cardoso and Sussuarana streams, which are both tributaries emptying into the Jequitinhonha River. None of the village communities have local installations that treat their main water supply, nor do they treat their human waste. The Taboca community’s main source of water supply is derived from a protected spring that is used as a central community reservoir that supplies water to the village homes. Since the main water source does not produce suffi-cient quantity of water for the villagers’ daily domestic needs, many use the nearby stream to satisfy their additional needs. On the other hand, most houses in the villages have their own private water supply that is either piped from protected springs or is fetched by hand from streams, canals, unprotected springs or wells. A unique identification number was allocated to each house and to every one of its occupants in all of the villages. At the time of this study, Virgem das Graças had a total population of 685 residents; 278 of them were less than 18 years of age, seven pregnant women, four individuals presented with medical-surgi-cal impediments and 11 emigrants met the exclusion criteria, leaving 385 eligible subjects. Additionally, 134 individuals ei-ther did not have any biochemical analysis (n = 34), refused to participate (n = 56) or were absent at the time of the survey (n = 44), and thus were excluded, resulting in a final sample of 251 subjects (117 men and 134 women).
Data collection
The participants completed a survey questionnaire covering various aspects of their social and economic conditions. The following variables were investigated: age categories (18-29, 30-42, 43-59, 60-88 years), skin color (white, mixed/black), marital status (married, living with part-ner, single, widowed/separated), smoking habits (smoker, non-smoker, former smoker) and schooling (zero, 1-14 years). In addi-tion, female subjects were asked about their obstetric history (parity).
At the conclusion of the interview, a clini-cal evaluation of subjects was performed which included anthropometry and a blood test to determine glucose and lipid concentrations.
Anthropometry
All measurements were carried out in triplicate, by well-trained anthropometrists in accordance with standard procedures,12
and the mean values were recorded. Body weight was determined with subjects wearing light clothes and no shoes or socks, using an electronic scale (Filizola® model PL150, São
Paulo,Brazil). Height was determined using a wall-mounted, non-extendable two-meter measuring tape (accurate to 0.1 cm) with sub-jects in a standing position, feet together and head placed according to the Frankfürt plan. Waist circumference (WC) was measured to the nearest millimeter using a non-extendable measuring tape, and taken exactly halfway between the margin of the lowest rib and the iliac crest with participants in a standing posi-tion. Body mass index (BMI) was calculated using the expression:
BMI = weight (kg)/height2 (m).
Definition of metabolic syndrome
The definition of MS used in this study was the one recommended by the National Cholesterol Education Program (NCEP),13
which is based on the detection of three or more of the following conditions: arterial hy-pertension (systolic pressure ≥ 130 mmHg or diastolic pressure ≥ 85 mmHg), high glucose (≥ 110 mg/dl), hypertriglyceridemia (TG ≥ 150 mg/dl), low level of high-density lipopro-tein cholesterol (HDL-C; < 40 mg/dl for males and < 50 mg/dl for females), and abdominal obesity (waist circumference, WC ≥ 102 cm for males and ≥ 88 cm for females). In this study, individuals undergoing treatment for hypertension or diabetes were automatically classified as presenting those conditions.
Determination of arterial blood pressure
Arterial blood pressure was determined by an indirect method, using a calibrated mercury sphygmomanometer, following the recommendations of the Joint National Com-mittee14 and in accordance with Brazilian
Guidelines for Arterial Hypertension.15
Measurements were obtained with the sub-ject in a sitting position and the right arm extended at shoulder level: the beginning of the audio indication of auscultation was the marker for recording arterial systolic pressure, and the termination of this indication was the marker for recording the arterial diastolic pressure. Measurements were carried out in triplicate for each subject with an interval
of two minutes between readings, and mean values were calculated.
Biochemical analyses
Blood samples (5 ml) were collected from each subject by venous puncture following a fasting period of 12 h. Aliquots of serum and plasma were obtained by centrifugation of each sample, and were appropriately treated and stored in vials maintained at 4o C until
required by the laboratory for biochemical analysis. Colorimetric enzymatic methods were used for determining glucose, triglycer-ides (TG) and total cholesterol using a Roche Cobas Mira Plus analyzer. The HDL-C con-centration was also determined by colorimetric enzymatic assay following precipitation of the low-density lipoprotein cholesterol (LDL-C) and very low-density lipoprotein cholesterol (VLDL-C) fractions using phosphotungstic acid and magnesium chloride. The LDL-C concentrations were calculated by applying the Friedewald equation.16
Statistical analyses
The information collected was entered into a data bank and analyzed using the Epi-Info version 3.3.2 and Statistical Package for the Social Sciences (SPSS) version 8.0 software. MS was defined as the dependent variable, while sex, age, skin color, marital status, smoking habits, schooling, presenta-tion of overweight (BMI ≥ 25 kg/m2) and
obesity (BMI ≥ 30 kg/m2), and (for women)
parity, were considered to be the covariables of interest. By applying the χ2 test,
covari-able distributions were initially stratified according to sex, and the prevalences of MS components between the sexes were com-pared. The statistical significance level was established at 5% (p < 0.05).
Associations between the dependent variable and covariables were determined using bivariate analysis. Odds ratios (OR) and the respective 95% confidence intervals (95% CI) were determined separately for males and females. The final non-condi-tional multivariate logistic regression model was established using a forward stepwise procedure, separately for females and the whole population. The order of inclusion of the variables in the final model was from the highest to the lowest OR value. The evaluation of these models was performed according to the goodness-of-fit test.
Minas Gerais, in accordance with National Health Council Resolution 196/96. All of the subjects who took part in the study were informed about the objectives of the research and their rights as participants, and then were asked to sign a consent form.
RESULTS
The overall prevalence of MS among the study population was 21.6% (95% CI: 16.6 – 27.1), and it was 33.6% for women and 7.7% for men. When the values were adjusted to take into account the age distribution of the study population in comparison with a standard population of a rural area in Minas Gerais,17 the estimated frequency of MS was
19.0% (95% CI: 13.7 – 24.3) for the whole study population, and it was 30.8% for women and 5.8% for men.
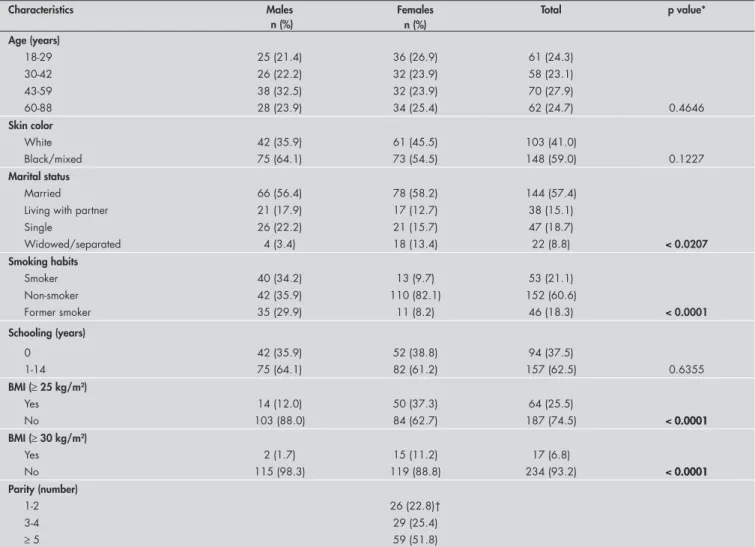
Table 1 shows the characteristics of the study population according to sex. Among the variables that presented statistically
sig-nificant differences between male and female subjects were marital status, smoking habits, overweight and obesity. The frequency of sin-gle adults was higher among men, while the frequency of widowed and separated status was higher among women. Smoking was more com-mon acom-mong men, while overweight and obesity showed a higher prevalence among women.
Examination of the individual com-ponents that constituted MS in males and females showed that there was a significant difference with regard to HDL-C and waist circumference (Table 2). The prevalence of low HDL-C and abdominal obesity was higher among women than among men. Overall, the number of subjects suffering from arterial hypertension was 62.5%.
Table 3 shows the distribution of MS be-tween males and females in the study popula-tion according to the selected covariables of age, skin color, marital status, smoking hab-its, schooling, BMI and (for women) parity.
The prevalence of MS increased with age for both males and females, although the highest frequency (52.9%) was observed in women between the ages of 60 and 88 years. MS was more prevalent among black/mixed women (42.5%) than among white women. Lower prevalence of MS was found in single adults than in other categories, and in subjects with at least one year of schooling in comparison with illiterate subjects.
The prevalence of MS was significantly higher in overweight (OR = 17.88) and obese (OR = 22.62) subjects for the whole popula-tion, while the respective values of OR for MS in overweight and obese women were 9.70 and 10.42. Other factors that influenced the occurrence of MS among women were: ages 60 to 88 years (OR = 9.00), parity ≥ 5 (OR = 3.71), mixed/black skin color (OR = 2.48) and lack of schooling (OR = 2.16). The values for men were not considered sufficiently accurate for analysis (Table 3).
Table 1.Characteristics of the study population in Virgem das Graças, Brazil, according to sex
Characteristics Males Females Total p value*
n (%) Age (years)
18-29 25 (21.4) 36 (26.9) 61 (24.3)
30-42 26 (22.2) 32 (23.9) 58 (23.1)
43-59 38 (32.5) 32 (23.9) 70 (27.9)
60-88 28 (23.9) 34 (25.4) 62 (24.7) 0.4646
Skin color
White 42 (35.9) 61 (45.5) 103 (41.0)
Black/mixed 75 (64.1) 73 (54.5) 148 (59.0) 0.1227
Marital status
Married 66 (56.4) 78 (58.2) 144 (57.4)
Living with partner 21 (17.9) 17 (12.7) 38 (15.1)
Single 26 (22.2) 21 (15.7) 47 (18.7)
Widowed/separated 4 (3.4) 18 (13.4) 22 (8.8) < 0.0207
Smoking habits
Smoker 40 (34.2) 13 (9.7) 53 (21.1)
Non-smoker 42 (35.9) 110 (82.1) 152 (60.6)
Former smoker 35 (29.9) 11 (8.2) 46 (18.3) < 0.0001
Schooling (years)
0 42 (35.9) 52 (38.8) 94 (37.5)
1-14 75 (64.1) 82 (61.2) 157 (62.5) 0.6355
BMI (≥ 25 kg/m2)
Yes 14 (12.0) 50 (37.3) 64 (25.5)
No 103 (88.0) 84 (62.7) 187 (74.5) < 0.00010.0001
BMI (≥ 30 kg/m2)
Yes 2 (1.7) 15 (11.2) 17 (6.8)
No 115 (98.3) 119 (88.8) 234 (93.2) < 0.00010.0001
Parity (number)
1-2 26 (22.8)†
3-4 29 (25.4)
≥ 5 59 (51.8)
Table 2. Components of metabolic syndrome among the study population in Virgem das Graças, Brazil, according to sex
Components of metabolic syndrome* Males Females Total p value†
n (%) Arterial hypertension
Yes 77 (65.8) 80 (59.7) 157 (62.5)
No 40 (34.2) 54 (40.3) 94 (37.5) 0.3193
Diabetes
Yes 6 (5.1) 9 (6.7) 15 (6.0)
No 111 (94.9) 125 (93.3) 236 (94.0) 0.5971
Hypertriglyceridemia
Yes 24 (20.5) 32 (23.9) 56 (22.3)
No 93 (79.5) 102 (76.1) 195 (77.7) 0.5234
Low HDL-C
Yes 27 (23.1) 66 (49.3) 93 (37.1)
No 90 (76.9) 68 (50.7) 158 (62.9) < 0.00010.0001
Abdominal obesity
Yes 5 (4.3) 62 (46.3) 67 (26.7)
No 112 (95.7) 72 (53.7) 184 (73.3) < 0.00010.0001
Number of co-occurring components
0 26 (22.2) 27 (20.1) 53 (21.1)
1 56 (47.9) 33 (24.6) 89 (35.5)
2 26 (22.2) 29 (21.6) 55 (21.9)
3 5 (4.3) 25 (18.7) 30 (12.0)
4 4 (3.4) 17 (12.7) 21 (8.4)
5 0 (0.0) 3 (2.2) 3 (1.2) < 0.0001
*Components defined by the National Cholesterol Education Program9 as: arterial hypertension (systolic pressure ≥ 130 mmHg or diastolic pressure ≥ 85 mmHg); glucose after fasting (≥ 110 mg/dl);
hypertriglyceridemia (TG ≥ 150 mg/dl); low high-density lipoprotein-cholesterol (HDL-C; males < 40 mg/dl and females < 50 mg/dl); and abdominal obesity (waist circumference; males ≥ 102 cm and females ≥ 88 cm). †χ2 test for proportions.
Table 3.Prevalence of metabolic syndrome among the male, female and total study populations in Virgem das Graças, Brazil
Variables Males Females Total
n (prevalence) OR (95% CI) n (prevalence) OR (95% CI) n (prevalence) OR (95% CI)
Age (years)
18-29 0 (0.0) 1.00 4 (11.1) 1.00 4 (6.6) 1.00
30-42 0 (0.0) inexact 11 (34.4) 1.87 [0.70 - 5.00] 11 (19.0) 1.71 [0.80 - 3.64] 43-59 5 (13.2) inexact 12 (37.5) 2.14 [0.79 - 5.79] 17 (24.3) 2.35 [1.01 - 5.43] 60-88 4 (14.3) inexact 18 (52.9) 9.00 [2.60 - 31.05] 22 (35.5) 7.83 [2.50 - 24.48]
Skin color
White 5 (11.9) 1.00 14 (23.0) 1.00 19 (18.4) 1.00
Mixed/black 4 (5.3) 0.42 [0.10 - 1.64] 31 (42.5) 2.48 [1.16 - 5.28] 35 (23.6) 1.37 [0.73 - 2.56]
Marital Status
Married 6 (9.1) 3.16 [0.21 - 46.72] 29 (37.2) 1.52 [0.37 - 6.25] 35 (24.3) 2.53 [0.76 - 8.36] Living with partner 2 (9.5) 3.33 [0.30 - 37.25] 5 (29.4) 1.07 [0.37 - 3.08] 7 (18.4) 1.77 [0.69 - 4.60]
Single 0 (0.0) 1.00 4 (19.0) 1.00 4 (8.5) 1.00
Widowed/separated 1 (25.0) inexact 7 (38.9) 2.70 [0.63 - 11.45] 8 (36.4) 6.14 [1.60 - 23.53]
Smoking habits
Smoker 2 (5.0) 2.15 [0.18 - 24.75] 3 (23.1) 0.54 [0.14 - 2.10] 5 (9.4) 0.42 [0.13 - 1.39]
Non-smoker 1 (2.4) 1.00 39 (35.5) 1.00 40 (26.3) 1.00
Former smoker 6 (17.1) 0.25 [0.05 - 1.35] 3 (27.3) 0.80 [0.12 - 5.10] 9 (19.6) 0.29 [0.10 - 0.78]
Schooling (years)
0 5 (11.9) 2.40 [0.60 - 9.47] 23 (44.2) 2.16 [1.03 - 4.50] 28 (29.8) 2.14 [1.16 - 3.93]
1-14 4 (5.3) 1.00 22 (26.8) 1.00 26 (16.6) 1.00
BMI (≥ 25 kg/m2)
Yes 7 (50.0) inexact 32 (64.0) 9.70 [4.24 - 22.18] 39 (60.9) 17.88 [8.63- 37.05]
No 2 (1.9) 1.00 13 (15.5) 1.00 15 (8.0) 1.00
BMI (≥ 30 kg/m2)
Yes 2 (100.0) 50.50 [8.79 – 290.0] 12 (80.0) 10.42 [2.76 - 39.30] 14 (82.4) 22.62 [6.21 - 82.41]
No 7 (6.1) 1.00 33 (27.7) 1.00 40 (17.1) 1.00
Parity (number)
1-2 9 (19.6) 1.00
3-4 8 (27.6) 2.37 [0.90 - 6.20]
≥ 5 28 (47.5) 3.71 [1.52 - 9.04]
OR = odds ratio; 95% CI = 95% confidence interval; BMI = body mass index.
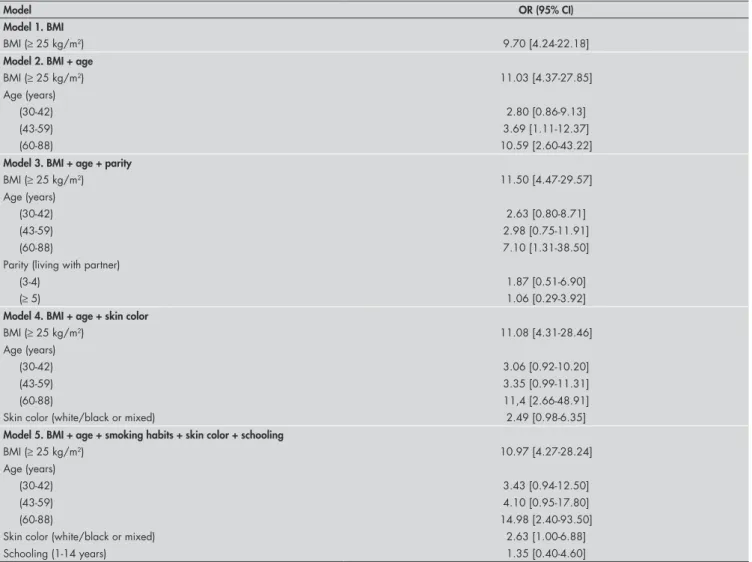
Table 4 shows the results from the final regression analysis model determined for female subjects, and Table 5, for the popula-tion as a whole. The variables that remained statistically associated with MS in the final model were overweight and age, while skin color was only significantly associated with MS in females.
DISCUSSION
One important result revealed by the present study was the large and significant difference in the prevalence of MS between men (7.7%) and women (33.6%) in the rural community of Virgem das Graças. This difference may be attributed to the high frequency of abdominal obesity and low concentrations of HDL-C among the women of this community. These findings corroborate the hypothesis that metabolic
disorders are more prevalent in females than males, and that high body weight, large waist circumference and low HDL-C are the main contributing factors.18 Such differences
between the sexes have also been observed in the Canary Islands population.19
The age-standardized prevalence of MS in Virgem das Graças was also very high, at 19% (95% CI: 13.7 – 24.3). The frequency of MS increased with age for both sexes, such that approximately 50% of the female popu-lation above 60 years of age manifested the syndrome. In contrast, the frequency of MS among men of this age group was only 14.3%. Previous studies in Brazil have focused on the frequency of the individual components of MS. For this reason, the level of occurrence of MS within the whole Brazilian population and the factors that determine its prevalence are still unclear.20-22
A further important result deriving from the present study was the strong association de-tected between MS and overweight, particularly when the whole population was considered. These variables remained significantly associ-ated following adjustment for a number of covariables including age, skin color, marital status, smoking habits and schooling. Recent research in a rural area of Korea23 showed that
the prevalence of MS was higher despite the low prevalence of obesity or abdominal obesity. However, this was not confirmed in the present study, in which the prevalences of the latter factors were 6.8% and 26.7%, respectively. Longitudinal analyses have demonstrated that BMI plays a central role in the development and identification of MS, and overweight is an important predictor of the syndrome.24
It is important to consider the type of criteria used for characterizing MS. One
Table 4.Adjusted values for odds ratios and 95% confidence intervals relating to regression analysis models for metabolic syndrome determined for the female study population in Virgem das Graças, Brazil
Model OR (95% CI)
Model 1. BMI
BMI (≥ 25 kg/m2) 9.70 [4.24-22.18]
Model 2. BMI + age
BMI (≥ 25 kg/m2) 11.03 [4.37-27.85]
Age (years)
(30-42) 2.80 [0.86-9.13]
(43-59) 3.69 [1.11-12.37]
(60-88) 10.59 [2.60-43.22]
Model 3. BMI + age + parity
BMI (≥ 25 kg/m2) 11.50 [4.47-29.57]
Age (years)
(30-42) 2.63 [0.80-8.71]
(43-59) 2.98 [0.75-11.91]
(60-88) 7.10 [1.31-38.50]
Parity (living with partner)
(3-4) 1.87 [0.51-6.90]
(≥ 5) 1.06 [0.29-3.92]
Model 4. BMI + age + skin color
BMI (≥ 25 kg/m2) 11.08 [4.31-28.46]
Age (years)
(30-42) 3.06 [0.92-10.20]
(43-59) 3.35 [0.99-11.31]
(60-88) 11,4 [2.66-48.91]
Skin color (white/black or mixed) 2.49 [0.98-6.35]
Model 5. BMI + age + smoking habits + skin color + schooling
BMI (≥ 25 kg/m2) 10.97 [4.27-28.24]
Age (years)
(30-42) 3.43 [0.94-12.50]
(43-59) 4.10 [0.95-17.80]
(60-88) 14.98 [2.40-93.50]
Skin color (white/black or mixed) 2.63 [1.00-6.88]
Schooling (1-14 years) 1.35 [0.40-4.60]
definition has been proposed by the NCEP,13
and this was the one used in the present study. The other definition has been adopted by the World Health Organization (WHO).25 The
latter includes insulin resistance and measure-ments of micro-albuminuria to detect vas-cular damage. The two definitions appear to have good agreement; their concordance has been measured as 86.2. In a study involving an American adult population, 23.9% of the individuals were affected by MS according to the NCEP criteria, and 25.1% according to the WHO criteria26. These criteria were
also valid in a cohort study, as they iden-tify the individuals with a five to nine-fold increased likelihood of diabetes during a follow-up population-based study among middle-age men.27
Table 5. Adjusted values for odds ratios and 95% confidence intervals relating to regression analysis models for metabolic syndrome determined for the whole study population in Virgem das Graças, Brazil
Model OR (95% CI)
Model 1. BMI
BMI (≥ 25 kg/m2) 17.88 [8.63-37.05]
Model 2. BMI + age
BMI (≥ 25 kg/m2) 23.38 [10.15-53.89]
Age (years)
(30-42) 2.95 [1.09-8.00]
(43-59) 4.28 [1.43-12.75]
(60-88) 13.24 [3.40-51.43]
Model 3. BMI + age + marital status
BMI (≥ 25 kg/m2) 23.18 [10.05-53.43]
Age (years)
(30-42) 2.82 [1.02-7.85]
(43-59) 3.95 [1.26-12.43]
(60-88) 11.41 [2.48-52.45]
Marital status
(married) 1.18 [0.34-4.03]
(living with partner) 1.29 [0.27-6.15]
(other) 1.47 [0.24-9.05]
Model 4. BMI + age + smoking habits
BMI (≥ 25 kg/m2) 20.84 [8.85-49.09]
Age (years)
(30-42) 3.38 [1.22-9.36]
(43-59) 5.89 [1.82-19.04]
(60-88) 20.75 [4.98-86.47]
Smoking habits
(smoker) 1.06 [0.26-4.36]
(former smoker) 0.35 [0.11-1.20]
Model 5. BMI + age + schooling
BMI (≥ 25 kg/m2) 21.14 [8.43-50.01]
Age (years)
(30-42) 3.15 [1.08-9.18]
(43-59) 5.18 [1.38-19.41]
(60-88) 17.58 [3.45-49.51]
Schooling (1-14 years) 1.22 [0.46-3.23]
OR = odds ratio; 95% CI = 95% confidence interval, BMI = body mass index.
The prevalence of MS varies consider-ably worldwide. For example, the frequency of MS in a sample of the Chinese population was recorded as 9.8% for men and 17.8% for women.28 However, the prevalence of
over-weight individuals in the same population was much higher; 26.9% for men and 31.1% for women. In a rural area of South Korea, MS was found to affect 29.4% of the adult population above 40 years of age,23 and similar values were
established in Mexico, where 26.6% of the population studied exhibited the syndrome.29
MS is a multiple disorder associated with cardiovascular diseases and is currently per-ceived as a serious public health problem by national and international authorities world-wide. Within this context, MS is considered to be a pre-diabetic state leading to type II
diabetes mellitus.3 The extent of the problem
is illustrated in the United States population, indicating that 22% of adults presented MS, a frequency that increased to 42% for individuals in the age range of 60 to 69 years of age. The prevalence among African-American women was reported to be even higher still.26,30
so-cieties, including rural areas, as demonstrated in this study. To our knowledge,the prevalence of metabolic syndrome has neverbeen studied in a Brazilian rural population and, for this reason, it is difficult to compare our results within the Brazilian context.
The main limitation of the present study, which might restrict the external validity of the analyses performed, derives from the relative small sample population studied. While the number of subjects considered was repre-sentative of the adult population of Virgem
das Graças, the sample was deficient in young adults who had undergone schooling for a pe-riod greater than five years. This is a common difficulty encountered in studies performed in rural areas, since there is a general tendency for young people to migrate to urban centers in search of better education and/or work. In order to overcome this difficulty, the fre-quency of MS in the whole study population was adjusted according to the age profile, in comparison with a standard population from a rural area in Minas Gerais.17
CONCLUSIONS
The present study demonstrated that MS is a serious problem among this poor rural community, affecting primarily women and individuals over 60 years of age. The prevalence of MS in these two groups war-rants further investigation using a larger rural sample population, since the preven-tion and treatment of this condipreven-tion is of major public concern and urgently requires the application of appropriate policies and considerable investment.
1. BRASIL. Ministério da Saúde. Secretaria de Vigilância em Saúde. Departamento de Análise de Situação de Saúde. Saúde Brasil 2004: uma análise da situação de saúde. Brasília: Mi-nistério da Saúde, 2004. Available from: http://portal.saude.Available from: http://portal.saude. gov.br/portal/arquivos/pdf/saude_brasil_2004.pdf. Accessed in 2007 (May 22).
2. Bermudez OI, Tucker KL. Trends in dietary patterns of Latin American populations. Cad Saude Publica. 2003;19(Suppl 1):. 2003;19(Suppl 1): S87-99.
3. Grundy SM, Brewer HB Jr, Cleeman JI, et al. Definition of met-abolic syndrome: Report of the National Heart, Lung, and Blood Institute/American Heart Association conference on scientific issues related to definition. Circulation. 2004;109(3):433-8. 4. Alexander CM, Landsman PB, Teutsch SM, Haffner SM; Third
National Health and Nutrition Examination Survey (NHANES III); National Cholesterol Education Program (NCEP). NCEP-defined metabolic syndrome, diabetes, and prevalence of coronary heart disease among NHANES III participants age 50 years and older. Diabetes. 2003;52(5):1210-4. 5. Ninomiya JK, L’Italien G, Criqui MH, Whyte JL, Gamst
A, Chen RS. Association of the metabolic syndrome with history of myocardial infarction and stroke in the Third Na-tional Health and Nutrition Examination Survey. Circulation. 2004;109(1):42-6.
6. He Y, Jiang B, Wang J, et al. Prevalence of the metabolic syn-Prevalence of the metabolic syn-drome and its relation to cardiovascular disease in an elderly Chinese population. J Am Coll Cardiol. 2006;47(8):1588-94. 7. Koren-Morag N, Goldbourt U, Tanne D. Relation between the
metabolic syndrome and ischemic stroke or transient ischemic attack: a prospective cohort study in patients with atherosclerotic cardiovascular disease. Stroke. 2005;36(7):1366-71. 8. Lakka HM, Laaksonen DE, Lakka TA, et al. The metabolicThe metabolic
syndrome and total and cardiovascular disease mortality in middle-aged men. JAMA. 2002;288(21):2709-16. 9. Misra A. C-reactive protein in young individuals: problems and
implications for Asian Indians. Nutrition. 2004;20(5):478-81. 10. Ozsahin AK, Gokcel A, Sezgin N, et al. Prevalence of the
metabolic syndrome in a Turkish adult population. Diabetes Nutr Metab. 2004;17(4):230-4.
11. Martínez-Larrad MT, Fernández-Pérez C, González-Sánchez JL, et al. Prevalencia del síndrome metabólico (criterios del ATP-III). Estudio de base poblacional en áreas rural y urbana de la provincia de Segovia. [Prevalence of the metabolic syndrome (ATP-III criteria). Population-based study of rural and urban areas in the Spanish province of Segovia]. Med Clin (Barc). 2005;125(13):481-6.
12. Lohman TG, Roche AF, Martorell R. Anthropometric standardi-zation reference manual. Champaign: Human Kinetics; 1988. 13. Expert Panel on Detection, Evaluation, and Treatment of High Blood Cholesterol in Adults. Executive Summary of the Third Report of The National Cholesterol Education Program (NCEP) Expert Panel on Detection, Evaluation, And Treatment of High Blood Cholesterol In Adults (Adult Treatment Panel III). JAMA. 2001;285(19):2486-97.
14. The sixth report of the Joint National Committee on prevention, detection, evaluation, and treatment of high blood pressure. Arch Intern Med. 1997;157(21):2413-46.
15. Sociedade Brasileira de Hipertensão. IV Diretrizes BrasileirasIV Diretrizes Brasileiras de Hipertensão Arterial. Available from: http://www.sbh.org. br/hipertensao/2002_N4_V5/N%2004%20V5%202002%20- %20completa%20-%20revista%20hipertensao%20-%20www-sbh-org-br.pdf. Accessed in 2007 (May 22).
16. Friedewald WT, Levy RI, Fredrickson DS. Estimation of theEstimation of the concentration of low-density lipoprotein cholesterol in plasma, without use of the preparative ultracentrifuge. Clin Chem. 1972;18(6):499-502.
17. Instituto Brasileiro de Geografia e Estatística. Censo demográfico 2000. [CD-Room]. Brasília: IBGE; 2001.
18. Dallongeville J, Cottel D, Arveiler D, et al. The association ofThe association of metabolic disorders with the metabolic syndrome is different in men and women. Ann Nutr Metab. 2004;48(1):43-50. 19. Alvarez León EE, Ribas Barba L, Serra Majem L. Prevalencia del
síndrome metabólico en la población de la Comunidad Canaria. [Prevalence of the metabolic syndrome in the population of Canary Islands, Spain]. Med Clin (Barc). 2003;120(5):172-4. 20. Martins IS, Coelho LT, Casajus MI, Okani ET. Smoking,
consumption of alcohol and sedentary life style in population grouping and their relationships with lipemic disorders. Rev Saude Publica. 1995;29(1):38-45.
21. Lessa I, Conceição JL, Souza ML, et al. Prevalência de dislipi-demias em adultos da demanda laboratorial de Salvador, Brasil. [Prevalence of dyslipidemias in adults in laboratory tests from Salvador, Brazil]. Arq Bras Cardiol. 1997;69(6):395-400.Arq Bras Cardiol. 1997;69(6):395-400. 22. Lerario DD, Gimeno SG, Franco LJ, Iunes M, Ferreira SR.
Excesso de peso e gordura abdominal para a síndrome metabólica em nipo-brasileiros. [Weight excess and abdominal fat in the[Weight excess and abdominal fat in the metabolic syndrome among Japanese-Brazilians]. Rev Saude Publica. 2002;36(1):4-11.
23. Kim ES, Han SM, Kim YI, et al. Prevalence and clinical charac-Prevalence and clinical charac-teristics of metabolic syndrome in a rural population of South Korea. Diabet Med. 2004;21(10):1141-3.
24. Maison P, Byrne CD, Hales CN, Day NE, Wareham NJ. Do different dimensions of the metabolic syndrome change together over time? Evidence supporting obesity as the central feature. Diabetes Care. 2001;24(10):1758-63.
25. Alberti KG, Zimmet PZ. Definition, diagnosis and classification of diabetes mellitus and its complications. Part 1: diagnosis and classification of diabetes mellitus provisional report of a WHO consultation. Diabet Med. 1998;15(7):539-53.
26. Ford ES, Giles WH, Dietz WH. Prevalence of the meta-Prevalence of the meta-bolic syndrome among US adults: findings from the third National Health and Nutrition Examination Survey. JAMA. 2002;287(3):356-9.
27. Laaksonen DE, Lakka HM, Niskanen LK, Kaplan GA, Salonen JT, Lakka TA. Metabolic syndrome and development of diabetesMetabolic syndrome and development of diabetes mellitus: application and validation of recently suggested defini-tions of the metabolic syndrome in a prospective cohort study. Am J Epidemiol. 2002;156(11):1070-7.
28. Gu D, Reynolds K, Wu X, et al. Prevalence of the metabolicPrevalence of the metabolic syndrome and overweight among adults in China. Lancet. 2005;365(9468):1398-405.
29. Aguilar-Salinas CA, Rojas R, Gomez-Perez FJ, et al. High prevalence of metabolic syndrome in Mexico. Arch Med Res. 2004;35(1):76-81.
30. Steinbaum SR. The metabolic syndrome: an emerging health epidemic in women. Prog Cardiovasc Dis. 2004;46(4):321-36.
Sources of funding: This study received financial support through a Fogarty International Center Training Grant (No. 1D43TW006580), and from Fundação de Amparo a Pesquisa do Estado de Minas Gerais (FAPEMIG: CDS 530/04) and the National Institutes of Health (NIH-ICIDR Grant A145451).
Conflict of interest:Not declared
Date of first submission:May 8, 2006
Last received:May 22, 2007
Accepted:May 23, 2007
AUTHOR INFORMATION
Gustavo Velásquez-Meléndez, PhD. Department of Maternal and Child Nursing and Public Health, School of Nursing, Universidade Federal de Minas Gerais (UFMG), Belo Horizonte, Minas Gerais, Brazil.
Andrea Gazzinelli, PhD.Department of Maternal and Child Nursing and Public Health, School of Nursing, Universidade Federal de Minas Gerais (UFMG), Belo Horizonte, Minas Gerais, Brazil.
Rodrigo Côrrea-Oliveira, PhD.Laboratory of Immunology, René Rachou Research Center, Fundação Instituto Oswaldo Cruz (Fiocruz), Belo Horizonte, Minas Gerais, Brazil.
Adriano Marçal Pimenta, MSc.Department of Maternal and Child Nursing and Public Health, School of Nursing, Universidade Federal de Minas Gerais (UFMG), Belo Horizonte, MG, Brazil.
Gilberto Kac, PhD.Department of Social and Applied Nutri-tion, Institute of NutriNutri-tion, Universidade Federal do Rio de Janeiro (UFRJ), Rio de Janeiro, Brazil.
Address for correspondence:
Gustavo Velásquez-Meléndez
Universidade Federal de Minas Gerais, Escola de Enfermagem
Avenida Alfredo Balena, 190
Belo Horizonte (MG) — Brasil — CEP 30130-100 Tel. (+55 31) 3248-9868 — Fax. (+55 31) 3248-9859 E-mail: [email protected]
Copyright © 2007, Associação Paulista de Medicina
RESUMO
Prevalência da síndrome metabólica em área rural do Brasil
OBJETIVO E CONTEXTO: A síndrome metabólica (SM) é reconhecida mundialmente como importante problema de saúde pública e tem apresentado prevalência crescente. Entretanto, existe pouca informação sobre prevalência da SM em populações rurais brasileiras. Este estudo objetivou determinar a prevalência e os fatores associados a SM em uma comunidade rural do Brasil, em 2004.
TIPO DE ESTUDO E LOCAL: Estudo transversal de base populacional, conduzido em Virgem das Graças, comunidade rural localizada no Vale do Jequitinhonha, Estado de Minas Gerais, Brasil, 2004.
MÉTODOS:SM foi definida pelo critério do National Cholesterol Education Program Adult Treatment Panel (NCEP/ATP III) como a co-ocorrência de pelo menos três dos seguintes fatores: hipertensão arterial, altos níveis séricos de glicose ou triglicérides, baixos níveis da lipoproteína de alta densidade, e obesidade abdominal. A prevalência de SM foi calculada segundo variáveis socioeconômicas e demográficas em 251 pessoas (117 homens, 134 mulheres) com idades entre 20-88 anos. Utilizou-se regressão logística para estimar odds ratio (OR) e seus intervalos de confiança de 95%.
RESULTADOS: Prevalência da SM foi 21,6% (7,7% para os homens e 33,6% para as mulheres). A pre-valência global ajustada por idade foi 19,0%. Prepre-valências altas foram encontradas em mulheres > 60 anos (52,9 %) e em mulheres com Índice de Massa Corporal (IMC) ≥ 25 (64%). A análise ajustada por hábito de fumar, status marital, cor de pele e escolaridade revelou que o sobrepeso e sexo feminino e a idade como principais fatores de risco relacionado à SM.
CONCLUSÕES: A síndrome metabólica representa um potencial problema de saúde pública particularmente em mulheres e indivíduos com sobrepeso na área rural estudada. O sobrepeso, a idade acima de 60 anos e o sexo feminino foram considerados fatores independendentes associados a essa condição.