Glucokinase gene promoter -30G>A
polymorphism: a cross-sectional association
study with obesity, diabetes
Mellitus
,
hyperlipidemia, hypertension and
metabolic syndrome in an Iranian hospital
Polimorfismo -30G<A no gene promotor da glucoquinase
:
um estudo transversal de associação do mesmo com a
diabetes
Mellitus
, hiperlipidemia, hipertensão arterial e
síndrome metabólica em um hospital iraniano
Mohammad Reza OLADI1 Javad BEHRAVAN2 Mitra HASSANI2 Jamal KASSAEIAN2 Amirhossein SAHEBKAR1,2,3 Shima TAVALLAIE3 Roghayeh PAYDAR3 Hamidreza SABER3 Habib Allah ESMAEILI4 Mohsen AZIMI-NEZHAD1,3 Gordon FERNS5
Majid GHAYOUR-MOBARHAN3
A B S T R A C T
Objective
A -30G>A single nucleotide polymorphism in the promoter region of the glucokinase gene has been previously associated with obesity, insulin resistance and diabetes. The present study aimed to evaluate the association of this polymorphism with obesity and its comorbidities in a population from Northeast Iran.
1
Mashhad University of Medical Sciences, Cardiovascular Research Center. Mashhad, Iran.
2
Mashhad University of Medical Sciences, Biotechnology Research Center. Mashhad, Iran
3
Mashhad University of Medical Sciences, Biochemistry of Nutrition Research Center, Faculty of Medicine. P.O.Box: 91375-3316, Mashhad, Iran. Correspondence to/Correspondência para: M GHAYOUR-MOBARHAN. E-mail: <[email protected]>.
4
Mashhad University of Medical Sciences, Faculty of Medicine, Departament of Community Medicine and Public Health. Mashhad, Iran.
5
Methods
Five hundred and forty-two subjects aged 18 to 65 years were included in the study and divided into normal (BMI<25, n=220), overweight (25<BMI<30, n=135) and obese (BMI>30, n=187) groups. All subjects were genotyped for the -30G>A polymorphism using the polymerase chain reaction-restriction fragment length polymorphism technique.
Results
The genotypes and allele frequencies of the three groups did not differ significantly (p>0.05). When the study population was categorized according to diabetes mellitus, hyperlipidemia, hypertension and metabolic syndrome status, no significant difference in -30G>A genotypes and alleles was found between the subgroups with and without these disorders (p>0.05), apart from a significantly higher frequency of the G allele in the hyperlipidemic vs. non-hyperlipidemic subgroup (p<0.05).
Conclusion
The findings of the present study do not support an association between the -30G>A polymorphism and high body mass index in the Iranian population.
Indexing terms: Body mass index. Glucokinase. Metabolic syndrome. Obesity. Single nucleotide polymorphism.
R E S U M O
Objetivo
O polimorfismo de nucleotídeo único -30G>A, na região promotora do gene da glucoquinase, já foi associado à obesidade, resistência insulínica e diabete. O objetivo deste estudo foi avaliar a associação deste polimorfismo com a obesidade e suas comorbidades em uma população do nordeste iraniano.
Métodos
Quinhentos e quarenta e dois indivíduos com idades entre 18 e 65 anos foram divididos em três grupos: normal (BMI<25, n=220), sobrepeso (25<BMI<30, n=135) e obeso (BMI>30, n=187). Todos os indivíduos foram genotipados para o polimorfismo 30G>A através da técnica da reação em cadeia da polimerase -polimorfismo do comprimento do fragmento de restrição.
Resultados
As frequências dos genótipos e alelos dos 3 grupos não diferiram entre si (p>0,05). Quando a população de estudo foi categorizada de acordo com a presença de diabete, hiperlipidemia, hipertensão arterial e síndrome metabólica, os genótipos e alelos -30G>A dos subgrupos com e sem essas doenças não diferiram entre si (p>0,05), exceto por uma frequência maior do alelo G no grupo de hiperlipidêmicos quando comparados aos não hiperlipidêmicos (p<0,05).
Conclusão
Os achados do presente estudo não confirmam uma associação entre o polimorfismo -30G>A e excesso de peso na população iraniana.
Termos de indexação: Índice de massa corporal. Glucoquinase. Síndrome metabólica. Obesidade. Polimorfismo de nucleotídeo único.
I N T R O D U C T I O N
Obesity is a major risk factor for some diseases such as atherosclerosis, diabetes, cardiovascular disease and cancer. Several factors have been identified as determinants of obesity, including life style, socioeconomic status and food
intake1,2. Genetic factors may also play an
important role in the pathophysiology of obesity3,4.
In addition, the potential role of hormonal factors, like leptin and adiponectin, has been determined
by different studies5,6. Glucokinase (EC 2.7.1.1)
gene mutations are the first recognized disorders of glucose metabolism. Glucokinase is expressed
in pancreatic cells and hepatocytes. Its expression
is controlled by tissue-specific promoters. This enzyme acts as a glucose sensor in pancreatic
also implicated in neuroendocrine glucose sensing and regulation of hormone secretion and appetite, both being important contributors to the
pathogenesis of obesity8-10. Genetic studies have
shown that mutations in this gene are responsible
for glucose metabolism disorders11. A -30G>A
Single Nucleotide Polymorphism (SNP) in the promoter region of the glucokinase gene (rs1799884) has been associated with obesity,
insulin resistance and diabetes. Yamada et al.
found that the glucokinase gene -30G>A polymorphism in individuals with BMI>25 was
significantly and inversely related to obesity12. In
another study, Marz et al. found an association
of the -30G>A polymorphism with type 2
diabetes13. Chiu et al.14 found an association
between this polymorphism and insulin resistance in the Asian Indian population. In another study
with a general Caucasian population, Rose et al.15
found an association of this polymorphism with hyperglycemia. The associations between glucokinase gene polymorphisms and obesity have been hypothesized to be due to linkage disequilibrium
with obesity-regulating genes10. However, there
has been no report of this polymorphism in the Iranian population. Therefore, the present study aimed to investigate a possible association between the -30G>A SNP and obesity and its
comorbidities, including diabetes Mellitus,
hyperlipidemia, hypertension and the metabolic syndrome, in a Northeast-Iranian population.
M E T H O D S
Study design and participants
This study included 542 subjects aged 18 to 65 years, recruited at the Nutrition Clinic of the Ghaem Hospital (Mashhad, Iran). Anthropometric parameters including weight, height, Body Mass Index (BMI) (obtained by dividing the weight in kilograms by the square of the height in meters), waist circumference, hip circumference and waist-to-hip ratio, and systolic and diastolic blood pressures were measured in all participants. The study population was divided into three groups
for investigating the association between the -30G>A polymorphism and obesity: normal (BMI<25, n=220), overweight (25<BMI<30, n=135) and obese (BMI>30, n=187). Secondly, the genotype and allele frequencies of the -30G>A polymorphism were compared between subgroups of patients with and without the metabolic syndrome (defined according to the International
Diabetes Federation, IDF, criteria), diabetes Mellitus,
hypertension and hyperlipidemia.
This project was approved by the Ethics Committee of Mashhad University of Medical Sciences (MUMS) under protocol number 87478. All participants signed a free and informed consent form.
Routine biochemical analysis
A full fasting lipid profile was performed for each subject. Serum lipid and Fasting Blood Glucose (FBG) concentrations were measured by enzymatic methods using commercial kits (Pars Azmoon Co. (for FBS and High Density Lipoprotein -cholesterol [HDL-c] assays; Pishtaz Teb Co. (for Low Density Lipoprotein-cholesterol [LDL-c] assay; and Biosystems Co. (for total cholesterol and triglycerides assays). Serum High-Sensitivity C-Reactive Protein (hs-CRP) was measured by the Polyethylene Glycol (PEG) enhanced
immunoturbidimetry method16,17.
Glucokinase G(-30)A genotype
Genomic Deoxyribonucleic Acid (DNA) was isolated from blood by the salting-out method
described elsewhere18. The -30G>A polymorphism
was assessed by the polymerase chain Reaction-Restriction Fragment Length Polymorphism (RFLP-PCR) technique. The primers used for amplification were 5´-GGGGGTTAGGGATGTGAGAT-3´ as forward and 5´-TGTGGGGCTTAGTGTCCTTC-3´ as reverse. The amplification products were
digested by MwoI (Fermentas) and analyzed by
polyacrylamide gel electrophoresis.
G allele yielded 169, 176, 149 and 48 base pairs (bp) and A allele 224, 169 and 149 bp. The molecular weight of the fragments and G and A alleles were determined by molecular weight markers.
Statistical treatment
All statistical analyses were done by the software Statistical Package for the Social Sciences (SPSS) for Windows™, version 11.5 (SPSS Inc., Chicago, Illinois, USA). Data were expressed as Means (M) Standard Deviation (SD). The statistical differences in genotype and allele frequencies among the different Body Mass Index (BMI) groups (BMI<25, 25<BMI<30 and BMI>30) and Diabetes Mellitus (DM), Hypertension (HTN) and Hyperlipidemia (HLP) subgroups were assessed by
the 2 test. Other contributing variables were
compared by one-way Analysis of Variance (ANOVA) or the Kruskall-Wallis test. Binary logistic regression analysis was also performed to assess a possible association between the study polymorphism and obesity using dominant, codominant and recessive models. Compliance of genotypes with the Hardy-Weinberg equilibrium
in each group was assessed by the 2 test with
one degree of freedom. A two-sided p-value<0.05
was considered statistically significant.
R E S U L T S
Study participants
Two hundred and eighty-six females and 256 males, aged 18 to 65 years, were divided into 3 groups based on their BMI. The first group (BMI<25) consisted of 111 females and 109 males with a mean BMI of M=22.30, SD=1.95. In the second group (25<BMI<30), there were 77 females and 58 males with a mean BMI of M=27.78, SD=1.37. Finally, in the third group (BMI>30), there were 98 males and 89 females with a mean BMI of M=35.05, SD=4.64.
There were significantly higher rates of
diabetes Mellitus in the overweight and obese
groups compared with the normal weight group. However, the prevalences of hypertension and hyperlipidemia did not differ among the three
groups (p>0.05). The three groups did not differ
with respect to gender distribution but the normal BMI group was significantly older than the
overweight and obese groups (p<0.05). The rates
of current or past smoking habit were highest in the obese and lowest in the normal BMI group
(p<0.001). There was no significant difference
among the three groups regarding waist-to-hip ratio and systolic and diastolic blood pressure, apart from significantly higher diastolic blood pressure in the obese vs. normal BMI group
(p<0.01). With regard to lipid profile, the
overweight and obese groups had significantly lower serum levels of HDL-c and higher triglyceride levels than the normal BMI group, while there was no significant difference in total cholesterol and
LDL-c (p>0.05). Serum hs-CRP levels were
significantly different among the three groups, with them being highest in the normal and lowest in the overweight group. Finally, the obese group had significantly higher FBG than the overweight
(p=0.001) and normal (p=0.001) groups (Table1).
-30G>A polymorphism and obesity
The frequency of the AA, GA and GG genotypes were 25.9%, 2.7% and 71.4% in the normal group, 22.2%, 6.7% and 71.1% in the overweight group, and 21.9%, 9.1% and 69.0% in the obese group, respectively. A significant deviation of genotype distribution from the Hardy-Weinberg equilibrium was observed in all three
groups (p<0.001). No significant difference was
observed between the three groups, neither in
genotype nor in allele frequencies (p>0.05,
Table 2).
In the binary logistic regression analysis, there was no significant association between the -30G>A polymorphism and obesity in any of the
dominant (GG vs GA + AA), codominant (additive)
Table 1. Clinical and biochemical characteristics of different body mass index groups.
N
Gender (F/M) Age (years) Weight (kg) BMI (kg/m2)
Waist (cm) Hip (cm) Waist / Hip Smoker (%) FBS (mg/dL) TC (mg/dL) LDL-c (mg/dL) HDL-c (mg/dL) TG (mg/dL) Hs-CRP (mg/L) SBP (mmHg) DBP (mmHg) DM HTN HLP 220 111/109 M=46.05, SD=9.85 M=61.11, SD=11.18 M=22.30, SD=1.95 M=84.52, SD=8.99 M=95.37, SD=6.52 M=0.887, SD=0.080 8 (3.7%) M=80.81, SD=15.40 M=178.13, SD=37.76 M=112.89, SD=32.01 M=45.98, SD=11.24 100 (27-379) 4.5 (0.26-171) M=115.22, SD=16.41 M=74.77, SD=10.29 2 (0.9%) 14 (6.5%) 10 (4.6%) BMI <25 135 77/58 M=39.78, SD=11.27 M=75.64, SD=14.53 M=27.78, SD=1.37 M=94.98, SD=9.02 M=105.37, SD=5.43 M=0.901, SD=0.082 20 (14.9%) M=90.89, SD=28.40 M=179.74, SD=38.10 M=112.57, SD=30.10 M=42.01, SD=9.41 124 (22-354) 2.8 (0.20-22) M=114.43, SD=17.14 M=77.06, SD=10.75 8 (6.1%) 6 (7.8%) 13 (8.4%) 25 <BMI <30
187 98/89 M=38.44, SD=10.33 M=92.27, SD=17.45 M=35.05, SD=4.64 M=107.11, SD=12.36 M=118.68, SD=10.50 M=0.905, SD=0.084 41 (22.0%) M=87.18, SD=24.21 M=175.90, SD=40.46 M=110.14, SD=33.42 M=40.09, SD=9.71 130 (40-340) 4.0 (0.21-49.56) M=113.78, SD=14.96 M=78.69, SD=9.58 5 (2.8%) 4 (4.0%) 15 (8.4%) BMI >30 <0.228 <0.001 <0.001 <0.001 <0.001 <0.001 <0.304 <0.001 <0.001 <0.925 <0.996 <0.002 <0.001 <0.014 <0.928 <0.211 <0.007 <0.710 <0.050 <0.695 <0.001 <0.001 <0.001 <0.001 <0.001 <0.080 <0.001 <0.014 <0.837 <0.677 <0.001 <0.001 <0.001 <0.744 <0.005 <0.149 <0.367 <0.115 <0.410 <0.486 <0.001 <0.001 <0.001 <0.001 <0.903 <0.001 <0.318 <0.666 <0.791 <0.238 <0.083 <0.007 <0.926 <0.546 <0.160 <0.279 <0.651 p-value
a b c
Values are expressed as Mean (M), Standard Desviation (SD) or median and interquartile range. Comparisons were made by the 2 test, one-way ANOVA and Kruskal-Wallis test. BMI: Body Mass Index; TC: Total Cholesterol; TG: Triglycerides; HDL-c: High-Density Lipoprotein cholesterol; LDL-c: Low-Density Lipoprotein cholesterol; FBS: Fasting Blood Sugar; SBP: Systolic Blood Pressure; DBP: Diastolic Blood Pressure; Hs-CRP: High-Sensitivity C-Reactive Protein; DM: Diabetes Mellitus; HTN: Hypertension; HLP: Hyperlipidemia; a: Comparison Between BMI <25 vs 25<BMI <30; b: Comparison Between BMI <25 vs BMI>30; c: Comparison Between 25 <BMI<30 vs BMI>30.
-30G>A polymorphism and diabetes
Mellitus, hypertension, hyperlipidemia and metabolic syndrome
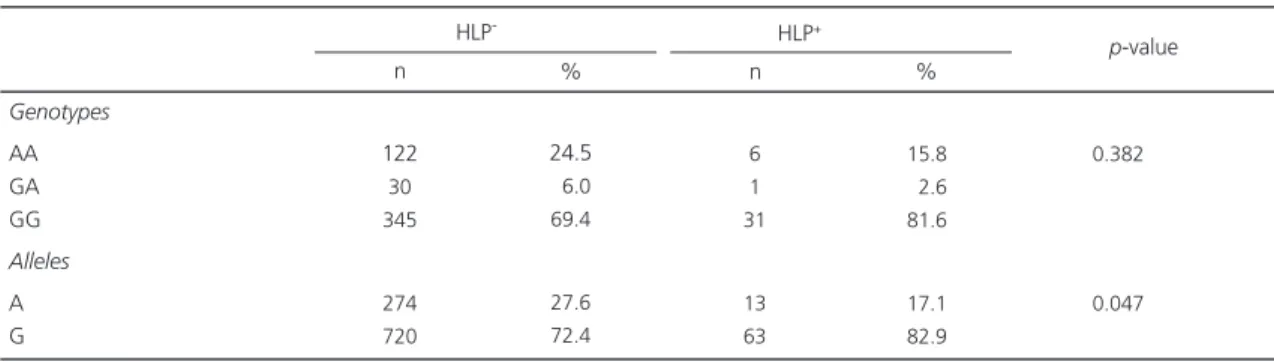
Overall, there was no significant difference in genotype and allele frequencies between the subgroups of patients having or not hyperlipidemia
(Table 3), diabetes Mellitus (Table 4), hypertension
and metabolic syndrome defined according to
the IDF criteria (Table 5), (p>0.05). The only
exception was a significantly higher frequency of the G allele in the hyperlipidemic subgroup (p<0.05).
Genotypes AA GG GA Alleles A G 57 157 6 120 320 30 96 9 69 201 41 129 17 99 275 0.091 <0.88
BMI: Body Mass Index.
Table 2. Genotype and allele frequencies of -30G>A polymorphism in different body mass index groups.
BMI<25 25<BMI<30 BMI>30
p-value
n % n % n %
D I S C U S S I O N
To our knowledge, there have not been any other study on the association between the -30G>A polymorphism and obesity in the Iranian population. The results of the present study contrast the previous reports. An earlier survey
by Yamada et al.19 and colleagues on 147
polymorphisms of 124 candidate genes for obesity in 3,906 Japanese found nine polymorphisms, and the -30G>A polymorphism was found to be
inversely associated with obesity19. In another
study with southern Spaniards, the researchers found an almost similar association and reported
Genotypes AA GA GG Alleles A G 122 30 345 274 720 6 1 31 13 63 0.382 0.047
Values are expressed as number (%). HLP: Hyperlipidemia.
Table 3. Genotype and allele frequencies of -30G>A polymorphism between hyperlipidemic and non-hyperlipidemic subjects.
HLP- HLP+
p-value n % 24.5 06.0 69.4 27.6 72.4 n % 15.8 02.6 81.6 17.1 82.9
Table 4. Genotype and allele frequencies of -30G>A polymorphism in diabetic and non-Diabetic subjects.
Genotypes AA GA GG Alleles A G 122 30 364 274 758 5 1 11 11 23
DM- DM+
0.753
0.452 p-value
DM: Diabetes Mellitus.
n % n %
23.6 05.8 70.5 26.6 73.4 29.4 05.9 64.7 32.4 67.6
Table 5. Genotype and allele frequencies of -30G>A polymorphism in hypertensive and non-hypertensive subjects.
Genotypes AA GA GG Alleles A G
Values are expressed as number (%). MS: Metabolic Syndrome; HTN: Hypertension. 99 17 261 215 539 16.7 0 83.3 16.7 83.3
HTN- HTN+
0.399 0.076 p-value n % 26.3 04.5 261 215 539 n % 4 0 20 8 40 Hypertenson 91 24 260 206 544 23.5 04.3 72.2 25.6 74.4
MS- MS+
that -30G>A allele carriers have lower risk of
obesity and lose weight more easily10. These
associations may be partly due to the impact of this polymorphism on insulin sensitivity, as an association with high insulin resistance has been
reported for the -30G>A allele15. However, this is
not a universal finding since Elbein et al found no
significant influence of this polymorphism on the
insulin sensitivity index20. In the present study on
Iranian subjects, an association between this polymorphism and BMI was not found. Likewise, in another study on British Caucasians, fetal genotypes of this polymorphism were not found to be significantly related to the child’s birth weight, but a significant association between
maternal A allele and birth weight was reported21.
In a study by Tam et al.22 on healthy Chinese adults
and adolescents, no significant association was
found between the -30G>A SNP and BMI22. In
another comprehensive study on a large population of middle-aged Danish Caucasian subjects, no significant association was found between this SNP and anthropometric indices, including BMI, waist circumference and waist-to-hip ratio. However, when the population of the latter study was grouped according to the presence of metabolic syndrome components, a significant association was found between the -30G>A allele
and obesity indices15.
The lack of association between the -30G>A
variant and diabetes Mellitus in the current study
confirms most of the previous studies in this
regard12,23-26. On the other hand, Marz et al.13
reported a significant association of the -30G>A SNP with high risk of type 2 diabetes in patients with Coronary Artery Disease (CAD), but not in controls. With regard to diabetes-related traits, there are also some previous reports indicating an association between this polymorphism and
Fasting Plasma Glucose (FPG)21,27 or low cell
function (mainly in Japanese subjects)12,27-29.
However, these findings are challenged by those
of other studies12,24,30-32 and so are not consistent.
Furthermore, previous studies have failed to find
any significant effect of this polymorphism on
insulin secretion20,24. Nevertheless, Rose et al.15
found that the -30G>A allele is associated with high FPG and Post-Oral Glucose Tolerance Test (OGTT) glycemia, as well as impaired glucose regulation and other features of WHO-defined
metabolic syndrome15.
As for hyperlipidemia, a significantly higher frequency of the G allele was found in the hyperlipidemic group. Such an effect could be secondary to the possible modulatory impact of this SNP on insulin resistance. There is a pile of evidence on the close nexus between insulin resistance and dyslipidemia. The suggested mechanisms include high hepatic triglyceride production, high secretion of Very Low-Density Lipoprotein (VLDL) and low lipoprotein lipase
activity33,34. However, the genotypes did not differ
between the hyperlipidemic and non-hyperlipidemic groups. Given the close relationship between lipid and glucose metabolism, the absence of genotype differences between the subgroups with and without hyperlipidemia could support some previous studies that found no significant effect on diabetes-related factors, such as FPG, glucose effectiveness, insulin sensitivity and secretion. Additionally, this SNP was not found to be significantly
related to serum lipids or dyslipidemia15.
Yamada et al.35 in a population-based
study comprised of 4,853 unrelated Japanese, found that the -30G>A polymorphism was significantly associated with hypertension. They also reported that this polymorphism was significantly related to the systolic and diastolic blood pressures of men and women. They suggested that Genetic Polymorphisms in Glucokinase (GCK) is the susceptibility locus for hypertension in
Japanese individuals35. In a 6-year
population-based longitudinal cohort study on 2233 subjects, the -30G>A SNP was associated with hypertension
in women36. However, this relationship was not
found in the present-study population. As mentioned earlier, the failure of the present study to find a significant association between the study
hypertension and metabolic syndrome could be justified by the small number of subjects with these conditions.
In summary, the findings of the present study do not support an association between the -30G>A SNP and high BMI in Iranian subjects. However, future prospective studies would be helpful to confirm this finding.
A C K N O W L E D G M E N T S
The authors gratefully acknowledge the kind assistance and financial support provided by the Vice Chancellor for Research at the Mashhad University of Medical Sciences.
R E F E R E N C E S
1. Sobal J, Stunkard AJ. Socioeconomic status and obesity: a review of the literature. Psychol Bull. 1989; 105(2):260-75.
2. Lau DC, Douketis JD, Morrison KM, Hramiak IM, Sharma AM, Ur E. Obesity Canada clinical practice guidelines expert panel. 2006 Canadian clinical practice guidelines on the management and prevention of obesity in adults and children [summary]. CMAJ. 2007; 176(8):S1-13.
3. Comuzzie AG, Allison DB. The search for human obesity genes. Science. 1998; 280(5386):1374-7. 4. Rankinen T, Pérusse L, Weisnagel SJ, Snyder EE, Chagnon YC, Bouchard C. The human obesity gene map: the 2001 update. Obes Res. 2002; 10(3): 196-243.
5. Luis DA, Perez Castrillón JL, Dueñas A. Leptin and obesity. Minerva Med. 2009; 100(3):229-36.
6. Kawano J, Arora R. The role of adiponectin in obesity, diabetes, and cardiovascular disease. J Cardiometab Syndrome. 2009; 4(1):44-9. 7. Matschinsky F, Liang Y, Kesavan P, Wang L, Froguel
P, Velho G, et al. Glucokinase as pancreatic beta cell glucose sensor and diabetes gene. J Clin Invest. 1993; 92(5):2092-8.
8. Zelent D, Golson ML, Koeberlein B, Quintens R, van Lommel L, Buettger C, et al. A glucose sensor role for glucokinase in anterior pituitary cells. Diabetes. 2006; 55(7):1923-9.
9. Yang X, Mastaitis J, Mizuno T, Mobbs CV. Glucokinase regulates reproductive function, glucocorticoid
secretion, food intake, and hypothalamic gene expression. Endocrinology. 2007; 148(4):1928-32. 10. Gómez-Zumaquero JM, Rojo-Martínez G, García-Escobar E, Martín-Nuñez GM, Haro J, Esteva I, et al. The -30G>A polymorphism of the glucokinase gene promoter is associated with obesity in a population from Southern Spain. Obesity. 2008; 16(8):1973-5.
11. Froguel P, Vaxillaire M, Sun F, Velho G, Zouali H, Butel MO, et al. Close linkage of glucokinase locus on chromosome 7p to early-onset non-insulin-dependent diabetes Mellitus. Nature. 1992; 356(6365):162-4.
12. Yamada K, Yuan X, Ishiyama S, Ichikawa F, Koyama KI, Koyanagi A, et al. Clinical characteristics of Japanese men with glucokinase gene -cell promoter variant. Diabetes Care. 1997; 20(7): 1159-61.
13. März W, Nauck M, Hoffmann MM, Nagel D, Boehm BO, Koenig W, et al. G(-30)A polymorphism in the pancreatic promoter of the glucokinase gene associated with angiographic coronary artery disease and type 2 diabetes Mellitus. Circulation. 2004; 109(23):2844-9.
14. Chiu KC, Chuang LM, Yoon C, Saad MF. Hepatic glucokinase promoter polymorphism is associated with hepatic insulin resistance in Asian Indians. BMC Genet. 2000; 1:2.
15. Rose CS, Ek J, Urhammer SA, Glumer C, Borch-Johnsen K, Jorgensen T, et al. A -30G>A polymorphism of the beta-cell-specific glucokinase promoter associates with hyperglycemia in the general population of whites. Diabetes. 2005; 54(10):3026-31.
16. Price CP, Trull AK, Berry D, Gorman EG. Development and validation of a particle-enhanced turbidimetric immunoassay for C-reactive protein. J Immunol Methods. 1987; 99(2):205-11.
17. Eda S, Kaufmann J, Roos W, Pohl S. Development of a new microparticle-enhanced turbidimetric immunoassay for C-reactive protein with superior features in sensitivity and dynamic range. J Clin Lab Anal. 1998; 12(3):137-44.
18. Tatari F, Salek R, Mosaffa F, Behravan J. Association of C3435T single nucleotide polymorphism of MDR1 gene with breast cancer in an Iranian population. DNA Cell Biol. 2009; 28(5):259-63. 19. Yamada Y, Kato K, Kameyama T, Yokoi K, Matsuo
H, Segawa T, et al. Genetic factors for obesity. Int J Mol Med. 2006; 18(5):843-51.
nuclear factor 1alpha genes. Diabetes Care. 2001; 24(3):472-8.
21. Weedon MN, Frayling TM, Shields B, Knight B, Turner T, Metcalf BS, et al. Genetic regulation of birth weight and fasting glucose by a common polymorphism in the islet cell promoter of the glucokinase gene. Diabetes. 2005; 54(2):576-81.
22. Tam CH, Ma RC, So WY, Wang Y, Lam VK, Germer S, et al. Interaction effect of genetic polymorphisms in glucokinase (GCK) and glucokinase regulatory protein (GCKR) on metabolic traits in healthy Chinese adults and adolescents. Diabetes. 2009; 58(3):765-9.
23. Lotfi K, Sund G, Lowe R, Graham J, Landin-Olsson M, Kockum I, et al. The beta cell glucokinase promoter variant is an unlikely risk factor for diabetes mellitus: Diabetes Incidence Study in Sweden (DISS). Diabetologia. 1997; 40(8):959-62. 24. Rissanen J, Saarinen L, Heikkinen S, Kekalainen P, Mykkanen L, Kuusisto J, et al. Glucokinase gene islet promoter region variant (G3A) at nucleotide-30 is not associated with reduced insulin secretion in Finns. Diabetes Care. 1998; 21(7):1194-7. 25. Shimokawa K, Sakura H, Otabe S, Eto K, Kadowaki
H, Hagura R, et al. Analysis of the glucokinase gene promoter in Japanese subjects with noninsulin-dependent diabetes mellitus. J Clin Endocrinol Metab. 1994; 79(3):883-6.
26. Ezzidi I, Mtiraoui N, Cauchi S, Vaillant E, Dechaume A, Chaieb M, et al. Contribution of type 2 diabetes associated loci in the arabic population from tunisia: a case-control study. BMC Med Genet. 2009; 10: 33.
27. Stone LM, Kahn SE, Fujimoto WY, Deeb SS, Porte D Jr. A variation at position -30 of the beta-cell glucokinase gene promoter is associated with reduced beta-cell function in middle-aged Japanese-American men. Diabetes. 1996; 45(4): 422-8.
28. Qi Q, Wu Y, Li H, Loos RJF, Hu FB, Sun L, et al.
Association of GCKR rs780094, alone or in combination with GCK rs1799884, with type 2
diabetes and related traits in a han Chinese population. Diabetologia. 2009; 52(5):834-43. 29. Matsutani A, Noda K, Tao T, Tanizawa Y, Kaneko T,
Kaku K, et al. Variation of promoter activity of glucokinase gene in humans. Diabetes. 1993; 42:94A.
30. Zaidi FK, Wareham NJ, McCarthy MI, Holdstock J, Kalloo-Hosein H, Krook A, et al. Homozygosity for a common polymorphism in the islet-specific promoter of the glucokinase gene is associated with a reduced early insulin response to oral glucose in pregnant women. Diabet Med. 1997; 14(3): 228-34.
31. Urhammer SA, Hansen T, Clausen JO, Eiberg H, Pedersen O. The G/A nucleotide variant at position -30 in the beta-cell-specific glucokinase gene promoter has no impact on the beta-cell function in Danish Caucasians. Diabetes. 1998; 47(8): 1359-61.
32. Li X, Shu YH, Xiang AH, Trigo E, Kuusisto J, Hartiala J, et al. Additive effects of genetic variation in GCK and G6PC2 on insulin secretion and fasting glucose. Diabetes. 2009; 58(12):2946-53. 33. Lewis GF, Uffelman KD, Szeto LW, Weller B, Steiner
G. Interaction between free fatty acids and insulin in the acute control of very low density lipoprotein production in humans. J Clin Invest. 1995; 95(1): 158-66.
34. Taskinen MR. Insulin resistance and lipoprotein metabolism. Curr Opin Lipodol. 1995; 6(3): 153-60.
35. Yamada Y, Matsuo H, Segawa T, Watanabe S, Kato K, Hibino T, et al. Assessment of the genetic component of hypertension. Am J Hypertens. 2006; 19(11):1158-65.
36. Yamada Y, Ando F, Shimokata H. Association of polymorphisms of SORBS1, GCK and WISP1 with hypertension in community-dwelling Japanese individuals. Hypertens Res. 2009; 32(5):325-31.