Original Article 1169
-CHILD GROWTH MONITORING IN FAMILY HEALTH BASIC UNITS IN
THE MUNICIPALITY OF QUEIMADAS, PARAÍBA, BRAZIL
Ana Carolina Dantas Rocha1, Dixis Figueroa Pedraza2
1 Master’s student of the Public Health of The State University of Paraiba. Paraíba, Brazil. E-mail: [email protected] 2 Ph.D. in Nutrition. Doctor professor at Departament of Nursing and Program of Postgraduate Diploma in Public Health of
State University of Paraíba. Paraíba, Brazil. E-mail: [email protected]
ABSTRACT: The aim of this cross-sectional study was to evaluate the monitoring of child growth in the context of primary health
care in Queimadas, Paraíba, Brazil, highlighting structural and process aspects. A questionnaire was submitted to 204 mothers. Health monitoring instruments of child health and 16 health units were analyzed. Regarding structure, the lack of a minimum number of staff as well as the lack of nursing training for child care was seen as major limitations. In regards to the process, the worst performance was for the records of weight and height in the last three months. For these, the best performance was observed in the urban area. As these duties were performed in disagreement with child health care policies, the results indicate the non-consolidation of effective monitoring of child growth.
DESCRIPTORS: Growth. Nutritional surveillance. Child health. Primary health care. Health services evaluation.
ACOMPANHAMENTO DO CRESCIMENTO INFANTIL EM UNIDADES
BÁSICAS DE SAÚDE DA FAMÍLIA DO MUNICÍPIO DE QUEIMADAS,
PARAÍBA, BRASIL
RESUMO: Estudo transversal que teve por objetivo avaliar as ações de acompanhamento do crescimento no contexto da atenção básica
à saúde, no município de Queimadas, Paraíba, Brasil destacando aspectos estruturais e processuais. Foi aplicado um questionário às 204 mães das crianças estudadas, bem como analisados os instrumentos destinados ao acompanhamento da saúde das crianças e as 16 unidades de saúde do município. Na estrutura, observaram-se a completitude da equipe mínima e a capacitação dos enfermeiros para o atendimento à criança como principais limitações. Quanto ao processo, o pior desempenho foi para os registros de peso e de estatura nos últimos três meses. Para o registro de peso nos últimos três meses, o melhor desempenho foi constatado na zona urbana. Em função de atos realizados em discordância com o que preconizam as políticas públicas de atenção à saúde da criança, os achados indicam a não consolidação efetiva da ação de acompanhamento do crescimento.
DESCRITORES: Crescimento. Vigilância nutricional. Saúde da criança. Atenção primária à saúde. Avaliação de serviços de saúde.
ACOMPAÑAMIENTO DEL CRECIMIENTO INFANTIL EN UNIDADES
BÁSICAS DE SALUD DE LA FAMILIA DEL MUNICIPIO DE QUEIMADAS,
PARAÍBA, BRASIL
RESUMEN: Estudio transversal que tuvo por objetivo evaluar las acciones de acompañamiento del crecimiento en el contexto de la
atención básica de salud del municipio de Queimadas, Paraíba, Brasil destacando aspectos estructurales y procesuales. Fue aplicado un cuestionario a las 204 madres de los niños estudiados, así como analizados los instrumentos destinados al acompañamiento de salud de los niños y las 16 unidades de salud del municipio. En la estructura se obeservó la completitud del equipo mínimo y la capacitación de los enfermeros para atender al niño fueron las principales limitaciones. Con relación al proceso, el peor desempeño fue para los registros de peso y de estatura en los últimos tres meses. El registro de peso en los últimos tres meses tuvo mejor desempeño en la zona urbana. En función de actos realizados en discordancia con lo que preconizan las políticas públicas de atención a la salud del niño, se constata la no consolidación efectiva del acompañamiento del crecimiento.
INTRODUCTION
Child growth is considered an important indicator in public health in order to monitor people’s health and nutrition, as it depends on environmental factors that affect the child’s living conditions in the past and in the present. Such environmental factors include: feeding, diseases, basic hygiene care, housing conditions and access to basic sanitation and health services.1
The basic action concerning monitoring of growth and development is the central pillar of child care, which allows to identify children who have a greater risk of morbimortality and promote adequate child growth.2 The effective growth monitoring requires good quality records and, in that sense, the Child’s Health Card is an essential resource, as it is the document in which all data and health events regarding the child are recorded.3
International organizations, such as World Health Organization, and Brazilian organizations, such as the Ministry of Health and the Brazilian So-ciety of Pediatrics, recommend the growth follow-up as a routine activity in child care.4 Nevertheless, the assimilation of this close watch is still causing confusion among health professionals and has not been performed correctly and systematically, even though it has been recommended in Brazil for nearly 30 years, after the implementation of the Comprehensive Child Health Care Program (PAISC).5-6
Differences in growth monitoring may be related to the geographical location of the health service, and this element can affect, among others, the structure, the work process and awareness on the importance of this procedure.5 Indicators of structure and work process are important com-ponents in quantity and quality measurements of health programs and services.7 On the other hand, children with nutritional risk need to be examined more frequently during growth monitoring in order to reach the objectives.2 In that sense, birth weight is an important element of the child’s sub-sequent growth.8
The objective of this study was to assess growth monitoring actions in the framework of basic health care in Queimadas, Paraíba, highlight-ing structural and procedural aspects, as well as differences between geographical areas and work process related to birth weight.
METHODOLOGY
This research is part of a cross-sectional study carried out in the municipality of Quei-madas, between July and August 2011, entitled “Situação alimentar, nutricional e atenção à saúde materno-infantil na cidade de Queimadas, Paraíba” (Nutritional status and mother-infant care in the city of Queimadas, Paraíba). This municipality is located in the metropolitan area of Campina Grande, in the rural area of the state of Paraíba. The municipality’s health system is made of 16 Basic Family Health Units (UBSF), a Psychosocial Care Center (CAPS), a Family Heath Support Center (NASF), a health center that provides dental ser-vices and biochemical/laboratory examinations; and a mixed health unit that provides support for the health service network.
All children born in 2009 and residing in Queimadas were considered eligible to the study. The 16 UBSFs that are part of the Uniied Health System (SUS), in the municipality were the setting for the study.
In order to quantify the total number of children born in 2009, the authors considered the live birth certiicates (DNVs) available at the City Health Department (n=407). The information was supplemented by an active search for births (n=43) with community health agents (ACSs) and nurses. Considering the address contained in the DNV, the mothers were mapped in every health unit, according to the coverage area of each unit. The identiication of mothers who were no longer residing in Queimadas (n=27) was checked by key informers (nurses, ACS and community leaders). Invitation letters were sent by ACSs to moth-ers eligible to the study (n=423), informing the date and time they should present themselves at the USBFs. The mothers were also asked to bring the Child’s Card/Child’s Health Card (CC/CSC). A new appointment was arranged in each UBSF with the mothers who did not attend the irst ap -pointment, and a phone call and/or a visit was made if they did not attend the second one. Moth-ers who could not be reached were considered a “loss” (n=120).
events of death (n=3) were excluded. Previous information was provided by nurses and/or collected from oficial documents (vital records, medical records and records from the Basic Health Care Information System (SIAB). Nine mothers refused to participate, thus totaling 204 individuals participating in the study.
Data were collected at the UBSFs and/or at the mothers’ home, by health students and pro-fessionals, all of them trained and supervised. A manual of instructions was elaborated aiming to guide and standardize form illing and data col -lection. Training sessions were carried out with interviewers in order to assess the data collection instrument and make possible adjustments after discussions and evaluations.
The data collection instrument used for the study was a questionnaire that requested infor-mation about the mothers (socio-demographic and economic characteristics) and about health units (structural aspects), the latter being given by nurses. Information concerning the nutritional status of children, as well as growth monitoring was taken from the CC/CSC.
The pilot study was carried out at Palmeira Health Center, in the municipality of Campina Grande, where the interviewers discussed the dificulties arising from adaptations made to the questionnaire, resulting in its inal version.
Children were characterized according to their household location (rural or urban area), using the following variables: (a) relating to nu-tritional status - birth weight (≥2500g =0; <2500g =1), weight/age ratio, based on the last record of weight found in the card (between percentile 10 and 97 =0; below percentile 10 or above 97 =1), direction of weight/age curve considering the last two records of weight shown in the graph (upwards =0; downwards or horizontal =1); (b) relating to mothers – age (between 20 and 34 years-old =0; ≥35 years-old =1; ≤19 years-old =2), years of education (≥12 =0; between 5 and 11 =1; <5 =2), marital status (in a relationship =0; not in a relationship =1); (c) relating to the families’ socio-economical situation - per capita income (1MW ≤ income/person <2MW =0; 1/2 MW ≤ income/ person <1MW =1; income/person < 1/2MW =2), number of rooms in the household (≥3 =0; <3 =1), number of people in the household (<7 =0; ≥7 =1), water supply (public =0; well/spring =1; other =2), drinking water treatment (iltered/boiled/
chlorinated =0; mineral/bottled =1; no treatment =2), garbage disposal (collected =0; burned/buried =1; open ditches =2), sewage (public service =0; septic tank =1; open =2), social program allow-ances (yes =0; no =1).
The structure and work process aspects in UBSFs were taken into consideration in order to analyze the actions of growth monitoring. In order to characterize the service structure in the UBSFs according to their locations (urban or rural area), the following variables were used: completeness of staff (physician, nurse, nursing technician and ACS) (complete =0; incomplete =1), support to staff from nutritionists and pediatricians of NASF (yes =0; no =1), availability of height measuring equipment for children (yes =0; no =1), availability of weight measuring equipment for children (yes =0; no =1), availability of CC/CSC (yes =0; no =1), availability of trained nurses for child care (yes =0; no =1), use of a protocol for growth monitoring (yes =0; no =1).
The characterization of the professionals’ work process regarding growth monitoring took into account the weight record of the last three months found in the CC/CSC (yes =0; no =1), the height record of the last three months found in the CC/CSC (yes =0; no =1) and at least two weight records in the weight/age graph of the CC/CSC (yes =0; no =1). These data were analyzed accord-ing to the household location (rural or urban area) and birth weight.
The information was encoded in Excel, where the questionnaires were entered twice in order to compare them and detect possible mistakes. The Validate application from Epi Info program was used in order to assess data consis-tency. The categories of variables represented by zero were considered as reference, whereas those represented by any other value than zero were con-sidered as risk categories. In order to differentiate the urban and rural areas, as well as birth weights, the chi-square test was performed, considering a value of p<0.05 to express statistical signiicance. The program R v2.10.0 was used.
RESULTS
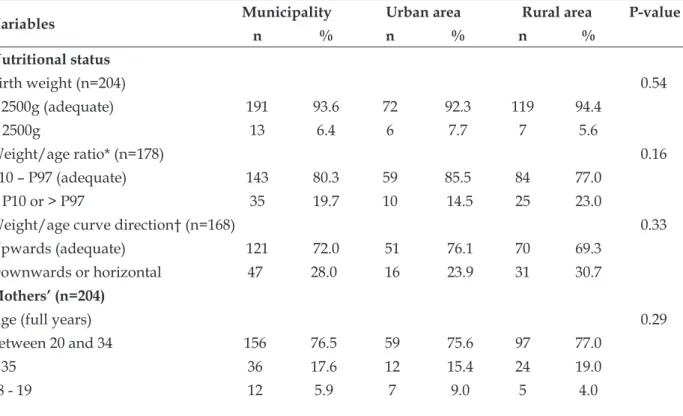
The characteristics of children are described in Table 1, according to their household location. Out of the 204 children participating in the study, 104 (51%) were boys and 100 (49%) were girls, all of them between 18 and 30 months-old, 78 (38.2%) residing in the urban area and 126 (61.8%) in the rural area. There were no signiicant differences between both areas concerning the variables of children’s nutritional status but also concerning the mothers’ age, marital status, number of rooms in the household, number of people in the house-hold and drinking water treatment.
Out of the total children examined, 6.4% were born underweight, and concerning the two layers, 7.7% and 5.6% were in the urban and rural areas, respectively. According to the last recorded weight, 19.7% of children had their weight/age below percentile 10 or above percentile 97, this pre-dominance being more frequent in the rural area (23%) than in the urban area (14.5%). In regards to the weight/age curve direction, considering the last two weights shown in the graph, 28% of children had a downwards or horizontal tracing, this predominance being higher in the rural area (30.7% against 23.9%).
Younger mothers (18-19 years-old) and those who were 35 or older accounted for 5.9% and
17.6% respectively. There was a predominance of adolescent mothers in the urban area (9%) comparing to the rural area (4%). In regards to the mothers’ education, 12.2% had low education levels (<5 years) and the majority had between ive and eleven years of education (65.2%). The difference in education between the two groups was statistically signiicant (p=0.03), and a greater percentage of mothers with 12 or more years of education was observed in the urban area (32%) whereas in the rural area this percentage was of 16.7%. The majority of mothers (81%) were living with a partner.
Most children belonged to families with a monthly per capita income lower than half a mini-mum wage. The per capita income differences were statistically signiicant (p=0.03) when comparing the two areas, as it was observed that the percent-age of families in the urban area with incomes between one and two minimum wages was ive times higher than in the rural area. Likewise, the analysis of the water supply in the household, of the garbage disposal and sewage revealed a signiicant difference (p<0,001), as the situation was often better in the urban area. A signiicant difference was also seen regarding social programs allowances, as there was a greater quantity of beneiciaries in the rural area.
Table 1 - Sample study characterization, according to household location. Queimadas-PB, 2011
Variables Municipality Urban area Rural area P-value
n % n % n %
Nutritional status
Birth weight (n=204) 0.54
≥ 2500g (adequate) 191 93.6 72 92.3 119 94.4
< 2500g 13 6.4 6 7.7 7 5.6
Weight/age ratio* (n=178) 0.16
P10 – P97 (adequate) 143 80.3 59 85.5 84 77.0
< P10 or > P97 35 19.7 10 14.5 25 23.0
Weight/age curve direction† (n=168) 0.33
Upwards (adequate) 121 72.0 51 76.1 70 69.3
Downwards or horizontal 47 28.0 16 23.9 31 30.7
Mothers’ (n=204)
Age (full years) 0.29
Between 20 and 34 156 76.5 59 75.6 97 77.0
≥ 35 36 17.6 12 15.4 24 19.0
Years of education 0.03
≥ 12 46 22.6 25 32.0 21 16.7
Between 5 and 11 133 65.2 45 57.7 88 69.8
< 5 25 12.2 8 10.3 17 13.5
Marital status 0.48
With partner 165 81.0 65 83.3 100 79.4
No partner 39 19.0 13 16.7 26 20.6
Regarding the families (n=204)
Per capita income‡ 0.03
1MW ≤ PCI < 2MW 4 2.0 4 5.1 0 0.0
1/2 MW ≤ PCI < 1MW 22 10.8 9 11.5 13 10.3
PCI < 1/2MW 178 87.2 65 83.4 113 89.7
Number of rooms in household 0.06
≥ 3 194 95.1 77 98.7 117 92.9
< 3 10 4.9 1 1.3 9 7.1
Number of people in household 0.75
< 7 184 90.2 71 91.0 113 89.7
≥ 7 20 9.8 7 9.0 13 10.3
Water supply in household < 0.001
Public service 126 61.8 76 97.4 50 39.7
well/spring 7 3.4 - - 7 5.5
Other 71 34.8 2 2.6 69 54.8
Drinking water supply 0.80
Filtered/boiled/chlorinated 146 71.6 54 69.2 92 73.0
Mineral/bottled 30 14.7 13 16.7 17 13.5
No treatment 28 13.7 11 14.1 17 13.5
Garbage disposal <0.001
Collected 126 61.7 77 98.7 49 38.9
Burned/buried 75 36.8 1 1.3 74 58.7
Open ditches 3 1.5 0 0.0 3 2.4
Sewage <0.001
Public service 56 27.5 47 60.3 9 7.2
Septic tank 101 49.5 27 34.6 74 58.7
Open ditches 47 23.0 4 5.1 43 34.1
Social program allowance <0.001
Yes 155 76.0 45 58.4 110 86.6
No 49 24.0 32 41.6 17 13.4
* Based on the last recorded weight in the weight x age graph shown in the CC/CSC; † based on the last two recorded weights in the
weight x age graph shown in the CC/CSC; ‡ MW: minimum wage, considering the oficial minimum wage at the time (BRL 454.00).
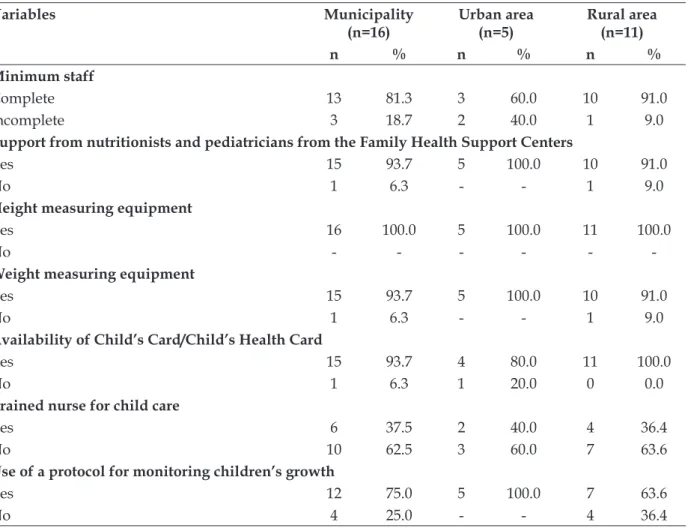
In table 2, the analysis of the service struc-tures, based on information given by nurses, revealed that approximately 20% of the units did not have a full staff but only 6.3% did not have
6.3% of cases the CC/CSC was not available. Over 60% of the nurses in charge of child care stated that they had not been trained for health care actions
towards children. Out of the total of nurses from both layers, 75% stated that growth monitoring is based on a protocol.
Table 2 - Characteristics related to Basic Family Health Units structures for child growth monitoring, according to the location of the units. Queimadas-PB, 2011
Variables Municipality
(n=16)
Urban area (n=5)
Rural area (n=11)
n % n % n %
Minimum staff
Complete 13 81.3 3 60.0 10 91.0
Incomplete 3 18.7 2 40.0 1 9.0
Support from nutritionists and pediatricians from the Family Health Support Centers
Yes 15 93.7 5 100.0 10 91.0
No 1 6.3 - - 1 9.0
Height measuring equipment
Yes 16 100.0 5 100.0 11 100.0
No - - -
-Weight measuring equipment
Yes 15 93.7 5 100.0 10 91.0
No 1 6.3 - - 1 9.0
Availability of Child’s Card/Child’s Health Card
Yes 15 93.7 4 80.0 11 100.0
No 1 6.3 1 20.0 0 0.0
Trained nurse for child care
Yes 6 37.5 2 40.0 4 36.4
No 10 62.5 3 60.0 7 63.6
Use of a protocol for monitoring children’s growth
Yes 12 75.0 5 100.0 7 63.6
No 4 25.0 - - 4 36.4
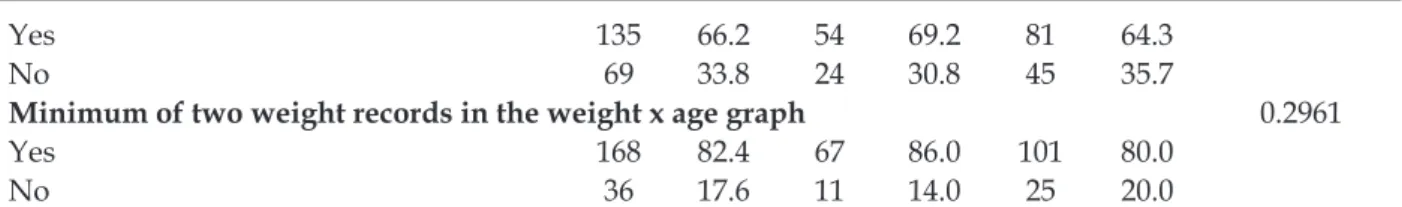
In regards to growth monitoring in the health units (Table 3), 61.3% of the children had weight records and 66.2% had height records, both from the last three months. The rate of at least two weight records in the W/A graph, as of the date of the interview, was 82.4%. During growth
moni-toring, CC/CSC records were more complete in the urban area, however the difference was only signiicant for the variable “weight from the last three months”, the performance being 71.8% in the urban area against 54.8% in the rural area.
Table 3 - Characteristics related to growth monitoring, considering the records contained in the Child’s Card/Child’s Health Card, according to their household location. Queimadas-PB, 2011
Variables Municipality Urban area Rural area P-value
n % n % n %
Weight records from the last three months 0.0152
Yes 125 61.3 56 71.8 69 54.8
No 79 38.7 22 28.2 57 45.2
Yes 135 66.2 54 69.2 81 64.3
No 69 33.8 24 30.8 45 35.7
Minimum of two weight records in the weight x age graph 0.2961
Yes 168 82.4 67 86.0 101 80.0
No 36 17.6 11 14.0 25 20.0
A high percentage of children (low birth weight and normal birth weight) stopped having their growth monitored properly. Children with low birth weight, considered as having a
nutrition-al risk, did not have a specinutrition-al growth monitoring if compared to children who had a normal birth weight (Table 4).
Table 4 - Characteristics related to growth monitoring, considering the records contained in the Child’s Card/Child’s Health Card, according to their birth weight. Queimadas-PB, 2011
V ar iab le E xam in ed (n ) No weig h t r ec o rd s fr o m th e las t th ree m o n th s P -v alu e E xam in ed (n ) No h eig h t r ec o rd s fr o m th e las t th ree m o n th s P -v alu e E xam in ed (n ) No m in im u m o f 2 weig h t r ec o rd s in th e Weig h
t x A
g e g rap h P -v alu e
n % n % n %
Birth weight 0.76 0.79 0.38
≥ 2500g 181 74 40.9 156 66 40.0 191 35 41.3
< 2500g 11 5 45.5 8 3 43.0 12 1 29.8
DISCUSSION
Lower education levels, lower per capita in-comes, worse basic sanitation and higher number of inancial support beneiciaries were directly related to individuals living in the rural area. These data are consistent with other studies that high-lighted the unequal distribution of infrastructure and sanitation in urban and rural areas, relating the worst conditions to the rural area,9 or differenc-es in general to the education levels of mothers.10-11 It is worth mentioning that these comparisons do not make value judgments, but only suggest that the social context is generally associated with the household location. It is desirable that profes-sionals be aware of the current conditions of the families they monitor, as this information will orientate the way care should be delivered so as to meet children and families’ needs.12
Structure and monitoring process assessment in the municipality of Queimadas presented some signiicant weaknesses that must be improved. In terms of structure, a large number of untrained professionals within the two geographical areas
studied was seen, as well as a shortage of staff, es-pecially in the urban area, which affects the service performance and consequently people’s health.13 Therefore, Primary Health Care management needs a strong incentive for its development, so this important action, i.e. children growth monitor-ing, does not lose its essential meaning and is not achieved in a fragmented way, being carried out only when there is complaint, which is the curative approach, and not the preventive one.14
On the other hand, when compared to other studies,2,15 the presence of a professional nutri-tionist in the ESFs of Queimadas is encouraging. The absence of this professional goes against the principle of completeness in health actions and the knowledge of nutrition problems and evolution, in a time when essential changes in the epidemiologi-cal landscape are happening in Brazil.16
the nutritional status diagnosis, advising, treating and health promotion.2 Nevertheless, in order to enable growth monitoring completeness, the use of protocols is essential to achieve standard and uniform actions.17 Therefore, health professionals and managers must be familiar with the technical standards of the Food and Nutrition Surveillance System from the Brazilian Ministry of Health 18 and with the Qualiication Program in Anthropometry, which has been recently published by Brazilian researchers.19 The lack of qualiication and failure to use protocols in four out of eleven units of the rural area could result in problems related to nu-tritional status rating, identiication of risks and optimization/systematization of care practice.
Within the municipality, process indicators of weight and height records in the last three months stopped being registered in 38.7% and 33.8% of the 204 CC/CSC examined, respectively. Similar results were seen in the examination of medical records of children monitored during one year in the UBSF childcare of João Pessoa, Paraíba, as weight and height measurements had not been made in any of the consultations in 30.8% and 38.5% of cases, respectively.20 Likewise, the National Demographic and Health Survey of 2006 indicated that less than 30% of cards had weight records.21
In regards to two or more weight records in the weight x age graph, the 17.6% ratio of non-compliance in this study is similar to the one found in Pelotas, Rio Grande do Sul (22%).22 This information, besides being important for the regular diagnosis, as it may indicate the growth pace,4 alerts to the possibility of non-compliance with the minimum of seven consultations in the irst year of life, as recommended by the Ministry of Health.23 This fact can be taken up considering that the examined children were between 18 and 31 months-old and that the record in the weight x age graph is a basic action.23
A previous study that assessed the quality of information provided in childcare forms for children under one year-old in 26 health units revealed a greater proportion of good/very good information in rural health units (53%) compared to the urban units (40%).22 In turn, a study that compared aspects related to growth monitoring in the metropolitan area of Recife to the country-side of the state of Pernambuco observed worse conditions in the countryside.2 These indings put forward the possible differences between two geographical areas regarding growth monitoring,
which is reinforced by the problems encountered with weight records from the last three months in the rural area of the municipality of Queimadas. It is widely known that newborn babies weighing less than 2,500g have a greater risk of dying in their irst year of life compared to babies with normal weight. Therefore, every child with low birth weight must be considered as in nutri-tional risk and must be monitored more closely by health services, especially during the irst year, so as to reduce morbimortality risks.22-23 In this context, the Kangaroo Care24 appeared as a new form of care for underweight newborn babies. Nevertheless, the specialized care that is con-ceived for these babies has not taken place in the evaluated services, which shows a lack of focus on programmatic actions and an underestimate of the role of birth weight indicators in nutritional status monitoring. This deiciency was noticed by health professionals of Pirituba and Perus, in the north-ern area of São Paulo, when they warned of the non-compliance with guidelines on care for babies at risk regarding underweight newborn babies.25
The data used to evaluate the work process were collected from the CC/CSC. Thus, when this information is interpreted, it is necessary to take into account the possible differences between these records and those available in the USBFs, as it is also necessary to consider the number of mothers who forget to take the CC/CSC with them to the consultations. In São Paulo,26 for instance, 12.3% of mothers forgot to take the children’s CC to consultations. Besides, it is essential to consider the possibility of care being delivered but not re-corded, thus resulting in under-recording, which would improve the results of the assessed features. A study carried out in the health units of Alagoas found out that weight records were performed in 91.1% of children’s medical records but appeared only in 13.3% of CCs.27 In another study,26 the pro-cess was observed systematically in 114 nursing consultations of children within the municipality’s UBSFs and the authors noticed that weight and height measuring was done by 100% of nurses. The authors suggest then that additional studies be carried out in order to assess both the record differences between the sources (medical records x CC/CSC) and the accuracy of values recorded by the staff as this is an important feature in child growth monitoring.
-tion, especially of those related to children’s nutritional status. When interpreting the results of this study, it is also necessary to consider the possible inluence of excluded cases, particularly those of mothers who did not go to any prenatal consultation in the UBSF, as the results would have been different if these cases were included. A selection bias is possible, if the excluded cases had differences concerning exposure and outcome.
CONCLUSION
This study shows that child growth moni-toring is not effectively consolidated which is the result of actions not carried out in compliance with public policies regarding child care, as rec-ommended by the Ministry of Health. Problems range from lack of staff and qualiication of these professionals to assiduity in weight and height records. It is thus necessary to have support from managers in order to achieve full and effective management, which makes proper child care have a positive impact on the epidemiological nutrition proile in childhood, on quality of life and infant mortality decrease. In that sense, it is necessary to improve the knowledge of professionals who work with nutrition data. The quality assurance of nutritional surveillance data is important not only to understand the nutritional evolution of children but also to make policies and programs aimed at health and nutrition improvement.
REFERENCES
1. Silva SA, Moura EC. Determinantes do estado de saúde de crianças ribeirinhas menores de dois anos de idade do Estado do Pará, Brasil: um estudo transversal. Cad Saúde Pública. 2010Fev; 26(2):273-85.
2. Carvalho MF, Lira PIC, Romani SAM, Santos IS, Veras AACA, Batista FM. Acompanhamento do crescimento em crianças menores de um ano: situação nos serviços de saúde em Pernambuco, Brasil. Cad Saúde Pública. 2008 Jan-Mar; 24(3):675-85.
3. Alves CRL, Lasmar LMLBF, Goulart LMHF, Alvim CG, Maciel GVR, Viana MRA, et al. Qualidade do preenchimento da Caderneta de Saúde da Criança e fatores associados.Cad Saúde Pública. 2009 Jan-Mar; 25(3):583-95.
4. Zeferino AMB, Filho AAB, Bettiol H, Barbieri MA. Acompanhamento do crescimento. J Pediatr. 2003 Mai-Jun; 79(Supl.1):23-32.
5. Ratis CAS, Batista Filho M. Aspectos estruturais e processuais da vigilância do crescimento de menores
de cinco anos em serviços públicos de saúde do Estado de Pernambuco. Rev Bras Epidemiol. 2004 Mar; 7(1):44-53.
6. Reichert APS, Almeida AB, Souza LC, Silva MEA, Collet N. Vigilância do crescimento infantil: conhecimento e práticas de enfermeiros da atenção primária à saúde. Rev Rene. 2012 Jan-Mar; 13(1):114-26.
7. Bittar OJNV. Indicadores de qualidade e quantidade em saúde. RAS. 2001 Jul-Set; 3(12):21-8.
8. Orlonski S, Dellagrana RA, Rech CR, Araújo EDS.
Estado nutricional e fatores associados ao déicit de
estatura em crianças atendidas por uma unidade de ensino básico de tempo integral. Rev Bras Crescimento Desenvolvimento Hum. 2009 Abr; 19(1):54-62.
9. Azeredo CM, Cotta RMM, Schott M, Maia TM, Marques ES. Avaliação das condições de habitação e saneamento: a importância da visita domiciliar no
contexto do Programa de Saúde da Família. Ciênc
Saúde Coletiva. 2007 Mai-Jun; 12(3):743-3.
10. Martins PO, Trindade ZA, Almeida AMO. O ter e o ser: representações sociais da adolescência entre adolescentes de inserção urbana e rural. Psicol Relex
Crit. 2003Set-Dez; 16(3):555-68.
11. Kobarg APR, Vieira ML. Crenças e práticas de mães sobre o desenvolvimento infantil nos contextos rural e urbano. Psicol Relex Crit. 2008Set-Dez; 21(3):401-8.
12. Abdon JB, Dodt RCM, Vieira DP, Martinho NJ, Carneiro EP, Ximenes LB. Auditoria dos registros na consulta de enfermagem acompanhando o crescimento e desenvolvimento infantil. Rev Rene. 2009 Jul-Set; 10(3):90-6.
13. Facchini LA, Piccini RX, Tomasi E, Thumé E, Silveira DS, Siqueira DS, et al. Desempenho do PSF no Sul e no Nordeste do Brasil: avaliação institucional e epidemiológica da Atenção Básica à Saúde.Ciênc Saúde Coletiva. 2006 Jul-Set; 11(3):669-81.
14. Monteiro AI, Macedo IP, Santos ADB, Araújo WM. A enfermagem e o fazer coletivo: acompanhando o crescimento e o desenvolvimento da criança. Rev Rene. 2011 Jan-Mar; 12(1):73-80.
15. Niquini RP, Bittencourt AS, Lacerda EMA, Saunders C, Leal MC. Avaliação da estrutura de sete unidades de saúde da família para a oferta da assistência nutricional no pré-natal no município do Rio de Janeiro, Brasil. Rev Bras Saúde Matern Infant. 2010 Nov; 10 (Supl. 1):S61-8.
16. Geus LMM, Maciel CS, Burda ICA, Daros SJ, Batistel S, Martins TCA, et al. A importância na inserção do nutricionista na Estratégia Saúde da Família. Ciênc Saúde Coletiva. 2011 Mar; 16(Supl. 1):797-04.
18. Ministério da Saúde (BR), Secretaria de Atenção à Saúde, Departamento de Atenção Básica. Orientações para a coleta e análise de dados antropométricos em serviços de saúde: Norma Técnica do Sistema de Vigilância Alimentar e Nutricional – SISVAN. Brasília (DF): MS; 2011.
19. Bagni UV, Barros DC. Capacitação em antropometria como base para o fortalecimento do Sistema de Vigilância Alimentar e Nutricional no Brasil. Rev Nutr. 2012 Maio-Jun; 25(3):393-02.
20. Lima GGT, Silva MFOC, Costa TNA, Neves AFGB, Dantas RA, Lima ARSO. Registros do enfermeiro no acompanhamento do crescimento e desenvolvimento: enfoque na consulta de puericultura. Rev Rene. 2009 Jul-Set; 10(3):117-24.
21. Cavenaghi S. Pesquisa Nacional de Demograia e
Saúde da Criança e da Mulher – PNDS 2006 - Anexo 11 – erros não amostrais. Brasília (DF): MS; 2008. 22. Ceia MLM, Cesar JA. Avaliação do preenchimento
dos registros de puericultura em Unidades Básicas de Saúde em Pelotas, RS. Rev AMRIGS. 2011 Jul-Set; 55(3):244-9.
23. Ministério da Saúde (BR), Secretaria de Políticas de Saúde, Departamento de Atenção Básica. Saúde da criança: acompanhamento do crescimento e desenvolvimento infantil. Brasília (DF): MS; 2002. 24. Ministério da Saúde (BR), Secretaria de Atenção
a Saúde, Departamento de Ações Programáticas Estratégicas. Atenção Humanizada ao Recém-Nascido de Baixo Peso: Método Canguru. Brasília (DF): MS; 2011.
25. Buccini GS, Sanches MTC, Noueira-Martins MCF, Bonamigo AW. Acompanhamento de recém-nascidos de baixo peso pela atenção básica na perspectiva das Equipes de Saúde da Família. Rev Bras Saúde Matern Infant. 2011 Jul-Set; 11(3):239-47. 26. Saparolli ECL, Adami NP. Avaliação da qualidade da consulta de enfermagem à criança no Programa de Saúde da Família. Acta Paul Enferm. 2007 Jan-Mar; 20(1):55-61.
27. L i m a M A A , O l i v e i r a M A A , F e r r e i r a H S .
Coniabilidade dos dados antropométricos obtidos
em crianças atendidas na Rede Básica de Saúde de Alagoas. Rev Bras Epidemiol. 2010 Mar; 13(1):69-82.
Correspondence:Ana Carolina Dantas Rocha Rua Luiza Soares, 120, ap. 10
58401-405 – Lauritzen, Campina Grande, PB, Brazil E-mail: [email protected]