AMTD
8, 4973–5023, 2015EARLINET Single Calculus Chain – general presentation
methodology and strategy
G. D’Amico et al.
Title Page
Abstract Introduction
Conclusions References
Tables Figures
◭ ◮
◭ ◮
Back Close
Full Screen / Esc
Printer-friendly Version
Interactive Discussion
Discussion
P
a
per
|
Discussion
P
a
per
|
Discussion
P
a
per
|
Discussion
P
a
per
|
Atmos. Meas. Tech. Discuss., 8, 4973–5023, 2015 www.atmos-meas-tech-discuss.net/8/4973/2015/ doi:10.5194/amtd-8-4973-2015
© Author(s) 2015. CC Attribution 3.0 License.
This discussion paper is/has been under review for the journal Atmospheric Measurement Techniques (AMT). Please refer to the corresponding final paper in AMT if available.
EARLINET Single Calculus Chain –
general presentation methodology and
strategy
G. D’Amico1, A. Amodeo1, H. Baars2, I. Binietoglou1,3, V. Freudenthaler4,
I. Mattis2,5, U. Wandinger2, and G. Pappalardo1
1
Consiglio Nazionale delle Ricerche, Istituto di Metodologie per l’Analisi Ambientale (CNR-IMAA), Tito Scalo, Potenza, Italy
2
Leibniz Institute for Tropospheric Research, Leipzig, Germany
3
National Institute of R&D for Optoelectronics INOE,Bucharest, Romania
4
Ludwig-Maximilians-Universität, Meteorologisches Institut Experimentelle Meteorologie, Munich, Germany
5
Deutscher Wetterdienst, Meteorologisches Observatorium Hohenpeißenberg, Germany
Received: 20 March 2015 – Accepted: 23 April 2015 – Published: 13 May 2015 Correspondence to: G. D’Amico ([email protected])
AMTD
8, 4973–5023, 2015EARLINET Single Calculus Chain – general presentation
methodology and strategy
G. D’Amico et al.
Title Page
Abstract Introduction
Conclusions References
Tables Figures
◭ ◮
◭ ◮
Back Close
Full Screen / Esc
Printer-friendly Version
Interactive Discussion
Discussion
P
a
per
|
Discussion
P
a
per
|
Discussion
P
a
per
|
Discussion
P
a
per
|
Abstract
In this paper we describe the EARLINET Single Calculus Chain (SCC) a tool for the automatic analysis of lidar measurements. The development of this tool started in the framework of EARLINET-ASOS (European Aerosol Research Lidar Network – Ad-vanced Sustainable Observation System) project and it is still continuing within ACTRIS 5
(Aerosol, Clouds and Trace gases Research InfraStructure Network) project. The main idea was to develop a chain which allows all EARLINET stations to retrieve in a full automatic way the aerosol backscatter and extinction profiles starting from the raw lidar data of the lidar systems they operate. The calculus subsystem of the SCC is composed by two modules: a pre-processor module that handles the raw lidar data 10
and corrects them for instrumental effects and an optical processing module for the re-trieval of aerosol optical products from the pre-processed data. All the input parameters needed to perform the lidar analysis are stored in a database to get them in an effi -cient way and also to keep track of all the changes that may occur on any EARLINET lidar system over the time. The two calculus modules and the data are coordinated and 15
synchronized by a further module (deamon) which makes fully automatic the whole analysis process. The end-user can interact with the SCC using a user-friendly web interface. All the SCC modules are developed using open source and free available software packages. The final products retrieved by the SCC fulfill all constraints fixed in the framework of the EARLINET quality assurance programs on both instrumental 20
and algorithm levels. Moreover the man power needed to provide aerosol optical prod-ucts is greatly reduced improving the near-real time availability of lidar data. The high quality of the SCC products is demonstrated by the good agreement between the SCC analysis and the corresponding independent manual retrievals. Finally, a real example of the applicability of the SCC in providing high quality aerosol optical products in case 25
AMTD
8, 4973–5023, 2015EARLINET Single Calculus Chain – general presentation
methodology and strategy
G. D’Amico et al.
Title Page
Abstract Introduction
Conclusions References
Tables Figures
◭ ◮
◭ ◮
Back Close
Full Screen / Esc
Printer-friendly Version
Interactive Discussion
Discussion
P
a
per
|
Discussion
P
a
per
|
Discussion
P
a
per
|
Discussion
P
a
per
|
1 Introduction
The contribution of the aerosols in the atmospheric processes is not well known. In particular an important gap needs to be filled to clarify better the rule the aerosols play in the Earth radiation budget problem and in climate changes (IPCC, 2007, 2013).
The most critical issue in understanding the processes in which the aerosols are in-5
volved is the high variability they have in terms of type, source, time and space (Diner et al., 2004). For this reason for the scientific community is particularly interesting to have access to the optical parameters characterizing the aerosol in terms of high res-olution vertical atmospheric profiles. The lidars have the advantage to provide space and time resolved vertical profiles of aerosol optical parameters and to allow us the full 10
characterization of each layer present in the atmosphere.
Another important aspect to consider for the study of aerosols is the good cover-age of lidar measurements on large scale. To support this need several coordinated lidar networks have been set-up in the last years. In particular EARLINET (European Aerosol Research LIdar NETwork) is operative in Europe since 2000 and provides the 15
scientific community with the most complete database of aerosol optical parameters vertical profiles on European scale (Pappalardo et al., 2014; Earlinet, 2014). The EAR-LINET data can be used for several purposes like models evaluation and assimilation, full exploitation of satellite data, study of aerosol long range transport mechanism, monitoring of special events like volcanic eruption, large forest fire or dust outbreaks. 20
Within the EARLINET-ASOS (European Aerosol Research Lidar Network – Ad-vanced Sustainable Observation System) project great importance was given to the optimization of lidar data processing (http://www.earlinetasos.org). The core of this ac-tivity was the development of the EARLINET Single Calculus Chain (SCC) a tool for the automatic evaluation of lidar data from raw signals up to the final products.
25
AMTD
8, 4973–5023, 2015EARLINET Single Calculus Chain – general presentation
methodology and strategy
G. D’Amico et al.
Title Page
Abstract Introduction
Conclusions References
Tables Figures
◭ ◮
◭ ◮
Back Close
Full Screen / Esc
Printer-friendly Version
Interactive Discussion
Discussion
P
a
per
|
Discussion
P
a
per
|
Discussion
P
a
per
|
Discussion
P
a
per
|
quality assurance program and taking care to deliver to the end-users only homoge-neous products compliant with this program. In many specific situations it is also quite important these products retrieved on large geographical scale (for example on conti-nental scale) are made available in real-time or in near-real-time. This is the case for example of vertically resolved lidar products used to improve the forecast of air quality 5
or climate change models, to validate satellite sensors or models or to monitor special events. Without a common analysis tool it could be difficult to assure at the same time homogenous high quality products and short time availabiliby of the data because usu-ally high quality manual lidar data analysis requires time and man power. Moreoever different groups within the network may use different retrieval approaches to derive the 10
same type of aerosol product with a consequent loss in the homogeneity of the network dataset.
Another important key point to take into account in developing the SCC is hetero-geneity of the lidar systems composing a typical lidar network. Excluding few excep-tions, usually a lidar network is formed by really different and not standardized lidar 15
systems ranging from single elastic backscatter lidar to advanced multi-wavelength Raman systems. Frequently, a system is improved or upgraded from a basic config-uration to a more complex one by adding, for example, new detection channels. As consequence the SCC must adapt itself to handle data acquired by different instru-ments which usually require different instrumental corrections and also different ap-20
proaches to get quality assured products. For example as, in general, not all the lidars are characterized by the same signal to noise ratio (SNR), different smoothing algo-rithms or different integration times need to be selected to constrain the final products to the same accuracy level. EARLINET is a good example on how heterogenous the lidar systems forming a network can be. Typically EARLINET lidar systems can differ 25
AMTD
8, 4973–5023, 2015EARLINET Single Calculus Chain – general presentation
methodology and strategy
G. D’Amico et al.
Title Page
Abstract Introduction
Conclusions References
Tables Figures
◭ ◮
◭ ◮
Back Close
Full Screen / Esc
Printer-friendly Version
Interactive Discussion
Discussion
P
a
per
|
Discussion
P
a
per
|
Discussion
P
a
per
|
Discussion
P
a
per
|
the analysis of raw data does not need to take into account many different instrumen-tal aspects with a consequent reduction (from this point of view) of the development complexity. On the contrary, the EARLINET lidar systems are really heterogeneous in many aspects and many of them are home-made or highly customized. This makes, from practical point of view, impossible to develop a single algorithm to analyze all the 5
EARLINET data.
For these reasons the main concept to put at the base of the SCC development is the implementation of a tool able to provide quality assured aerosol optical products from raw lidar data in an fully unattended way. At the same time, to make the use of this tool really sustainable over the time an easy expandiblility should be assured to 10
guarantee the analysis of the data from new or upgraded lidar systems.
The main advantage of this approach is to increase the rate of population of the aerosol databases which is the main outrich of any lidar network promoting, in general, the usage of lidar retrieved vertically resolved aerosol parameters within the scientific community.
15
To the above general considerations some specific EARLINET constraints need to be considered in developing the SCC. The EARLINET quality assurance program involves both the instrumental and algorithm retrieval levels (Mattias et al., 2004; Freudenthaler et al., 2015). As consequence an aerosol optical product can be considered EAR-LINET quality assured only if it has been measured with a lidar system which passed 20
the instrumental quality assurance tests and if it has been calculated using certified algorithms (Böckmann et al., 2004; Pappalardo et al., 2004). The SCC products au-tomatically fulfill both these requirements as all the algorithms implemented are EAR-LINET quality assured and specific tests have been set up to verify the raw lidar data have been measured by a quality assured lidar system.
25
AMTD
8, 4973–5023, 2015EARLINET Single Calculus Chain – general presentation
methodology and strategy
G. D’Amico et al.
Title Page
Abstract Introduction
Conclusions References
Tables Figures
◭ ◮
◭ ◮
Back Close
Full Screen / Esc
Printer-friendly Version
Interactive Discussion
Discussion
P
a
per
|
Discussion
P
a
per
|
Discussion
P
a
per
|
Discussion
P
a
per
|
2005; Ackermann, 1998). Moreover such kind of products can be used as inputs to infer microphysical properties of atmospheric aerosols (Müller et al., 1999a, b; Böckmann, 2001). In particular, it is important to mention that two independent SCC modules have been developed to retrieve microphysical properties of the atmospheric aerosols from multi-wavelength Raman lidar data (Müller and Böckmann, 2015). The main products 5
of both these modules are particle effective radius, volume concentration, and refrac-tive index which are calculated with a semi-automated and unsupervised algorithm. However, even if these modules have been released in their operational versions, they are not yet included in the automatic structure of the SCC.
Even if the SCC has been developed to be the main tool to analyze EARLINET lidar 10
data, its high degree of flexibility and expandibility makes the same tool easily usable in a more general contests and for other lidar networks. As EARLINET represents already a quite complete example of all the available lidar system typologies it is expected to smoothly adapt the SCC to run in more extended frameworks like for example GALION (GAW Aerosol LIdar Observation Network).
15
To our knowlegde the SCC is the first tool that can be used to analyze raw data measured by many different typologies of lidar systems in a full automatic way. The other existing tools for the automatic analysis of lidar data are usable only for a specific lidar system and cannot be easily extended to retrieve aeorol products of whole lidar networks which are usually composed by different instruments. Another unique charac-20
teristic of the SCC is that its aeorosol products are delivered according to a rigoruous quality assurance program to provide always the highest possible quality products at network level.
This paper is the first of three publications about the SCC and it presents an overview of the SCC and its validation. Two separated papers are used to describe the technical 25
details of the SCC pre-processing module (D’Amico et al., 2015) and of the optical processing module (Mattis et al., 2015) respectively.
AMTD
8, 4973–5023, 2015EARLINET Single Calculus Chain – general presentation
methodology and strategy
G. D’Amico et al.
Title Page
Abstract Introduction
Conclusions References
Tables Figures
◭ ◮
◭ ◮
Back Close
Full Screen / Esc
Printer-friendly Version
Interactive Discussion
Discussion
P
a
per
|
Discussion
P
a
per
|
Discussion
P
a
per
|
Discussion
P
a
per
|
The last two sections of the paper explain the strategy we adopted to validate the SCC and an example of the application of the SCC to provide a tool to provide network lidar data in near real time.
2 Requirements
In this section the requirements to accomplish all the key points explained in the previ-5
ous section will be described.
In the framework of the EARLINET quality assurance program several algorithms for the retrieval of aerosol optical parameters have been inter-compared to evaluate their performances in providing high quality aerosol products (Böckmann et al., 2004; Pappalardo et al., 2004). This inter-comparison was mainly addressed to asses a com-10
mon European standard for the quality assurance of lidar retrieval algorithms and to ensure the data provided by each individual station are permanently of highest possi-ble quality according to common standards. All the different quality-assured analysis algorithms developed within EARLINET have been collected, critically evaluated with respect to their general applicability, optimized to make them fully automatic and finally 15
implemented in the SCC. A critical point was the implementation of reliable and robust algorithms to assure accurate calibration of aerosol backscatter profile. In a fully au-tomatic analysis scenario particular attention should be devoted to this issue to avoid large inaccuracy in the final optical products. Noisy raw lidar signals or the presence of aerosol within the calibration region can induce large errors in the lidar calibration 20
constant.
The SCC has been developed having in mind the following concepts: platform inde-pendency, open source philosophy, standard data format (NetCDF), flexibility through the implementation of different retrieval procedures, expandability to easily include new systems or new system configurations. All the libraries and the compilers needed to in-25
AMTD
8, 4973–5023, 2015EARLINET Single Calculus Chain – general presentation
methodology and strategy
G. D’Amico et al.
Title Page
Abstract Introduction
Conclusions References
Tables Figures
◭ ◮
◭ ◮
Back Close
Full Screen / Esc
Printer-friendly Version
Interactive Discussion
Discussion
P
a
per
|
Discussion
P
a
per
|
Discussion
P
a
per
|
Discussion
P
a
per
|
SCC is running and use or configure the SCC retrieval procedures on their data using a web interface. The centralized server solution (which is the preferred way of using the tool) has many advantages with respect to local installation especially when the SCC is used within a coordinated lidar network as EARLINET. First of all it is possible to keep track of all the system configurations of all systems and also to certify which 5
configurations are quality assured. Moreover in this way it is always sure to use the same and the latest SCC version to produce optical products.
Particular attention has been addressed to the design of a suitable NetCDF structure for the SCC input file as it needs to fulfill the following constrains:
1. it should contain the raw lidar data as they are measured by the lidar detectors 10
(output voltages for analog lidar channels, counts for photoncounting channels) without any correction earlier applied by the user. This is particularly important to ensure the quality assurance of the final products: all the necessary instrumental corrections should be applied by the SCC using quality assured procedures. This is the reason for which a specific pre-processing SCC module has been devel-15
oped;
2. it should contain also additional input parameters needed for the analysis. As it will be explained in the next section the main part of the required input parameters are efficiently stored in a SCC database. However there are some parameters easily changing from measurement to measurement (for example electronic background 20
or laser shots) that cannot be usefully stored in a database. The only way to pass such kind of parameters to the SCC is via the input file. To improve the self-consistency of the SCC input file it has been allowed the option to include in the file also some important parameters already stored in the SCC database. In case these paramenters are found in the input file their value will be used in the 25
analysis;
AMTD
8, 4973–5023, 2015EARLINET Single Calculus Chain – general presentation
methodology and strategy
G. D’Amico et al.
Title Page
Abstract Introduction
Conclusions References
Tables Figures
◭ ◮
◭ ◮
Back Close
Full Screen / Esc
Printer-friendly Version
Interactive Discussion
Discussion
P
a
per
|
Discussion
P
a
per
|
Discussion
P
a
per
|
Discussion
P
a
per
|
section this is assured by the definition of unique channel IDs which identify the different lidar channels;
4. it should allow efficient data processing. As the SCC has been designed to be a multi-user tool it is important to improve the computational speed as much as possible to avoid long delay in getting the final products. This has been accom-5
plished putting in a single SCC input file the time-series of all the channels avail-able for a lidar configuration.
Finally concerning the NetCDF output file structure, as the SCC products need to be uploaded on EARLINET database, it is fully compliant with the structure of EAR-LINETeandbfiles. Theefiles contain the aerosol extinction profile and optionally the 10
Raman backscatter profile at the same effective vertical resolution. Thebfiles contain the elastic backscatter profile or alternatively the Raman backscatter profile at highest possible vertical resolution. More details about EARLINETeandbfile are provided in (Pappalardo et al., 2014; Earlinet, 2014).
3 SCC structure
15
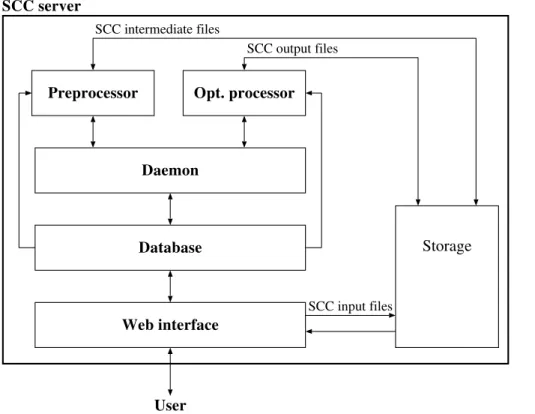
Figure 1 shows the general structure of the SCC which consists in several indepen-dent but inter-connected modules. Basically there is a module responsible for the pre-processing of raw lidar data, a module for the retrieval of the aerosol extinction and backscatter profiles, a daemon which automatically starts the pre-processing or the processing module when it is necessary, a database to collect all the input parameters 20
need for the analysis and finally a web interface. Once the new raw data file is submitted to the SCC via the web interface, the deamon automatically starts the pre-processing module and in succession the processing module. The status of the analysis in each step can be monitored using the web interface and both the pre-processed or the opti-cal results can be downloaded.
AMTD
8, 4973–5023, 2015EARLINET Single Calculus Chain – general presentation
methodology and strategy
G. D’Amico et al.
Title Page
Abstract Introduction
Conclusions References
Tables Figures
◭ ◮
◭ ◮
Back Close
Full Screen / Esc
Printer-friendly Version
Interactive Discussion
Discussion
P
a
per
|
Discussion
P
a
per
|
Discussion
P
a
per
|
Discussion
P
a
per
|
3.1 SCC database
The retrievals of aerosol optical products from lidar signals require a lot of input pa-rameters to be used in both pre-processing and processing phase. Two different types of such kind of parameters are needed: experimental which are mainly used to cor-rect instrumental effects and configurational which define the way to apply a partic-5
ular analysis procedure. An example of experimental parameter is the dead time of a photoncounting system. Once measured, the value of the dead time for a particular photoncounting lidar channel can be included in the database among the other pa-rameters that characterize the channel and, consequently, will be used to correct the corresponding raw lidar data. The dead time is an example of an experimental param-10
eter that in general changes from channel to channel. There are other experimental parameters which may be shared by multiple channels like for example telescope or laser characteristics (usually several lidar channels share the same laser or the same telescope).
Configuration parameters are the ones used to identify which algorithm, among the 15
implemented ones, has to be used to calculate a particular product. In general, in the SCC there are multiple quality assured algorithms to calculate a particular aerosol product. For example for the aerosol elastic backscatter both the iterative (Di Girolamo et al., 1995) and the Klett method (Klett, 1981, 1985; Fernald, 1984) have been im-plemented. The user can choose which one use for his data setting a correspondent 20
parameters in the database.
In general, both configuration and experimental parameters can change from one lidar system to another and, even for the same lidar system, they can change for the different configurations under which the lidar can run. For example a lidar that in night-time configuration can deliver aerosol extinction and Raman backscatter in daynight-time 25
AMTD
8, 4973–5023, 2015EARLINET Single Calculus Chain – general presentation
methodology and strategy
G. D’Amico et al.
Title Page
Abstract Introduction
Conclusions References
Tables Figures
◭ ◮
◭ ◮
Back Close
Full Screen / Esc
Printer-friendly Version
Interactive Discussion
Discussion
P
a
per
|
Discussion
P
a
per
|
Discussion
P
a
per
|
Discussion
P
a
per
|
In this complex context, a relational database represents an optimal solution to han-dle, in an efficient way, all this information. For this reason, a SCC database has been implemented to store the input parameters for all the EARLINET systems and, at the same time, to get the subset of all the parameters associated to a particular lidar config-uration. A multiple tables MySQL database has been used to make the SCC database. 5
All the software needed to run and configure a MySQL databases is free available over internet and the whole project is based on an open-source project.
In the SCC database, the experimental parameters are grouped in terms of stations, lidar configurations and lidar channels. All the EARLINET stations are registered in the SCC database and are univocally identified by a 2-character code (for exampleat
10
identifies the EARLINET station of Athens). Each station is then linked to one or more lidar configurations which in turns are linked to one or more lidar channels. Unique numerical IDs are associated to each lidar configuration and to each lidar channel. In this way, with specific database query, it is possible to easily get, for a particular lidar station, any detail of all the available lidar configurations running at that site or any 15
information for all the channel IDs belonging the each lidar configuration (for example the geographical coordinates at which the lidar is running or the wavelengths of all the lidar channels).
Each lidar configuration is associated to a set of products that the SCC should calcu-late. Basically all the SCC configuration parameters are linked to the product IDs. Each 20
product is linked to a product type (for example aerosol extinction, Raman backscat-ter, . . . ) to a set of channel IDs needed to calculate the products and to an usecase that, as it will be explained later, represents the way to calculate the product. More-over, for a particular product, it is possible to fix a set of configuration parameters like for example the pre-processing vertical resolution, the Raman backscatter calibration 25
method, the maximum statistical error we would like to have on the final products and so on.
AMTD
8, 4973–5023, 2015EARLINET Single Calculus Chain – general presentation
methodology and strategy
G. D’Amico et al.
Title Page
Abstract Introduction
Conclusions References
Tables Figures
◭ ◮
◭ ◮
Back Close
Full Screen / Esc
Printer-friendly Version
Interactive Discussion
Discussion
P
a
per
|
Discussion
P
a
per
|
Discussion
P
a
per
|
Discussion
P
a
per
|
measurement session. The measurement ID is then linked to the lidar configuration at which the measurement refers to and to the SCC input file containing the data to analyze.
A so structured database allows us to keep track of all the information used to gen-erate a particular SCC product. For each product, for example, it is possible to get 5
the measurements date and the list of channel IDs used for its calculation. If all those channel IDs at measurement time have passed all the required instrumental quality checks the corresponding product can be considered quality assured. This is a funda-mental point in order to implement a reliable and rigorous quality assurance program at network level.
10
3.2 Pre-processor module (ELPP: Earlinet Lidar Pre-Processor)
This module implements all the corrections to be applied to the raw lidar signals be-fore they can be used to derive optical properties. As the details of this module are described in (D’Amico et al., 2015) here just the main characteristics will be reported.
The main reason for which we implemented a pre-processor module along with a op-15
tical processing module is that the EARLINET quality assurance program does not ap-ply only to the retrieval of aerosol optical properties but also to the procedures needed to correct for instrumental effects. Moreover handling with the really raw data it is pos-sible to identify problems in lidar signals that could be not so evident in already pre-processed signals. The raw lidar signals have to be submitted in a NetCDF format with 20
a well-defined structure (D’Amico et al., 2015). In particular the raw lidar data should consist in the signal as detected by the lidar detectors. In case of analog detection mode the signal should be provided in mV while for photoncounting mode it should be expressed in pure counts. According to the specific lidar system and to the input parameters defined both in the SCC database configuration and in the NetCDF input 25
AMTD
8, 4973–5023, 2015EARLINET Single Calculus Chain – general presentation
methodology and strategy
G. D’Amico et al.
Title Page
Abstract Introduction
Conclusions References
Tables Figures
◭ ◮
◭ ◮
Back Close
Full Screen / Esc
Printer-friendly Version
Interactive Discussion
Discussion
P
a
per
|
Discussion
P
a
per
|
Discussion
P
a
per
|
Discussion
P
a
per
|
complete description of all these corrections are reported in (D’Amico et al., 2015), here we just report a list of the most common: dead-time correction, trigger-delay cor-rection, overlap corcor-rection, background subtraction (both atmospheric and electronic). Beside to these corrections the pre-processor module is also responsible to gener-ate the molecular signal needed to calculgener-ate the aerosol optical products. This can be 5
done using standard atmosphere model or correlative radiosounding profile. Finally the pre-processor module implements low- and high-range automatic signal gluing, verti-cal interpolation, time averaging and statistiverti-cal uncertainty propagation. The outputs of the pre-processor module are intermediate pre-processed NetCDF files which will be the input files for the optical processor module. These files contain the range corrected 10
pre-processed lidar signals and the corresponding molecular atmospheric profiles. As these quantities can be used in many different fields of application (quick-look gener-ation, model assimilgener-ation, inter-comparison campaigns) the intermediate NetCDF files can be considered an additional not calibrated products provided by the SCC.
3.3 Optical processor module (ELDA: Earlinet Lidar Data Analyzer)
15
ELDA applies to the pre-processed signals, produced by the pre-processor module, the algorithms for the retrieval of aerosol optical parameters. All the details of ELDA module are provided in (Mattis et al., 2015). Only a very brief overview of its main func-tionalities is provided here. ELDA module can provide aerosol products in a flexible way choosing from a set of possible pre-defined analysis procedures (usecases). ELDA im-20
plements retrieval of elastic aerosol backscatter profile using both Klett method (Klett, 1981; Fernald, 1984) and iterative algorithm (Di Girolamo et al., 1995), retrieval of aerosol extinction profile (Ansmann et al., 1990) and finally retrieval of Raman aerosol backscatter profile (Ansmann et al., 1992). An automatic vertical-smoothing and time-averaging technique selects the optimal smoothing level as a function of altitude on 25
AMTD
8, 4973–5023, 2015EARLINET Single Calculus Chain – general presentation
methodology and strategy
G. D’Amico et al.
Title Page
Abstract Introduction
Conclusions References
Tables Figures
◭ ◮
◭ ◮
Back Close
Full Screen / Esc
Printer-friendly Version
Interactive Discussion
Discussion
P
a
per
|
Discussion
P
a
per
|
Discussion
P
a
per
|
Discussion
P
a
per
|
3.4 Usecase
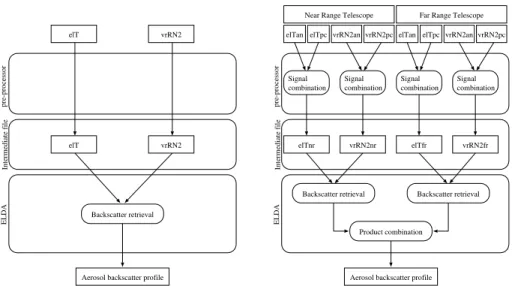
To improve the flexibility of the SCC the concept ofusecasehas been introduced. The SCC uses the usecases to adapt the analysis of lidar signal to a specific lidar con-figuration. Each usecase identifies a particular way to handle lidar data. An example on how the usecase are defined is illustrated in Fig. 2. In the left part of the figure it 5
is schematically shown the usecase 0 for the aerosol Raman backscatter calculation. This usecase refers to a basic Raman lidar configuration where only an elastic signal (elT) and the corresponding vibrational-rotational N2Raman one (vrRN2) are detected. These two signals are preprocessed by the SCC pre-processor module and then the results are saved in a NetCDF intermediate file. Then ELDA module gets the prepro-10
cessed signals and delivers as final result the aerosol Raman backscatter profile. In the right part of Fig. 2 it is reported a more complex usecase (the usecase 13) for aeorol Raman backscatter calculation which corresponds to a lidar system which uses two different telescopes: one optimized to detect the signal backscattered by the near range atmospheric region and an other one optimized to detect the atmospheric signal 15
by the far range. Moreover for both these telescopes the elastic and the ro-vibrational N2 Raman channels are detected in analog and photoconting mode. In this case, the SCC should combine 8 raw signals to get an unique aerosol Raman backscatter pro-file. Looking at the Fig. 2 we can see the details of this combination for the usecase 13. First the analog and the corresponding photoncounting signals are combined by the 20
pre-processor module. In this way in the intermediate NetCDF file there are 4 signals which represent the combined (analog and photoncounting) elastic and ro-vibrational N2 Raman channels detected by the near range and far range telescope. The ELDA module combines these 4 pre-processed signals retrieving two different aerosol Ra-man backscatter profiles (one for the near range and the other for the far range) and 25
AMTD
8, 4973–5023, 2015EARLINET Single Calculus Chain – general presentation
methodology and strategy
G. D’Amico et al.
Title Page
Abstract Introduction
Conclusions References
Tables Figures
◭ ◮
◭ ◮
Back Close
Full Screen / Esc
Printer-friendly Version
Interactive Discussion
Discussion
P
a
per
|
Discussion
P
a
per
|
Discussion
P
a
per
|
Discussion
P
a
per
|
A total of 34 different usecases have been defined and implemented within the SCC for the calculation of all the optical products. A schematic description of all the imple-mented usecases is provided in the Appendix. This set of usecases assures all the different EARLINET lidar setups can be processed by the SCC. Moreover we may have further flexibility choosing among the different usecases compatible for a fixed 5
lidar configuration.
Finally the concept of usecase improves also the expandability of the SCC: to imple-ment in the SCC a new lidar configuration it is enough to impleimple-ment a new usecase if the ones already defined are not compatible with it.
3.5 SCC daemon module
10
The SCC database, the ELPP and ELDA modules are well separated objects that need to act in a coordinated and synchronized way. When a measurements is submitted to the SCC a new entry is created in the SCC database. As soon as this operation is completed the pre-processing module should be started on the submitted measure-ments. As soon as there are pre-processed data available, the ELDA modules should 15
be started on them to get the aerosol optical products. All these operations are per-formed by the module SCC daemon. The SCC daemon is a multithread process run-ning continuously in the background and it is responsible to start thread instances for the pre-processor or the optical processor module when it is necessary. Another im-portant function of the SCC daemon is to monitor the status of started modules and to 20
track the corresponding exit status in the SCC database. In this way the user can be informed about the success or the failure of the SCC on the submitted measurement with detailed and specific error messages. It is also possible to define timeout periods after which started modules should be forced to stop.
As the SCC is mainly designed to be run on a single server where multiple users can 25
AMTD
8, 4973–5023, 2015EARLINET Single Calculus Chain – general presentation
methodology and strategy
G. D’Amico et al.
Title Page
Abstract Introduction
Conclusions References
Tables Figures
◭ ◮
◭ ◮
Back Close
Full Screen / Esc
Printer-friendly Version
Interactive Discussion
Discussion
P
a
per
|
Discussion
P
a
per
|
Discussion
P
a
per
|
Discussion
P
a
per
|
daemon has an high configurable multithread mode to adapt itself to the hardware resources available on the hosting server.
3.6 Web interface
This module represents the interface between the end-user and the SCC. In particular, to use the SCC, the user needs to interact only with the SCC database as the calculus 5
modules ELPP and and ELDA are automatically started by the SCC daemon that in turns gets and provides info to the SCC database. Therefore, the web interface is an user-friendly way to interact with the SCC database using any of available web browsers. Using the web interface it is possible to:
1. change or visualize all the input parameters for a particular lidar system or add 10
a new system;
2. upload data to the SCC server and register the measurements in the SCC database. Along with raw lidar data it is possible also to upload ancillary files like for example correlative sounding profile and overlap correction function which can be used in the analysis. All these files should be in NetCDF format with a well-15
defined structure. The interface does not allow to upload on the server files in wrong format or not compliant with the defined structure;
3. visualize the status of the SCC analysis. In case of failure a specific error message is shown in a way the user can easily figure out the reason of failure;
4. download the pre-processing or the optical products from the server. In particular, 20
it is possible to visualize the calculated profile of aerosol optical products;
5. restart the SCC on an already analyzed measurement.
AMTD
8, 4973–5023, 2015EARLINET Single Calculus Chain – general presentation
methodology and strategy
G. D’Amico et al.
Title Page
Abstract Introduction
Conclusions References
Tables Figures
◭ ◮
◭ ◮
Back Close
Full Screen / Esc
Printer-friendly Version
Interactive Discussion
Discussion
P
a
per
|
Discussion
P
a
per
|
Discussion
P
a
per
|
Discussion
P
a
per
|
a different lidar station. It is also possible, for example, to define users that can only perform analysis and cannot change input parameters.
Moreover the processing status of each measurement can be also monitored using a web API (Applications programming interface). Using this API, the SCC can be tightly integrated to each stations processing system making the process of submission of the 5
raw data and the corresponding analysis fully automatic.
Finally, using the web interface it is possible to have access to an EARLINET Hand-book of Instrument (HOI) where all the instrumental characteristics of the lidar systems registered in the SCC database are reported. The main goal of the HOI is to collect all the characteristics of all EARLINET lidar systems and to make this information available 10
for the end-user in an efficient and user-friendly way. For this reason the information in the HOI is grouped in terms of the different subsystems that a complete lidar sys-tem has: laser source, telescope, spectral separation, acquisition syssys-tem. Additional information concerning the station running the lidar system is also provided. Moreover as usually the lidar systems can be updated over the time any change is tracked and 15
visible in the HOI.
4 Validation
A validation strategy to prove whether SCC can provide quality assured aerosol optical products has been implemented. The performances of the SCC have been evaulated on both synthetic and real lidar data.
20
As first step, the SCC has been tested on the synthetic lidar signals used during the algorithm inter-comparison exercise performed in the framework of the EARLINET-ASOS project (Pappalardo et al., 2004). This set of synthetic signals was simulated with really realistic experimental and atmospheric conditions to test the performances of specific algorithms for the retrieval of aerosol extinction, backscatter and lidar ratio. 25
AMTD
8, 4973–5023, 2015EARLINET Single Calculus Chain – general presentation
methodology and strategy
G. D’Amico et al.
Title Page
Abstract Introduction
Conclusions References
Tables Figures
◭ ◮
◭ ◮
Back Close
Full Screen / Esc
Printer-friendly Version
Interactive Discussion
Discussion
P
a
per
|
Discussion
P
a
per
|
Discussion
P
a
per
|
Discussion
P
a
per
|
As the details of this exercise are provided in (Mattis et al., 2015) we just mention here that all the algorithms implemented within the SCC produce profiles that agree with the solutions within the statistical uncertainties.
As second validation level, we have evaluated the SCC performances when it is ap-plied on real lidar data comparing the optical products calculated by the SCC with the 5
corresponding optical products generated by the analysis software developed by diff er-ent EARLINET lidar groups. This comparison has been performed using two different approaches. First we compared the analysis obtained by the lidar measurements taken by several lidar systems measuring in the same place at the same time. In this way we can check the ability of the SCC to adapt itself to analyze data coming from different 10
lidar systems in the same atmospheric conditions. Secondly we have compared the mean profiles which were obtained from profiles measured by two EARLINET stations over several months at the same place. This kind of test is devoted to evaluate possible biases in the SCC analysis not visible comparing the analysis in one single case.
4.1 Single profiles validation
15
The EARLI09 (EArlinet Reference Lidar Intercomparison 2009) measurement cam-paign held in Leipzig, Germany, in May 2009 (Freudenthaler et al., 2010; Wandinger et al., 2015) gave us the possibility to test the SCC on the measurements taken by dif-ferent lidar systems in the same atmospheric conditions. Eleven lidar systems from ten different EARLINET stations performed one month of co-located, coordinated mea-20
surements under different meteorological conditions. During the campaign the SCC pre-processor module was successfully used to provide, in a very short time, sig-nals corrected for instrumental effects for all the participating lidar systems (Wandinger et al., 2015). In this way, all the signals were pre-processed with the same procedures and consequently discrepancies among pre-processed signals could be due only to 25
unwanted or unknown system effects.
AMTD
8, 4973–5023, 2015EARLINET Single Calculus Chain – general presentation
methodology and strategy
G. D’Amico et al.
Title Page
Abstract Introduction
Conclusions References
Tables Figures
◭ ◮
◭ ◮
Back Close
Full Screen / Esc
Printer-friendly Version
Interactive Discussion
Discussion
P
a
per
|
Discussion
P
a
per
|
Discussion
P
a
per
|
Discussion
P
a
per
|
were selected characterized by data availability from all the participating systems. All the participants were asked to produce their own analysis for these cases allowing us to compare with the corresponding results of the SCC. The cases differ in terms of atmospheric conditions and refer to both nighttime and daytime measurements.
For the SCC validation we focus on the case of 25 May 2009 from 21:00 to 23:00 UT 5
when a Saharan dust event was occurring over Leipzig. Moreover, to allow an eval-uation of the SCC retrieval algorithms as complete as possible we first selected only the EARLI09 lidar systems able to measure at same time aerosol backscatter profiles at 3 wavelengths (1064, 532 and 355 nm) and 2 aerosol extinction profile at 532 and 355 nm. Among these advanced systems, we made a further selection on the base 10
of their differences in terms of technical characteristics. In particular we considered the Multiwavelength Raman Lidar – RALI from Bucharest station (Nemuc et al., 2013) as an example of commercial system; the MARTHA sytem from Leipzig station as an example of home made lidar (Mattis et al., 2004); the PollyXT from Leipzig station as representative of the PollyNetnetwork (Althausen et al., 2013); the CIS-LiNet (Lidar Net-15
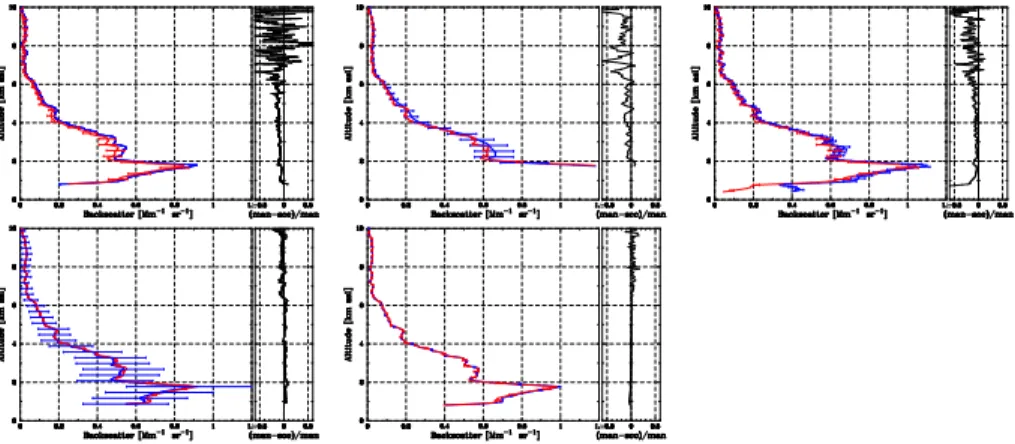
work for CIS countries) (Chaikovsky et al., 2006) reference system MSTL-2 from Minsk station and finally the MUSA (MUlti-wavelength lidar System for Aerosol) from Potenza station as an example of EARLINET network reference system (Madonna et al., 2011). Figure 3 shows the aerosol elastic-backscatter profiles at 1064 nm obtained from the infrared elastic-backscatter signals measured by the five lidar systems mentioned 20
above. The profiles obtained by the SCC are plotted in red while in blue are reported the corresponding profiles provided by each group with its own analysis software. The same color convention will be valid for all the other figures in this paper. The agreement between the two analysis is in general good for all the lidar systems indicating the good performances of the algorithm for the retrieval of the elastic aerosol backscatter 25
AMTD
8, 4973–5023, 2015EARLINET Single Calculus Chain – general presentation
methodology and strategy
G. D’Amico et al.
Title Page
Abstract Introduction
Conclusions References
Tables Figures
◭ ◮
◭ ◮
Back Close
Full Screen / Esc
Printer-friendly Version
Interactive Discussion
Discussion
P
a
per
|
Discussion
P
a
per
|
Discussion
P
a
per
|
Discussion
P
a
per
|
Only for the leftmost plot on the top it is possible to see small discrepancies which are probably due to slightly different calibration input parameters as the infrared wavelength is quite sensible to calibration procedure (Engelmann et al., 2015).
The Raman backscatter profiles at 355 nm (at 532 nm) from the same lidar systems are shown in Fig. 4 (Fig. 5); the profiles are calculated combining the elastic signal at 5
355 nm (532 nm) with the nitrogen vibration-rotation Raman signal at 387 nm (607 nm). The manually obtained profiles agree quite well with the corresponding SCC ones con-sidering the reported error bars. The residual discrepancies can be explained by small differences in the used reference value and height for the calibration and also by the depolarization correction which is taken into account in some of the manual analyses 10
but not yet implemented in the SCC. This is for example the case of the differences be-tween 2 and 4 km of the two rightmost plots on the top of Fig. 4. These two plots refer to lidar systems equipped with optics with quite different trasmissitivy at 355 nm along the two components of the light polarization. If the depolarization correction is not con-sidered, this condition together with the presence of strong depolarizing aerosol (like 15
in this case where Saharan dust is present between 2 and 4 km) produces an over-stimation of the backscatter coefficient which is clearly visible in the two mentioned plots. This correction of the depolarization effect is not implemented in the SCC be-cause its application requires the measurements of the depolarization ratio that is not yet a standard SCC product.
20
Figures 6 and 7 are examples of comparisons of the Raman extinction retrieval. The curves in Fig. 6 are the aerosol extinction profiles at 355 nm obtained from the nitrogen vibration-rotation Raman signal at 387 nm for the five different lidar systems, while Fig. 7 shows the aerosol extinction profiles at 532 nm calculated from the nitro-gen vibration-rotation Raman signal at 607 nm for the same systems. The agreement 25
anal-AMTD
8, 4973–5023, 2015EARLINET Single Calculus Chain – general presentation
methodology and strategy
G. D’Amico et al.
Title Page
Abstract Introduction
Conclusions References
Tables Figures
◭ ◮
◭ ◮
Back Close
Full Screen / Esc
Printer-friendly Version
Interactive Discussion
Discussion
P
a
per
|
Discussion
P
a
per
|
Discussion
P
a
per
|
Discussion
P
a
per
|
ysis. Nevertheless, for all the systems the atmospheric structures are present with very similar and consistent shape in the manual and the SCC retrived profiles.
4.2 Mean profiles validation
In the previous section we have shown the comparisons of the SCC analysis with the corresponding manual ones for a single measurement case considering several 5
different lidar systems. This comparison allows us to investigate the ability of the SCC to provide aerosol optical products for different systems but it does not assure the algorithms implemented in the SCC are not affected by systematic errors or that they work well under different atmospheric conditions. To prove this, mean SCC profiles have been compared to the corresponding mean profiles obtained by an independent 10
analysis procedure. In particular several measurement cases have been inverted with both the SCC and the manual analysis software. The results have been averaged and finally compared. Two representative EARLINET lidar systems have been taken into account for this comparison: MUSA (MUlti-wavelength lidar System for Aerosol) from Potenza station and PollyXTsystem operating at Leipzig station.
15
For Potenza station we have compared the mean profiles obtained by averaging the measurements made by MUSA system (Madonna et al., 2011) in correspondence of CALIPSO (Cloud-Aerosol Lidar and Infrared Pathfinder Satellite Observations) (Winker et al., 2007), overpasses between March 2010 and November 2011. In Table 1 are summarized the number of single profiles that have been considered in calculating the 20
mean profiles for both SCC and manual analysis. The quantity b1064 indicates the elastic backscatter profile at 1064 nm while b532 (b355) and e532 (e355) represent respectively the mean Raman or elastic backscatter and extinction profile at 532 nm (355 nm). The number of averaged profiles are not the same for all the averaged quan-tities as not for all the cases it is possible to get optical products for all the lidar chan-25
ex-AMTD
8, 4973–5023, 2015EARLINET Single Calculus Chain – general presentation
methodology and strategy
G. D’Amico et al.
Title Page
Abstract Introduction
Conclusions References
Tables Figures
◭ ◮
◭ ◮
Back Close
Full Screen / Esc
Printer-friendly Version
Interactive Discussion
Discussion
P
a
per
|
Discussion
P
a
per
|
Discussion
P
a
per
|
Discussion
P
a
per
|
tinction profiles available and the backscatter at all wavelengths are calculated using elastic-only techniques.
The Fig. 8 summarizes the result of the mean analysis comparison made in nighttime conditions. For each analysis 3 mean backscatter profiles are reported (first plot on the left) at 1064 nm (red curve), at 532 nm (green curve), and at 355 nm (blue curve) and 5
the 2 mean extinction profiles (second plot for the left) at 532 nm (green curve) and at 355 nm (blue curve). In the same figure other important aerosol parameters are plotted which are directly derived from the extinction and backscatter profiles: the extinction to backscatter ratio usually called lidar ratio and the Ångström coefficients. As it is well known that these parameters depend only on the type of aerosol, it is quite interesting 10
to test the SCC performance also on these parameters.
In general the agreement between the two analysis is good for all the profiles shown in Fig. 8. The Table 2 provides a more quantitative comparison. In particular two sep-arate altitude ranges were selected in order to allow direct comparison of statistical quantities. The first (Range 1) extends up to 2 km and the second one (Range 2) from 15
2 up to 4 km height. In both these ranges mean values and corresponding standard errors of all the vertical profiles plotted in Fig. 8 have been calculated.
In Fig. 9 the comparison for MUSA system in daytime condition is shown. As already mentioned in this case the 2 Raman channels are not available and so it is possible to compare only backscatter related quantities. As it can be seen from Table 2, where the 20
mean values in Range 1 and Range 2 are shown, also in daytime conditions we have a good agreement between the two analysis.
For the Leipzig station, we have compared all regular EARLINET climatology and CALIPSO measurements made by PollyXT from September 2012 to September 2014 for which the complete data set of 3 backscatter coefficient and, at nighttime, 2 extinc-25
tion coefficient profiles were available. The numbers of PollyXTsingle profiles that have been included in the calculation of mean profiles are reported in Table 1.
AMTD
8, 4973–5023, 2015EARLINET Single Calculus Chain – general presentation
methodology and strategy
G. D’Amico et al.
Title Page
Abstract Introduction
Conclusions References
Tables Figures
◭ ◮
◭ ◮
Back Close
Full Screen / Esc
Printer-friendly Version
Interactive Discussion
Discussion
P
a
per
|
Discussion
P
a
per
|
Discussion
P
a
per
|
Discussion
P
a
per
|
in these figures are the same already described for the Figs. 8 and 9. The agreement between the two analysis is good in both nighttime and daytime conditions. All the man-ual calculated profiles plotted in Figs. 10 and 11 look quite similar to the corresponding ones calculated by the SCC. Moreover the same quantitative comparison made for the Potenza MUSA system has been carried out also for PollyXT lidar. The results are 5
summarized in Table 3 that shows a very good agreenment of both mean values and standar errors calculated within the Range 1 and Range 2.
5 Example of applicability
In July 2012 eleven EARLINET stations performed an intense period of coordinated measurements with a well defined measurement protocol. The measurements started 10
on 9 July at 06:00 UT and continued uninterrupted for 72 h whenever the atmospheric conditions allow lidar measures. The details of this quite intensive observation period are provided in (Sicard et al., 2015). In this section the main objectives of this 72 h op-erationality excercise will be briefly recalled and some technical specific details about how the SCC has been used during that period will be provided. The main scope of the 15
72 h operationality exercise was to show the EARLINET capabilities to provide in near-real time a large set of aerosol parameters obtained in a standardized way for a large number of stations around the Mediterranean basin. In particular the SCC was used to retrieve both pre-processed products in real time (mainly range corrected lidar sig-nals) and optical processed products in near real time for all the stations participating 20
to the exercise. The outputs of the SCC produced in that way can be used for a large variety of applications like the assimilation of lidar data in air quality or dust transport models, models validation, monitoring of special events like volcano eruptions. In par-ticular the SCC pre-processed data measured during the 72 h operationality exercise have been succesfully assimilated in the air quality model Polyphemus developed by 25
AMTD
8, 4973–5023, 2015EARLINET Single Calculus Chain – general presentation
methodology and strategy
G. D’Amico et al.
Title Page
Abstract Introduction
Conclusions References
Tables Figures
◭ ◮
◭ ◮
Back Close
Full Screen / Esc
Printer-friendly Version
Interactive Discussion
Discussion
P
a
per
|
Discussion
P
a
per
|
Discussion
P
a
per
|
Discussion
P
a
per
|
All the participating stations agreed to provide raw data in SCC format containing 1 h timeseries of raw lidar signals each synchronized with the start of each hour. Starting from these raw data files the SCC was configured to provide 30 min time averaged range corrected signals (pre-processed files) for all the involved lidar systems. Dur-ing the exercise the SCC was an important step toward the standardization of lidar 5
products as the lidars participating operate at different raw time resolutions (from 1 to 5 min) and they also differ in many other characteristics requiring different instrumental corrections.
To make the SCC outputs available as soon as possible, an infrastructure was set up to automatically submit the data to the SCC. Usually to start the retrieval of the 10
SCC on a particular measurement the user needs to register the measurement into the SCC database using the web interface. This operation needs time and also the presence of an operator. To improve that, a fully automatic uploading system has been implemented and used during the 72 h measurement exercise. Once the system has detected the presence of a new measurement, a check on the format of the uploaded 15
datafile is automatically performed and in case of success the measurement is auto-matically registered to the SCC database and consequently the SCC is started on it. The results of the SCC analysis are sent back to the originator for their evaluation as soon as they are available. With such kind of system it was possible to automatically retrieve the needed aerosol products and make them available within 30 min from the 20
end of measurement.
6 Conclusions
The SCC, an automatic tool for the analysis of EARLINET lidar data has been devel-oped and made available to all the EARLINET stations. The SCC has been installed on a centralized server where the user can submit data using a pre-defined NetCDF 25
AMTD
8, 4973–5023, 2015EARLINET Single Calculus Chain – general presentation
methodology and strategy
G. D’Amico et al.
Title Page
Abstract Introduction
Conclusions References
Tables Figures
◭ ◮
◭ ◮
Back Close
Full Screen / Esc
Printer-friendly Version
Interactive Discussion
Discussion
P
a
per
|
Discussion
P
a
per
|
Discussion
P
a
per
|
Discussion
P
a
per
|
instrumental and configuration parameters to be used in the analysis. The products of the SCC are all quality certified in terms of EARLINET quality assurance program. The SCC can provide different levels of output: pre-processed signals, which are range corrected lidar signals corrected for all the instrumental effects, and aerosol optical products, which are aerosol backscatter or extinction profiles. The pre-processed and 5
the aerosol optical products are calculated by two different SCC modules: ELPP that accepts as input the raw lidar data and ELDA which takes as inputs the outputs of the ELPP module. The actions of the two modules are automatically synchronized and coordinated by an other module called SCC daemon. All the parameters required by ELPP and ELDA modules are stored in an efficient way in a SCC database.
10
The SCC has been validated comparing its optical products with the corresponding products retrieved with independent manual quality certified procedures. The validation has been carried out into two different steps. First, considering a case study selected from the EARLI09 inter-comparison campaign, it has been proved the SCC is able to provide optical products in good agreement with the corresponding manual analysis for 15
all the EARLI09 lidar system considered. Second, it has been checked the SCC can provide reliable results in different atmospheric conditions. This has been archieved comparing mean profiles obtained averaging several optical profiles for two EARLINET representative systems. Also in this case the comparisons indicate good performances of the SCC.
20
An example of the applicability of the SCC has been provided describing the use we made of the SCC during the 72 h EARLINET measurement exercise. In this case, the SCC has been used to provide high quality aerosol products at different levels (pre-processed signals or aerosol optical products) in near-real time. Such kind of aerosol products can be assimilated in models or can be used for model validation purposes 25
or to monitor special events at network level.
investiga-AMTD
8, 4973–5023, 2015EARLINET Single Calculus Chain – general presentation
methodology and strategy
G. D’Amico et al.
Title Page
Abstract Introduction
Conclusions References
Tables Figures
◭ ◮
◭ ◮
Back Close
Full Screen / Esc
Printer-friendly Version
Interactive Discussion
Discussion
P
a
per
|
Discussion
P
a
per
|
Discussion
P
a
per
|
Discussion
P
a
per
|
tion and will be included in the SCC in the framework of the ACTRIS (Aerosol, Clouds and Trace gases Research InfraStructure Network) project (http://www.actris.org). Due to its flexibility the SCC could be easily extended to GALION (GAW Aerosol LIdar Ob-servation Network) to evaluate lidar data of networks different from EARLINET.
Appendix: SCC Usecases description
5
In this Appendix all the usecases currently implemented in the SCC are reported schematically. A specific nomenclature has been used to identify univocally the dif-ferent types of lidar signals detected by all EARLINET lidars. In particular the name assigned to each lidar signal is composed by four different substrings separated by the character underscore. The first substring describes the scattering mode characterizing 10
the detected signal, the second identifies the polarization state, the third describes the detection mode used to measure the signal and finally the fourth identifies the range for which the signal is optimized. For example a channel called “elT_cross_pc_fr” rep-resents the photoncounting perpendicular polarization component (with respect to the direction of linear polarized incident laser light) of the elastic backscattered lidar signal 15
optimized (in terms of the signal to noise ratio) to detect the atmospheric signal from the far range. The Table A1 summarizes all the possible substrings used to identify the signals.
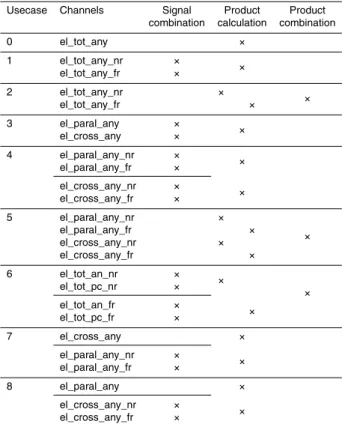
All the implemented usecases, separated by product type, are reported in the Ta-bles A2–A4 using the same structure. The first column gives the number identifying 20
the usecase. This number identify univocally the usecase once a product type has be selected. The second column reports all the lidar channels involved in the product calculation. This information allows us the identification of the relevant usecases fit-ting with one specific experimental setup. The other columns specify the steps to be performed in the calculation of the product. The third column shows which channels 25
op-AMTD
8, 4973–5023, 2015EARLINET Single Calculus Chain – general presentation
methodology and strategy
G. D’Amico et al.
Title Page
Abstract Introduction
Conclusions References
Tables Figures
◭ ◮
◭ ◮
Back Close
Full Screen / Esc
Printer-friendly Version
Interactive Discussion
Discussion
P
a
per
|
Discussion
P
a
per
|
Discussion
P
a
per
|
Discussion
P
a
per
|
timized for the low range. The fourth column specifies which pre-processed signals are used to calculate the corresponding optical product. If in this column it is present only one subcolumn (like for example the usecase 7 in Table A2) it means the final product is directly calculated using the selected pre-processed signal. If there are two subcolumns (like for example the usecase 4 in Table A2) two products are calculated 5
in the processing phase (typically one for the far range and one for the low range) and then these products are combined together to get the final product. The presence of product combination in the usecase is specified by the last column of the tables. It is worth mentioning that to each usecase correponds always a single optical product.
Acknowledgements. The financial support by the European Commission grants RICA-025991
10
EARLINET-ASOS and 262254 ACTRIS is gratefully acknowledged. Ioannis Binietoglou would like to acknowledge funding received from the European Union’s Seventh Framework Pro-gramme for research, technological development and demonstration under grand agreement no 289923 – ITaRS.
References
15
Ackermann, J.: The extinction-to-backscattering ratio of tropospheric aerosol: a numerical study, J. Atmos. Ocean. Tech., 15, 1043–1050, 1998. 4978
Althausen, D., Engelmann, R., Baars, H., Heese, B., Kanitz, T., Komppula, M., Giannakaki, E., Pfüller, A., Silva, A. M., Preißler, I., Wagner, F., Rascado, J. L., Pereira, S., Lim, J., Ahn, J. Y., Tesche, M., and Stachlewska, I. S.: PollyNET: a network of multiwavelength polarization
20
Raman lidars, in: Proceedings of SPIE 8894, Lidar Technologies, Techniques, and Measure-ments for Atmospheric Remote Sensing IX, 2013. 4991
Ansmann, A., Riebesell, M., and Weitcamp, C.: Measurement of atmospheric aerosol extinction profiles with a Raman lidar, Opt. Lett., 15, 746–748, 1990. 4985
Ansmann, A., Riebesell, M., Wandinger, U., Weitcamp, C., Voss, E., Lahmann, W., and
25
Michaelis, W.: Combined Raman elastic-backscatter lidar for vertical profiling of moisture, aerosol extinction, backscatter and lidar ratio, Appl. Phys. B, 55, 18–28, 1992. 4985