www.atmos-chem-phys.net/16/2341/2016/ doi:10.5194/acp-16-2341-2016
© Author(s) 2016. CC Attribution 3.0 License.
CALIPSO climatological products: evaluation and suggestions
from EARLINET
Nikolaos Papagiannopoulos1, Lucia Mona1, Lucas Alados-Arboledas2,3, Vassilis Amiridis4, Holger Baars5, Ioannis Binietoglou6, Daniele Bortoli7, Giuseppe D’Amico1, Aldo Giunta1, Juan Luis Guerrero-Rascado2,3, Anja Schwarz5, Sergio Pereira7, Nicola Spinelli8,9, Ulla Wandinger5, Xuan Wang8,10, and Gelsomina Pappalardo1 1Consiglio Nazionale delle Ricerche, Istituto di Metodologie per l’Analisi Ambientale (CNR-IMAA), C. da S. Loja, Tito Scalo (PZ), 85050, Italy
2Instituto Interuniversitario de Investigación del Sistema Tierra en Andalucía (IISTA-CEAMA), Av. del Mediterráneo, 18006, Granada, Spain
3Dpto. Física Aplicada, Universidad de Granada, Fuentenueva s/n, 18071, Granada, España 4IAASARS, National Observatory of Athens, Athens, Greece
5Leibniz Institute for Tropospheric Research (TROPOS), Leipzig, Germany 6National Institute of R&D for Optoelectronics (INOE), Magurele, Romania 7Earth Science Institute – (ICT), Évora, Portugal
8Consorzio Nazionale Interuniversitario per le Scienze Fisiche della Materia (CNISM), Naples Research Unit, Naples, Italy 9Dipartimento di Fisica, Università di Napoli Federico II, Naples, Italy
10Consiglio Nazionale delle Ricerche, Superconductors, oxides and other innovative materials and devices (CNR-SPIN), Naples, Italy
Correspondence to:Nikolaos Papagiannopoulos ([email protected])
Received: 23 October 2015 – Published in Atmos. Chem. Phys. Discuss.: 6 November 2015 Revised: 12 February 2016 – Accepted: 15 February 2016 – Published: 29 February 2016
Abstract.The CALIPSO Level 3 (CL3) product is the most recent data set produced by the observations of the Cloud– Aerosol Lidar with Orthogonal Polarization (CALIOP) in-strument onboard the Cloud–Aerosol Lidar and Pathfinder Satellite Observations (CALIPSO) space platform. The Eu-ropean Aerosol Research Lidar Network (EARLINET), based mainly on multi-wavelength Raman lidar systems, is the most appropriate ground-based reference for CALIPSO calibration/validation studies on a continental scale. In this work, CALIPSO data are compared against EARLINET monthly averaged profiles obtained by measurements per-formed during CALIPSO overpasses. In order to mitigate un-certainties due to spatial and temporal differences, we repro-duce a modified version of CL3 data starting from CALIPSO Level 2 (CL2) data. The spatial resolution is finer and nearly 2◦×2◦ (latitude×longitude) and only simultaneous mea-surements are used for ease of comparison. The CALIPSO monthly mean profiles following this approach are called CALIPSO Level 3∗, CL3∗. We find good agreement on the
1 Introduction
The NASA-CALIPSO (Cloud–Aerosol Lidar with Orthogo-nal Polarization) mission offers unprecedented observations of aerosol global optical properties profiles (Winker et al., 2010), vital for aerosol–radiation–cloud interaction studies to understand their climatic role. The most recent CALIPSO satellite data product, the so-called CL3 aims to provide a climatology of the global aerosol distribution including seasonal and interannual variations. The product consists of monthly gridded extinction profiles separated into a daytime and nighttime segment. According to the study of Winker et al. (2013), the CL3 data appear to be realistic and very well capture the most important aerosol transport pathways, such as the westward motion of dust particles originating from the Sahara Desert, or the smoke-laden plumes in the South At-lantic due to the African biomass burning season.
As with any satellite product, it is important to quantita-tively evaluate the accuracy of CALIPSO retrievals in com-parison with independent measurements. CALIPSO products have been extensively evaluated using columnar aerosol opti-cal depth (AOD) data sets from passive spaceborne measure-ments (e.g., Kittaka et al., 2011; Redemann et al., 2012; Kim et al., 2013) or the well-established AERONET (Aerosol Robotic Network) measurements (e.g., Schuster et al., 2012; Omar et al., 2013). However, CALIOP, onboard CALIPSO, is firstly and foremost a profiling instrument; therefore it is particularly interesting to compare with ground-based profil-ing data. EARLINET (the European Aerosol Research Net-work) is playing an important role in the validation and full exploitation of the lidar data that CALIPSO continuously provides since April 2006. In the frame of the network, sev-eral studies have investigated the CALIPSO Level 1 products (e.g., Mamouri et al., 2009; Mona et al., 2009). Pappalardo et al. (2010), and Wandinger et al. (2011) also provided val-idation efforts of the CALIPSO Level 2 aerosol backscatter and extinction profiles, showing promising results.
Currently, EARLINET space-related activities focus on the CALIPSO mission, but nonetheless the network’s goal is the provision of a long-term ground-based support for the spaceborne lidar in order to homogenize observations ob-tained with different instruments. The planned ESA (Euro-pean Space Agency) ADM-Aeolus (Atmospheric Dynam-ics Mission – Aeolus; Stoffelen et al., 2005) and the joint ESA/JAXA (Japan Aerospace Exploration Agency) Earth-CARE (Earth, Clouds, Aerosols and Radiation Explorer; Illingworth et al., 2015) missions will succeed CALIPSO in observing aerosols and clouds with active remote sens-ing techniques. The Atmospheric Doppler Lidar Instrument (ALADIN) onboard ADM-Aeolus and the Atmospheric Li-dar (ATLID) of the EarthCARE satellite will make use of the high-spectral-resolution-lidar (HSRL) technique in the UV. In addition to the differences in the techniques em-ployed in relation to CALIOP, the ALADIN and ATLID will operate at different wavelengths and will deliver extinction
and backscatter coefficient profiles, independently retrieved. EARLINET aims to contribute also to the homogenization of the current and future spaceborne lidar data sets by de-livering aerosol and cloud-type-dependent wavelength con-version factors. These parameters will facilitate the develop-ment of a multi-decadal vertical structure profile climatology (Amiridis et al., 2015).
So far, few studies about the CL3 data set have been pub-lished. Winker et al. (2013) have compared the extinction values retrieved by CALIOP against the simultaneous mea-surements of the HSRL lidar onboard NASA B200 aircraft during CALIPSO underflights (Burton et al., 2012). This comparison showed that the CALIOP retrieval in the up-per troposphere are underestimated due to the instrument de-tection limits and to the decreasing aerosol load. Next, Ma et al. (2013) compared CL3 AOD against MODIS (Moderate Resolution Imaging Spectroradiometer) and found that CL3 demonstrated good seasonal variability and in overall lower AOD values. Further, the study showed significantly lower values for CALIPSO compared to MODIS over deserts, with maximum difference of 0.3 over the Sahara Desert, and the opposite when biomass burning particles are prevalent, with maximum difference of 0.25 over South Africa. Owing to the varying properties of dust on the lidar ratio, Amiridis et al. (2013) examined the potential improvement of CL3 when introducing a new value of lidar ratio for the dust. The in-creased agreement of CL3 when compared to multi-platform and dust model products highlighted the improvement of the dust extinction retrieval.
CL3 comparison (not reported) that could be attributed to spatial variability over the CL3 grid box.
The data and methodology are presented in Sect. 2. The results are reported and discussed in Sect. 3. Specifically, Sects. 3.1 and 3.2 focus on the comparison of the extinc-tion coefficient, backscatter coefficient, and lidar ratio pro-files for each station; further aerosol typing data are also in-tercompared. In Sect. 3.3, the mean EARLINET type-related lidar ratio values are confronted with the CALIPSO modeled values. Additionally, it explores instead the effect of the ex-tinction retrieval optimization by using the EARLINET esti-mated lidar ratio values. Finally, Sect. 4 closes with our con-clusions.
2 Data 2.1 CALIPSO
CALIPSO is a joint NASA/CNES (Centre National d’Études Spatiales) satellite designed to study aerosols and clouds. Its aim is to provide profiling information at a global scale for improving our knowledge and understanding the role of the aerosol in the atmospheric processes. The main instrument, CALIOP, is a dual-wavelength (532 and 1064 nm) elastic backscatter lidar with the capability of polarization-sensitive observations at 532 nm (Winker et al., 2006, 2007). The high-resolution profiling ability coupled with accurate depolariza-tion measurements make CALIPSO an indispensable tool to monitor dust aerosols (Liu et al., 2008). The optical proper-ties retrieval is based on the successful cooperation of three modules, that have the main goal to produce the CL2 data. The first module identifies the features within the lidar sig-nals (aerosol, cloud, surface returns; Vaughan et al., 2009). Afterwards, this information is passed to the second mod-ule, to determine the type of each feature (i.e., cloud, aerosol, surface, or stratospheric; Liu et al., 2009). Given this selec-tion, the module can type further those identified aerosol layers (i.e., clean marine, dust, polluted continental, clean continental, polluted dust, smoke; Omar et al., 2009), a pro-cedure which is called the aerosol subtyping. In this stage, also, CALIOP determines the cloud phase (Hu et al., 2007, 2009). Finally, the third module retrieves aerosol extinction and backscatter profiles assuming lidar ratio values accord-ing to subtypaccord-ing (Young and Vaughan, 2009).
The climatological CL3 product is a monthly gridded data set consisting of CL2 data. The main outputs are the aerosol extinction coefficient at 532 nm and mean column aerosol optical depth (AOD). The CL3 product, in which the CL2-532 nm aerosol extinction product is aggregated, are mapped onto a global 2◦×5◦latitude–longitude grid. The output altitude ranges from −0.5 to 12 km above mean sea level with a vertical resolution of 60 m. CALIOP retrieves aerosol below optically thin clouds, in clear skies and above clouds. Monthly mean-extinction profiles are computed for
four conditions: all-sky, cloud-free, above clouds and com-bined (cloud-free and above clouds). In addition, several quality control flags contained in the CL2 files are used to screen the data prior to averaging. A detailed summary of the methodology used for the generation of the CL3 product is provided in the Appendix of Winker et al. (2013). 2.2 EARLINET
EARLINET was established in 2000 (Pappalardo et al., 2014; https://earlinet.org) as a research project, providing data concerning the aerosol vertical distribution on a con-tinental scale. Currently, 27 active stations participate in the network. The contributing stations have been performing cor-relative measurements since CALIPSO started its life cycle, based on a schedule established before the satellite mission. EARLINET has been an important contributor to CALIPSO validation studies (e.g., Mamouri et al., 2009; Mona et al., 2009; Pappalardo et al., 2010; Perrone and Bergamo, 2011; Wandinger et al., 2011; Amiridis et al., 2013). The strategy followed by the member stations is as follows: the observa-tions occur during the satellite overflight within 100 km dis-tance of the satellite ground-track from the station, and are performed for at least 60 min. In this kind of measurement, the atmospheric variability both in time and space is a fun-damental point. The impact of the distance on EARLINET– CALIPSO comparison was investigated for different stations in devoted papers (e.g., Mamouri et al., 2009; Mona et al., 2009). At network level we found that at distance below 100 km the discrepancies in the signal (CALIPSO Level 1 data) are below 5 %. Moreover, for cases of long-range trans-ported aerosol like Saharan dust, it was found that a horizon-tal distance of 100 km corresponds to high correlation among the two profiles (Pappalardo et al., 2010). Figure 1 illustrates CALIPSO’s overflight that triggers the measurements of the EARLINET station of Potenza. Additionally, simultaneous measurements are predicted in order to study the aerosol tem-poral variability, or in the case of special events to study spe-cific aerosol types and to investigate the geographical repre-sentativity of the observations (Pappalardo et al., 2010).
Figure 1.Example showing CALIPSO’s ground track that passes the EARLINET measurement site at Potenza at a distance of less than 100 km.
2.3 Analysis setup
2.3.1 Comparison methodology
The CALIPSO measurements that result in the CL3 data are aggregated in a 2◦
×5◦ grid cell, whereas for EARLINET the measurements can be considered as point. Furthermore, the constituting grid cell overflights are not closely tied to the locations of the individual EARLINET sites. For the reasons mentioned, the CL3 and EARLINET data sets are not com-parable in number and spatial representativity, and as a con-sequence an ad hoc procedure for obtaining statistically com-parable data sets is necessary. In particular, only CALIPSO data segments corresponding to EARLINET measurements were selected. The comparison of matched observations re-duces uncertainties from spatial and temporal differences, but greatly reduces the number of the samples.
To produce the CL3∗ monthly profiles, we use the CL2 Version 3.01 Aerosol Profile product, which includes aerosol extinction and backscatter coefficient profiles at 532 nm. The spatial domain onto which the CL2 data are mapped is nearly 2◦×2◦and contains the EARLINET sites. This means that the longitudinal resolution is smaller owing to the distance of CALIPSO overpasses (6100 km) from the EARLINET measuring site. The six-step methodology to quality assure the CL3 profiles (Winker et al., 2013) is modified by adjust-ing an existadjust-ing metric accordadjust-ing to the rubric used by Camp-bell et al. (2012):
1. Extinction_Coefficient_Uncertainty_532610 km−1. The lower boundary, here, is set to a smaller value, whereas within CALIPSO procedure, retrievals deemed unstable are set to 99.9 km−1. In this case, samples that meet this condi-tion are removed as well as samples at lower altitudes. Prior to averaging, samples are excluded where the screening crite-ria are invoked and moreover, for samples that represent clear air a value 0.0 km−1is assigned, although clear-air samples over the surface are ignored from the averaging process in the
case that the base of the lowest aerosol layer in the profile is below 2.5 km.
In this analysis, CALIPSO extinction profiles at 532 nm are directly compared to corresponding EARLINET correl-ative measurements for the period 2006–2011, considering only the nighttime segment of the CALIPSO data set. We calculate the monthly average only when at least two mea-surements are available within the considered month. Only EARLINET cloud-free and below-cirrus-clouds profiles and CALIPSO cloud-free and above-cloud data are used to cal-culate the averaged profiles. As an additional benefit, the re-processing gives the opportunity to compare also CALIPSO with EARLINET aerosol backscatter coefficient and to cor-relate with the extinction comparisons. The same screening rubric used for the extinction coefficient is applied to the backscatter data as well. The characteristics of the data con-sidered are reported in Table 1. We also take advantage of the couple of optical properties to examine the lidar ratio, in ac-cordance with the findings of the aerosol subtyping scheme of the two platforms.
For CALIPSO, aerosol classification is a key input to the aerosol retrieval and must be inferred, therefore the CALIPSO aerosol classification is compared against EAR-LINET typing data.
2.3.2 CALIPSO aerosol classification
As was noted in Sect. 2.1, CALIPSO retrieval classifies aerosol layers into six subtypes, a crucial selection on which is based the aerosol optical properties retrieval. That is due to the absence of independent optical depth measurements (Young, 1995); therefore the aerosol lidar ratio inference is required prior to retrieval. The classification makes use of the aerosol location, aerosol height, the integrated attenuated backscatter, the approximate particle depolarization ratio and the surface type (Omar et al., 2009; Lopes et al., 2013) in or-der to type the layers. Regarding the surface type, clean ma-rine particles are only permitted over water bodies; therefore the overland flow of marine particles is not considered in the scheme. The assigned types have been previously identified from cluster analysis based on AERONET data (Omar et al., 2005). Each aerosol subtype is characterized by a set of lidar ratios for 532 and 1064 nm wavelengths. Table 2 shows the values set in the CALIPSO classification scheme for each of the aerosol subtypes.
2.3.3 EARLINET aerosol classification
Aerosol features from EARLINET are typed according to methods already consolidated within the network (Müller et al., 2007a, b; Groß et al., 2011; Mona et al., 2012a). Briefly, the lidar data evaluation is a three-step procedure:
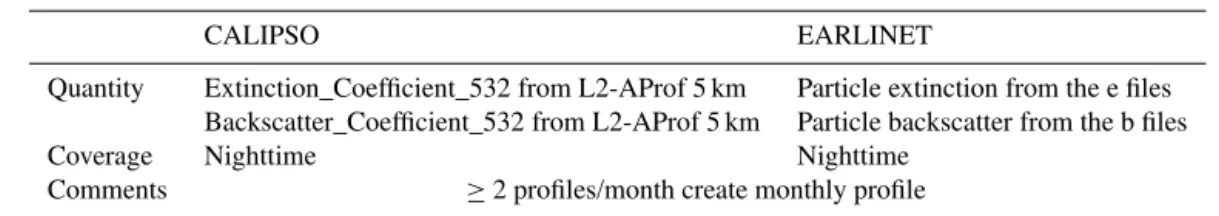
Table 1.Characteristics of CALIPSO and EARLINET data considered for this analysis.
CALIPSO EARLINET
Quantity Extinction_Coefficient_532 from L2-AProf 5 km Particle extinction from the e files Backscatter_Coefficient_532 from L2-AProf 5 km Particle backscatter from the b files
Coverage Nighttime Nighttime
Comments ≥2 profiles/month create monthly profile
Table 2.CALIPSO aerosol subtypes and the associated lidar ratio at 532 nm used in the aerosol optical properties retrieval. CM stands for clean marine, D for dust, CC for clean continental, PC for pol-luted continental, PD for polpol-luted dust, and S for smoke.
Aerosol type CM D CC PC PD S
Lidar ratio at 532 nm [sr] 20 40 35 70 55 70
2. the identification of the boundary location of the aerosol layer, and
3. the aerosol layer typing by means of investigation of in-tensive optical properties (Ångström exponent, lidar ra-tios, linear particle depolarization ratio), model outputs, backward trajectory analyses, and ancillary instruments data if available.
The aerosol layers, identified as above, are typed with respect to the CALIPSO aerosol subtyping (Table 2). The EAR-LINET layers, therefore, fall into six subtypes: marine, dust, polluted continental, clean continental, polluted dust, and smoke. In order to achieve this, we had to compromise the comparison for the maritime particles. Since pure marine lay-ers are rarely observed over the considered stations, typically mixtures of marine and other aerosol types are measured in the lidar signals, and the clean marine CALIPSO type is di-rectly compared with the EARLINET marine type. We will hereafter use the marine notation for both CALIPSO and EARLINET subtyping. Note that a significant discrepancy of the existing typing schemes concerns the polluted dust sub-type. This subtype represents a mixed aerosol situation: in the CALIPSO algorithm the subtype takes into account mixtures of dust with smoke or pollution, while in the EARLINET classification the dusty mixtures also include maritime parti-cles.
2.3.4 Selected sites
The EARLINET data related to CALIPSO overpasses, span-ning the period from June 2006 to December 2011, consist of 7554 particle backscatter and extinction profiles (EAR-LINET publishing group 2000–2010, 2014). The particle ex-tinction profiles are 1047, of which 478 correspond to 355, 498 to 532 nm, and the rest to other wavelengths. The sta-tions, therefore, providing the largest data set are Évora,
Granada, Leipzig, Naples and Potenza, all equipped with multi-wavelength Raman lidars. Apart from the data redun-dancy, the stations were also selected with respect to their range resolution. The analysis is based on the precise layer location, which can be accomplished by using a resolu-tion finer or comparable to the CALIPSO one (60 m in the lower troposphere). Figure 2 shows the geographical distri-bution of the sites (yellow squares) – in the West, Évora (293 m a.s.l.) and Granada (680 m a.s.l.); in Central Europe,
Leipzig (90 m a.s.l.); and in central Mediterranean, Naples
(118 m a.s.l.) and Potenza (760 m a.s.l.). The original CL3
grids linked to the EARLINET sites are reported as blue boxes. The red boxes embedded in the standard CL3 grid cells correspond to the CL3∗data grids. The CL3∗cells for Naples and Potenza exceed the CL3 borders and even overlap as both site locations lie close to the CL3 borders and are sep-arated by∼100 km. The CL3∗cell latitudinal edges are kept the same as for CL3, whilst the longitudinal edges are dic-tated by the EARLINET correlative measurements scheme (ca. 1◦to the west and to the east from the site’s location). The number of available EARLINET correlative observa-tions and CALIPSO grid overflights that were used to pro-duce the mean profiles are summarized in Table 3. More-over, the table reports the mean minimum distance between the satellite ground track and the EARLINET stations – the total mean minimum distance was found to be 63.5 km. To ensure that the same air volumes were sampled, the HYS-PLIT model (Draxler and Hess, 1998) in backward mode was used. The model was initiated for each CALIPSO measure-ment and its EARLINET counterpart and the corresponding trajectories were visually inspected. Each model run was set in the range of 0.5–6 km and for constant height increments, independently of the existence of aerosol layers. For all the cases related to this study, the model analyses indicated that the ground-based and satellite lidars sampled the same air mass.
Table 3. Number of CALIPSO overflights and EARLINET correlative observations along with the produced monthly profiles, and the minimum distance between the satellite ground track and the EARLINET station.
EARLINET station CALIPSO overpasses Monthly profiles Minimum distance [km]
Évora 15 5 63.6
Granada 20 8 66.8
Leipzig 20 10 51.4
Naples 26 11 64.0
Potenza 33 13 67.9
Total 114 47 63.5
Figure 2.Spatial boundaries of the CALIPSO data that are related to the five EARLINET sites. The alternative CL3∗domain reflects the finer spatial resolution with regard to the CL3 domain. The CL3∗grid cell is dictated by the correlative measurements sched-ule (measurements are triggered when the satellite’s ground track is within 100 km distance from the station); the latitude borders of the grid are kept equal to the CL3 grid.
references therein). Clean conditions are less represented, here, but since they contribute less to the total AOD their influence is less important. However, it should be noted that the influence of lidar ratio increases with the layer AOD so it is more relevant for the dust/smoke plumes in general.
3 Results
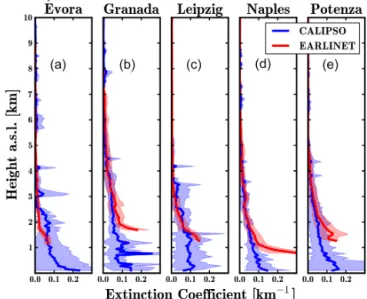
Figures 3, 4, and 5 show, respectively, the mean particle ex-tinction, backscatter coefficient, and lidar ratio at 532 nm comparison of EARLINET (red line) and CL3∗ (blue line) as a function of height. The monthly mean profiles, shown in Table 3, are averaged for the five grids and presented, here, along with their standard deviation (shaded error bars). The panels from left to right refer to the five EARLINET grid cells and are sorted alphabetically. The integral of the extinc-tion coefficient at 1 km range increments was calculated for both profiles, and the corresponding AOD differences are
re-Figure 3.Extinction coefficient at 532 nm for CL3∗ (blue line) and for EARLINET (red line). From left to right: (a) Évora,
(b)Granada,(c)Leipzig,(d)Naples, and(e)Potenza.
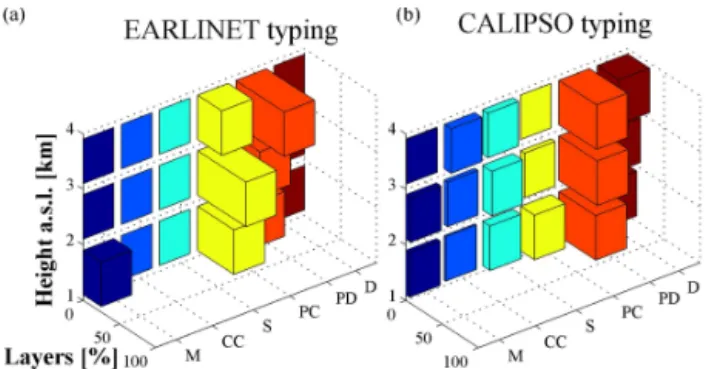
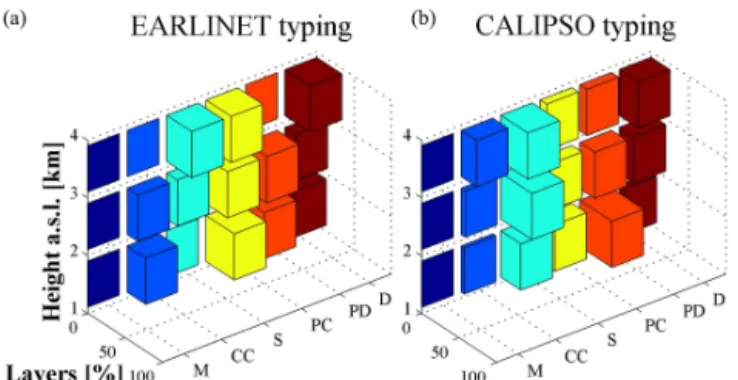
ported in Table 4. The plots of Figs. 6–10 represent the typ-ing of the EARLINET measurements (left panels) and the corresponding CALIPSO overpasses (right panels) for the five grid cells. The probed altitude range was partitioned into 1 km bins and the percentage of layers identified within each bin is reported. Therefore, according to the boundary loca-tion, layers can be present in more than one height bin range. However, the first bin is associated with the lowest altitude point retrieved by EARLINET, thus the range can be smaller than 1 km. For this comparison, the same distance was used for both EARLINET and CALIPSO typing. For the sake of visual consistency, the height bins are kept equidistant for all the plots.
3.1 CALIPSO level 3∗comparison 3.1.1 Évora
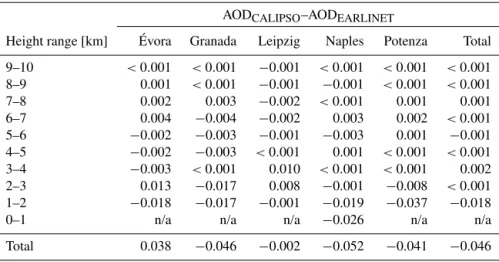
Table 4.AOD differences in the range 0–10 km over 1 km height intervals for the five EARLINET stations.
AODCALIPSO–AODEARLINET
Height range [km] Évora Granada Leipzig Naples Potenza Total
9–10 <0.001 <0.001 −0.001 <0.001 <0.001 <0.001 8–9 0.001 <0.001 −0.001 −0.001 <0.001 <0.001
7–8 0.002 0.003 −0.002 <0.001 0.001 0.001
6–7 0.004 −0.004 −0.002 0.003 0.002 <0.001
5–6 −0.002 −0.003 −0.001 −0.003 0.001 −0.001
4–5 −0.002 −0.003 <0.001 0.001 <0.001 <0.001 3–4 −0.003 <0.001 0.010 <0.001 <0.001 0.002 2–3 0.013 −0.017 0.008 −0.001 −0.008 <0.001
1–2 −0.018 −0.017 −0.001 −0.019 −0.037 −0.018
0–1 n/a n/a n/a −0.026 n/a n/a
Total 0.038 −0.046 −0.002 −0.052 −0.041 −0.046
Figure 4. Backscatter coefficient at 532 nm for CL3∗(blue line) and for EARLINET (red line). From left to right: (a) Évora,
(b)Granada,(c)Leipzig,(d)Naples, and(e)Potenza.
station is a rural site and consequently is appropriate for the study of aerosols from different sources. In Fig. 3a, the Évora EARLINET monthly particle extinction coefficient decreases steeply up to 2 km and then gradually continues to decrease up to 6.5 km. On the other hand, CALIPSO profile yields a different behavior both in aerosol layering and extinction values. CALIPSO reported a strong aerosol feature around 2 km not observed by the EARLINET station and did not af-fect the resulting mean profile. The feature that caused the discrepancy in the profiles was flagged by CALIPSO as dust and its mean extinction value was 0.14 km−1. Between 2.5 and 5 km the profiles are in good agreement. Further, above 5 km height the situation changes as the ground-based lidar yields zero values, while CALIPSO identifies aerosol layers. The total AOD difference (Table 4) for the whole range is
Figure 5. Lidar ratio at 532 nm for CL3∗ (blue line) and for EARLINET (red line). From left to right:(a)Évora,(b)Granada,
(c)Leipzig,(d)Naples, and(e)Potenza.
0.038. The situation for the backscatter coefficient compar-ison (Fig. 4a) shows better agreement around 2 km, yet the CALIPSO backscatter values in that specific layer and above exceed the EARLINET ones. The lidar ratio (Fig. 5a) within the errors is in good agreement, though the EARLINET stan-dard deviation is higher than the CALIPSO one. This is prob-ably the result of the aerosol mixing and difference in the vol-umes sampled. The mean EARLINET lidar ratio is 55±10 sr and the corresponding CALIPSO value is 51±7 sr. Specif-ically, for the area of discrepancy around 2 km there is an altered situation where the CALIPSO lidar ratio is 55±3 sr while EARLINET yields 46±6 sr.
Typi-Figure 6. Évora:(a)EARLINET and(b) CALIPSO typing bar-plots for 1 km range increment. M stands for marine, D for dust, PC for polluted continental, CC for clean continental, PD for pol-luted dust, and S for smoke subtype.
cally, air masses flow from the west and prior to arriving at Évora cross the polluted area of Lisbon, creating the polluted mixtures. Oddly, pure dust particles were not detected dur-ing the measurements. Marine particles have a strong influ-ence for the first range bin. On the other hand, Fig. 6b re-ports the particle classification delivered by the CALIPSO typing module. Polluted dust displayed the highest and con-stant frequency for all the height bins. Dust, by contrast to EARLINET, plays an important role and has increased fre-quency rate in higher altitudes. Polluted continental samples decrease with height, but have a significant contribution in the first height range. Smoke and marine particles had a mi-nor frequency throughout the range.
3.1.2 Granada
The Granada EARLINET station is located in the south of Spain and is situated in a natural basin surrounded by moun-tains of variable height from 1 to 3.5 km a.s.l. The main
contributors to the local aerosol load are the mineral dust from North Africa and anthropogenic pollution from Europe (Alados-Arboledas et al., 2003; Navas-Guzmán et al., 2013). The mean aerosol extinction profiles (Fig. 3b) yielded higher values for EARLINET up to 3 km, above that range both pro-files showed a good agreement. The mean AOD difference, reported in Table 4, is−0.046. The backscatter comparison (Fig. 4b) revealed the same characteristics with enhanced dis-crepancy in the lowermost part of the profile, as expected due to the complex topography of the region (Guerrero-Rascado et al., 2008). Despite the observed differences in both ex-tinction and backscatter coefficient profiles, the agreement on lidar ratio is in general good (Fig. 5b). The EARLINET retrieved lidar ratio is 45±3 sr and the calculated CALIPSO lidar ratio is 46±4 sr.
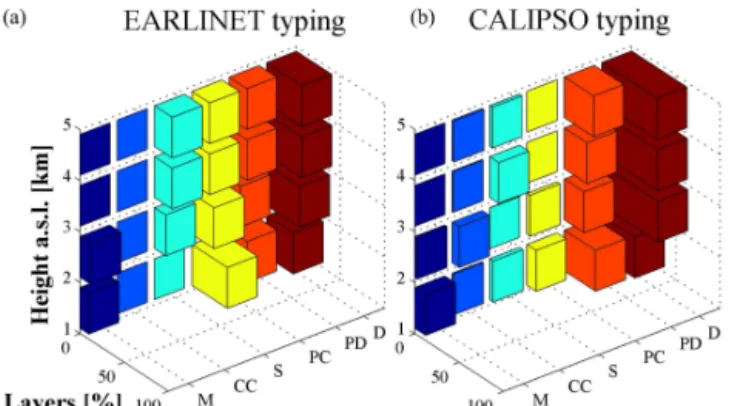
In Fig. 7a, the ground-based lidar retrieval identified pol-luted dust and dust as the most frequent observed particle subtypes. Polluted dust shows the highest frequency for the first two height bins and dust for the rest. Dust is present
ev-Figure 7.Granada:(a)EARLINET and(b)CALIPSO typing bar-plots for 1 km range increment. M stands for marine, D for dust, PC for polluted continental, CC for clean continental, PD for polluted dust, and S for smoke subtype.
erywhere and increases its contribution gradually as a func-tion of height. Polluted continental particles are found as high as 4 km and contribute significantly in the aerosol load for the lowest altitudes. Marine particles were observed for the first four height bins; these particles are transported from the Atlantic Ocean and the Mediterranean as well. Smoke parti-cles highly affect the lidar signals over 5 km. For CALIPSO algorithms (Fig. 7b), as was the case for EARLINET, pol-luted dust and dust showed a complementary behavior, with polluted dust affecting more in the first height bins and dust higher up. Both smoke and clean continental particles weakly influence the lidar signals at high altitudes. No contribution was found for marine and a minor contribution from polluted continental particles. Overall, the CALIPSO and EARLINET aerosol typing indicate dust and polluted dust as the major aerosol types over the Granada grid. Once more, the dusty components identification is well captured.
3.1.3 Leipzig
the other hand, the EARLINET lidar ratio is separated into two distinct regions – in the first region (around 1.8 km) the mean value is 76±10 sr indicating the fine, absorbing parti-cles located near the surface. The second region (1.8–3 km) coincides with the calculated mean CALIPSO lidar ratio, and exhibits a mean value of 62±2 sr.
The Leipzig ground-based observations indicated as the most important component of the local aerosol load the pol-luted continental for all height intervals, as shown in Fig. 8a. Polluted dust, smoke, and dust follow in frequency of iden-tification. Dust along with smoke particles have a stronger influence in the higher range. Clean continental particles lie in the first two height bins. The CALIPSO typing, shown in Fig. 8b, for the height interval 1–2 km identifies smoke and polluted continental equally; for the same range polluted dust contributes the most. Smoke particulates keep a rather con-stant identification frequency for the next height increments, whereas polluted dust showed a decreasing frequency with height. Dust has a slightly increasing frequency with height and reflects very well the EARLINET identification rate. Clean continental subtype becomes important in the range 3– 4 km and competes in identification frequency with the dust and smoke subtypes.
3.1.4 Naples
The urban area of Naples is characterized by high aerosol content, mainly located in the planetary boundary layer (PBL), originating from both natural sources and anthro-pogenic activities (Boselli et al., 2009). Looking at Fig. 3d, the strong deviation of the EARLINET and CALIPSO ex-tinction mean profiles below 2 km (mean exex-tinction bias −0.05 km−1) is evident. This behavior can be attributed to the local aerosol content of the area of Naples, which is a densely populated and highly polluted city, and to the grid on which the CALIPSO profiles are mapped; consisting mostly of maritime area (see Fig. 2). For the upper altitude level the difference diminished and the agreement is satisfac-tory (mean extinction difference <0.001 km−1). The mean
AOD difference (Table 4) is−0.052 if we consider the whole range, and−0.022 for altitudes above 1 km. Nonetheless, the strong anthropogenic impact around the area of Naples in-fluences the comparison. In Fig. 4d, the particle backscat-ter comparison shows a significant improvement as the dis-crepancy in the lowermost part of the profile is reduced. The retrieved lidar ratio, shown in Fig. 5d, yields larger values below 2 km (PBL plus adjoining regions), Saer=72±9 sr, because of the strong influence of small absorbing particles. The PBL is capping local anthropogenic aerosols from com-bustion, industrial activities, and traffic. In the region of 2– 3 km there is good agreement between the two platforms with mean lidar ratio values of Saer=44±4 sr for Naples sta-tion and Saer=44±2 sr for CALIPSO. In the upper level the EARLINET lidar ratio fluctuates, owing mainly to the low signal-to-noise ratio. A lidar ratio almost constant in the
Figure 8.Leipzig:(a)EARLINET and(b) CALIPSO typing bar plots for 1 km range increment. M stands for marine, D for dust, PC for polluted continental, CC for clean continental, PD for polluted dust, and S for smoke subtype.
0–2 km range is assumed in the CALIPSO retrieval with val-ues of 41±3 sr, indicative of dust particles (Saer=40 sr), and 46±3 sr above 2 km.
The EARLINET (Fig. 9a) typing scheme for the first height bin identifies stronger anthropogenic pollution, that decreases with height but still represents an important con-tribution to the aerosol situation. Dust and polluted dust par-ticles reveal a stable behavior over the different height in-tervals. Smoke plumes lie in the higher altitudes of the pro-files. The first two height bins are influenced by marine par-ticles, that typically for the Naples site are mixed with the lo-cal aerosol content. Figure 9b indicates the influence of dust and polluted dust particles in CALIPSO data over the Naples grid; their vertical distribution is rather constant. These sub-types have the most profound impact on this grid cell. Ma-rine particles expectedly lie in the lowest range of the profile, while polluted continental particles are almost nonexistent. This mismatch for the polluted continental subtype indicates the large deviation of the extinction coefficients in the lower part of the profiles. The clean continental type becomes im-portant in the higher parts of the profile as well as the smoke category but to a lesser extent. The agreement, once more, for the dust and polluted dust category is very good, taking into account the variations of the aerosol field and the surface type.
3.1.5 Potenza
In contrast to the neighboring Naples, the Potenza station is located at a mountainous, rural site. The relatively low lo-cal aerosol content makes the observations particularly inter-esting for long-transported particle plumes (Madonna et al., 2011; Mona et al., 2014). In Fig. 3e, the discrepancy in the profiles below 2 km is significantly high (mean extinction bias−0.05 km−1). The differences are reduced in the upper levels (mean extinction bias<−0.01 km−1). The lower-level
Figure 9. Naples:(a)EARLINET and (b) CALIPSO typing bar plots for 1 km range increment. M stands for marine, D for dust, PC for polluted continental, CC for clean continental, PD for polluted dust, and S for smoke subtype.
quantify the periodicity of this discrepancy. The integral of the extinction coefficients over constant height ranges was calculated, as shown in Table 4, with a total mean AOD bias of−0.041. Figure 4e shows that the “gap” in the extinction profiles near the ground disappears for the backscatter pro-files. That might suggest a wrong a priori selection or infer-ence of lidar ratio in the CALIPSO retrieval. Therefore the lidar ratio profile for each month is estimated and directly compared to averaged unconstrained EARLINET lidar ra-tio profile. The CALIPSO lidar rara-tio, in Fig. 5e, is kept for the whole altitude range slightly below 50 sr,Saer=49±3 sr. On the other hand EARLINET measured lidar ratios exhibit higher values in the range 1.5–2.7 km,Saer=62±3 sr, most likely because of the influence of absorbing particles. In the height range 2.7–5 km, the CALIPSO lidar ratio values agree well with the EARLINET mean value of 50±5 sr. The ob-tained lidar ratio values agree with the findings of Mona et al. (2014), and suggest the existence of dust particles in the height range 2.7–5 km.
Figure 10a gives an outlook of the aerosol types observed by the EARLINET station; polluted continental particles af-fect the most in the first height bin and decrease significantly as a function of height. Polluted dust and dust affect the area around the site, dust identification frequency is increasing with height, while for polluted dust the frequency is rather stable. Smoke particles have a range-invariant character up to 4 km. For CALIPSO, Fig. 10b, dust and polluted dust prevail over the grid. Smoke is present in the range 1–4 km; some polluted continental is in the first height bin, and clean conti-nental resides in the higher altitudes. As far as marine parti-cles, they slightly affect the study area.
3.2 General findings and discussion
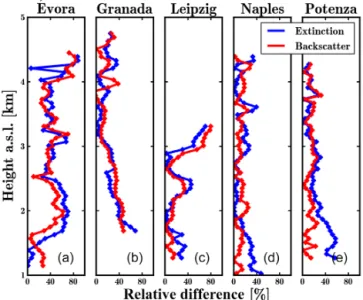
Figure 11 displays the relative difference of the extinc-tion and backscatter comparison for each examined sta-tion. First, we calculate the height below which the
Figure 10.Potenza:(a)EARLINET and(b)CALIPSO typing bar plots for 1 km range increment. M stands for marine, D for dust, PC for polluted continental, CC for clean continental, PD for polluted dust, and S for smoke subtype.
90 % of the columnar AOD is confined using the extinc-tion profiles. Next, the relative biases are estimated as
(xCALIPSO−xEARLINET)/xEARLINET, where x is the
extinc-tion or backscatter profile. For most of the staextinc-tions, the backscatter comparison at 532 nm suggests better perfor-mances of the CALIPSO backscatter with respect to the ex-tinction. Hence, using the CALIPSO backscatter coefficient, the comparison improves the relative mean biases when com-pared to the CALIPSO extinction coefficient. In particular, the mean relative difference for the averaged backscatter pro-files was found to be 18 % whereas for the extinction propro-files it was 25 %. The better agreement in terms of backscatter has to be ascribed to the higher influence of lidar ratio assump-tion on extincassump-tion rather than on backscatter. Nevertheless, this outcome should be treated with care as the differences are mainly located in the lower troposphere where typing and subsequent lidar ratio inference is complicated due to the complexity of the scenes.
consid-Figure 11.Relative difference of extinction and backscatter coeffi-cient for each considered site.
ered over continental grid cells, whereas the stations in the Mediterranean are obviously affected by mixtures of marine particles. Besides, CALIPSO underestimated the outflow of anthropogenic pollution from coastal sites towards the sea, as these aerosols are wrongly flagged as marine if observed over the sea. This situation was observed for the grid cell of Naples and is in agreement with the outcome of Kanitz et al. (2014).
3.3 Lidar ratio investigation
The choice of lidar ratio values in the CALIPSO retrievals can be a significant reason for the discrepancies observed in the aerosol extinction profiles. To investigate this, the mean EARLINET lidar ratio for each subtype is calculated and then compared with the corresponding CALIPSO modeled values (see Table 2). The EARLINET subtype layers were considered in the statistics only when there was an exact identification of the same subtype by CALIPSO. In many cases the complexity of the CALIPSO scene makes it al-most impossible to assign one aerosol type to each height bin, though in the case of strong features, such as dust and pol-luted dust, the assignment is easier. In the case of complex aerosol scenes, we simply omitted the profiles when more than one subtype was identified with the same frequency. Keeping this prerequisite of simultaneous identification, the number of available samples was reduced.
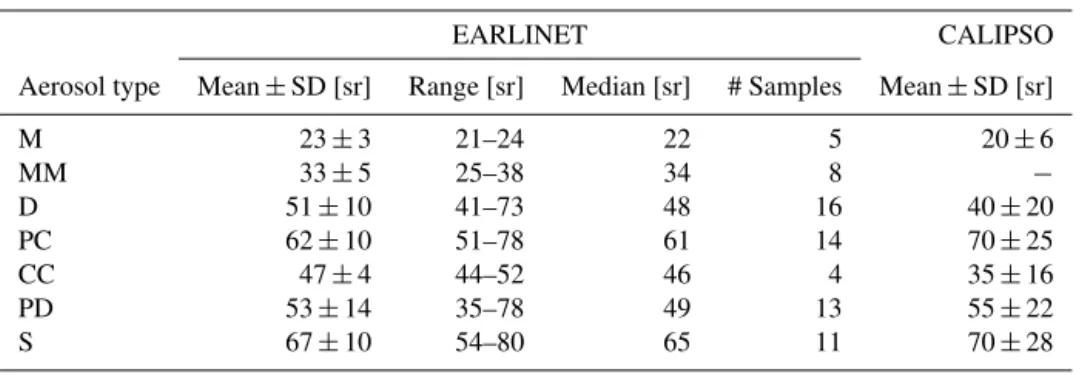
The EARLINET mean lidar ratio for the selected types is summarized in Table 5 along with the corresponding li-dar ratio values (rightmost column) used by CALIPSO (e.g., Lopes et al., 2013; Young et al., 2013; Nowottnick et al., 2015). For the smoke subtype the mean EARLINET mea-sured lidar ratio value is 67±10 sr and it compares well with the assignment made by the CALIPSO classification
scheme, which is Saer=70±28 sr. The marine lidar ratio is 23±3 sr and agrees also well with theSaer=20±6 sr of the CALIPSO scheme. In this case, only pure marine lay-ers over the stations are considered, so that the agreement is expected. This study, also, estimated a mean lidar ratio for mixed marine particles of 33±5 sr, which is consistent with values reported in the literature (e.g., Müller et al., 2007a; Groß et al., 2011; Burton et al., 2013). The CALIPSO typ-ing scheme does not incorporate marine mixtures in a sepa-rate subtype as denoted in Sect. 2.3.2, therefore a comparison is not feasible. The clean continental subtype assignment is not a straightforward procedure for the EARLINET sites, as the aerosol layer classification depends strongly on the rejec-tion of the other types (Wandinger et al., 2011). The mean EARLINET lidar ratio is 45±4 sr and deviates from the as-sumed CALIPSOSaer=35±16 sr. For interpreting these re-sults, one should take into account that the clean continental type in the CALIPSO scheme is intended as the background aerosol and as a consequence, deemed not to be influenced by urban pollution. However, these conditions are probably not realistic for the European continent. The EARLINET li-dar ratio values measured for these cases seem to indicate that the cases flagged as clean continental are affected by ab-sorbing particles of anthropogenic nature. For the polluted continental, the mean EARLINET value is 62±10 sr, and is in fair agreement with the CALIPSOSaer=70±25 sr con-sidering the variability of this subtype. It is most likely that the presence of marine particles over the Mediterranean area influences the mean lidar ratio value for this category. This effect was described by Balis et al. (2004) and Mona et al. (2006), where the marine particles can act as an external mix-ture and reduce linearly the lidar ratio values.
The EARLINET lidar ratio value for dust is 51±10 sr and is higher than the CALIPSOSaer=40±20 sr, however com-parable considering the variability of the parameter, even in the lower limits of the standard deviation. The measured lidar ratio is in accordance with other studies (e.g., Mona et al., 2006; Guerrero-Rascado et al., 2009; Preißler et al., 2011; Wiegner et al., 2011; Schuster et al., 2012; Navas-Guzmán et al., 2013) and field experiments on dust sources (e.g., Tesche et al., 2009a, b; Groß et al., 2011). Moreover, the mean EARLINET lidar ratio exceeded the CALIPSO mod-eled value for all the examined sites. Typically, the source region of the dust outbreaks is the Western Saharan region where according to numerous studies (e.g., Tesche et al., 2009a; Schuster et al., 2012; Amiridis et al., 2013) lidar ratio at 532 nm is around 55–58 sr.
Table 5.Mean lidar ratio at 532 nm for the different aerosol subtypes as measured by EARLINET sites and corresponding statistical param-eters. The last column refers to the lidar ratio values assumed by CALIPSO and their associated lidar ratio distributions (mean plus standard deviation). M stands for marine, MM for mixed marine, D for dust, PC for polluted continental, CC for clean continental, PD for polluted dust, and S for smoke subtype. Note that, here, the M subtype corresponds to pure marine particles
EARLINET CALIPSO
Aerosol type Mean±SD [sr] Range [sr] Median [sr] # Samples Mean±SD [sr]
M 23±3 21–24 22 5 20±6
MM 33±5 25–38 34 8 −
D 51±10 41–73 48 16 40±20
PC 62±10 51–78 61 14 70±25
CC 47±4 44–52 46 4 35±16
PD 53±14 35–78 49 13 55±22
S 67±10 54–80 65 11 70±28
CALIPSO lidar ratio,Saer=64±15 sr. For all the other sites, the mean lidar ratio values stay below the CALIPSO as-sumed value of 55 sr – for Granada Saer=45±11 sr, for ÉvoraSaer=42±9 sr, and for NaplesSaer=38±15 sr. The main reason of this divergence is the presence of marine par-ticles in the mixture, which are not taken into account for the CALIPSO polluted dust category (Omar et al., 2009). These results underline the large variability of the polluted dust li-dar ratio and its dependence on the mixture of particles. 3.4 Assessing the impact of lidar ratio
In the light of the disparity observed in the lidar ratios of clean continental, dust, and polluted dust subtypes, we as-sessed the impact of introducing the calculated EARLINET values into the CALIPSO extinction retrieval. Hence, the lidar ratio values of the subtypes of dust, polluted dust, and clean continental are set toSaer=51 sr,Saer=53 sr, and
Saer=47 sr, respectively. The CALIPSO typing data coming from the Vertical Feature Mask are weighted according to the alternative lidar ratio values and they are multiplied by the respective backscatter coefficient to estimate the extinc-tion profiles. Figure 12 summarizes the columnar mean rela-tive differences between the CL3∗extinction profiles and the lidar ratio corrected CL3∗profiles for each aerosol subtype (i.e., clean continental, polluted dust, dust) and the combina-tion of them.
The rate of the change caused by the adjustment of the lidar ratio depends on the observations frequency of the aerosol subtype and on the backscattering intensity of each feature. By this, we highlight that the almost 10 sr increase of the clean continental lidar ratio produces an extinction increase of less than 1 %, whilst the use of 53 sr instead of 55 sr for the polluted dust creates a decrease of about 3 %. Consequently, the clean continental lidar ratio inference duces an almost insignificant change in the extinction pro-file, whereas for the polluted dust, small difference in li-dar ratio value leads to small underestimation of the extinc-tion retrieval. Moreover, we should consider that this
sub-Figure 12.Mean relative differences between CL3∗ and the cor-rected CL3∗ extinction coefficient. The corrected CL3∗ extinc-tion coefficient is retrieved when introducing the EARLINET-estimated lidar ratio for clean continental (CC), dust (D), and pol-luted dust (PD) subtypes as well as for the category Combined (CC+D+PD).
type is systematically overused by CALIPSO (Burton et al., 2013) and, therefore, the impending re-typing of the wrongly flagged polluted dust features will lead to an increase of the dust, polluted continental fraction, which will affect the lidar ratio. The potential improvement of the CALIPSO dust re-trievals by using a dust lidar ratio of 51 sr produced a 5 % in-crease, confirming that a regional correction and spatial con-stant value can enhance the extinction retrievals (Amiridis et al., 2013).
values of lidar ratio to improve the CALIPSO extinction re-trieval based on independent, range-resolved lidar ratio pro-files measured on a continental scale.
4 Conclusions
The comparison of CALIPSO to advanced ground-based li-dar systems is essential to understand whether CALIPSO measurements are representative of the corresponding station-surrounding area in a climatological sense and if there are systematic deviations due to assumptions in the CALIPSO retrievals. CL3∗ data were compared against EARLINET monthly averages obtained by profiles mea-sured during satellite overflights. CALIPSO monthly profiles yielded lower extinction values comparing to EARLINET ones. A total mean AOD difference of −0.05 was found. There are many possible reasons for the observed differ-ences, of which the most important are: difference in sam-pling volumes and the spatial variability of the aerosol fields, problems/limitations with the CALIPSO measurements, and uncertainty of the CALIPSO assumptions. A mean relative difference of 18 % was found for the aerosol backscatter co-efficient, while a considerably larger difference – 25 % – was obtained for the extinction coefficient. The better agreement on backscatter has to be ascribed to the higher impact of li-dar ratio assumption on extinction rather than on backscatter. Observe that the improvement in the backscatter comparison is mainly associated to the low troposphere where both the CALIPSO typing and the lidar ratio inference are more com-plex.
The comparison on aerosol typing showed a robust identi-fication of dust subtype demonstrating the good performance of the CALIPSO polarization-sensitive observations that fa-cilitate the correct identification of irregular shaped particles. A CALIPSO overestimation of the polluted dust subtype was identified and it was found to be most prominent in the lowest height ranges. This reflects the effects of a known bug sug-gesting that a part of the aerosol loading will be reclassified as polluted continental or smoke, and hence will enhance the corresponding extinction estimates. The polluted and clean continental subtypes produced the poorest agreement. The polluted continental disparity of the data sets, typically in the regions adjoining the PBL, affects the extinction retrievals and can be attributed to the CALIPSO polluted dust overuse as well as to the local aerosol content. The clean continental subtype is the least encountered aerosol type observed and it characterizes the typical aerosol background conditions over the stations. In most of the cases, the minimum levels of the signal-to-noise ratio needed to retrieve the extinction coeffi-cient for this aerosol subtype is not met by the EARLINET systems. The marine particles by the CALIPSO classifica-tion scheme are surface-dependent, and furthermore no mix-ing with other aerosol types is considered. On the other side, according to the EARLINET observations, the presence of
marine particles mixed to other types (i.e., smoke, polluted continental) is a common situation over the Mediterranean Sea.
A type-by-type comparison of CALIPSO modeled against EARLINET measured lidar ratio was carried out. The most notable differences were found for the clean continental, dust, and polluted dust subtypes. The mean clean continen-tal EARLINET lidar ratio was 47±4 sr and diverges about 10 sr from the modeled value. In the CALIPSO scheme, this aerosol subtype is intended as the background aerosol and deemed not to be influenced by continental pollution, whereas these conditions are unlikely in a highly populated region as Europe. The dust EARLINET lidar ratio value is 51±10 sr and is greater than the CALIPSO 40 sr, highlight-ing the low CALIPSO lidar ratio inference. The mean pol-luted dust lidar ratio was 53±14 sr and is in good agreement with the 55 sr used in the CALIPSO retrieval codes. How-ever, the EARLINET sites in the Mediterranean area indi-cate the existence of mixtures with marine particles that are not accounted for in the CALIPSO polluted dust subtype.
In accordance to previous studies, we have quantitatively shown the improvement of CALIPSO product by adjusting the assumed lidar ratio values taking as reference the corre-sponding EARLINET measurements. Based on our findings, we suggest the regional tuning of the dust lidar ratio. Marine particles should be taken into account in the polluted dust subtype, at least in areas like the Mediterranean, where the flow of these particles inland change the composition affect-ing the CALIPSO optical properties retrieval. The correction of the space-based extinction retrieval enhanced the climatic relevant AOD about 3 % regionally. Generally, the backscat-ter comparison showed a betbackscat-ter agreement with respect to the extinction comparison; hence backscatter could be coupled in the CL3 files offering more robust data – for instance, for model validation and climatological studies.
are particularly grateful for the assistance and suggestions given by Mark Vaughan.
Edited by: J. Huang
References
Alados-Arboledas, L., Alados, I., Foyo-Moreno, I., Olmo, F., and Alcántara, A.: The influence of clouds on surface UV erythemal irradiance, Atmos. Res., 66, 273–290, 2003.
Amiridis, V., Giannakaki, E., Balis, D., Gerasopoulos, E., Pytharoulis, I., Zanis, P., Kazadzis, S., Melas, D., and Zere-fos, C.: Smoke injection heights from agricultural burning in Eastern Europe as seen by CALIPSO, Atmos. Chem. Phys., 10, 11567–11576, doi:10.5194/acp-10-11567-2010, 2010.
Amiridis, V., Wandinger, U., Marinou, E., Giannakaki, E., Tsek-eri, A., Basart, S., Kazadzis, S., Gkikas, A., Taylor, M., Bal-dasano, J., and Ansmann, A.: Optimizing CALIPSO Saha-ran dust retrievals, Atmos. Chem. Phys., 13, 12089–12106, doi:10.5194/acp-13-12089-2013, 2013.
Amiridis, V., Marinou, E., Tsekeri, A., Wandinger, U., Schwarz, A., Giannakaki, E., Mamouri, R., Kokkalis, P., Binietoglou, I., Solo-mos, S., Herekakis, T., Kazadzis, S., Gerasopoulos, E., Proes-takis, E., Kottas, M., Balis, D., Papayannis, A., Kontoes, C., Kourtidis, K., Papagiannopoulos, N., Mona, L., Pappalardo, G., Le Rille, O., and Ansmann, A.: LIVAS: a 3-D multi-wavelength aerosol/cloud database based on CALIPSO and EARLINET, At-mos. Chem. Phys., 15, 7127–7153, doi:10.5194/acp-15-7127-2015, 2015.
Balis, D. S., Amiridis, V., Zerefos, C., Kazantzidis, A., Kazadzis, S., Bais, A. F., Meleti, C., Gerasopoulos, E., Papayannis, A., Matthias, V., Dier, H., and Andreae, M. O.: Study of the ef-fect of different type of aerosols on UV-B radiation from mea-surements during EARLINET, Atmos. Chem. Phys., 4, 307–321, doi:10.5194/acp-4-307-2004, 2004.
Böckmann, C., Wandinger, U., Ansmann, A., Bösenberg, J., Amiridis, V., Boselli, A., Delaval, A., De Tomasi, F., Frioud, M., Grigorov, I., Hågård, A., Horvat, M., Iarlori, M., Komguem, L., Kreipl, S., Larchevêque, G., Matthias, V., Papayannis, A., Pappalardo, G., Rocadenbosch, F., Rodrigues, J., Schnei-der, J., Shcherbakov, V., and Wiegner, M.: Aerosol lidar in-tercomparison in the framework of the EARLINET project. 2.Aerosol backscatter algorithms, Appl. Optics, 43, 977–989, doi:10.1364/AO.43.000977, 2004.
Boselli, A., Armenante, M., D’Avino, L., D’Isidoro, M., Pisani, G., Spinelli, N., and Wang, X.: Atmospheric aerosol characterization over Naples during 2000–2003 EARLINET project: planetary boundary-layer evolution and layering, Bound.-Lay. Meteorol., 132, 151–165, 2009.
Burton, S. P., Ferrare, R. A., Hostetler, C. A., Hair, J. W., Rogers, R. R., Obland, M. D., Butler, C. F., Cook, A. L., Harper, D. B., and Froyd, K. D.: Aerosol classification us-ing airborne High Spectral Resolution Lidar measurements – methodology and examples, Atmos. Meas. Tech., 5, 73–98, doi:10.5194/amt-5-73-2012, 2012.
Burton, S. P., Ferrare, R. A., Vaughan, M. A., Omar, A. H., Rogers, R. R., Hostetler, C. A., and Hair, J. W.: Aerosol classification from airborne HSRL and comparisons with the CALIPSO vertical feature mask, Atmos. Meas. Tech., 6, 1397– 1412, doi:10.5194/amt-6-1397-2013, 2013.
Campbell, J. R., Tackett, J. L., Reid, J. S., Zhang, J., Curtis, C. A., Hyer, E. J., Sessions, W. R., Westphal, D. L., Prospero, J. M., Welton, E. J., Omar, A. H., Vaughan, M. A., and Winker, D. M.: Evaluating nighttime CALIOP 0.532 µm aerosol optical depth and extinction coefficient retrievals, Atmos. Meas. Tech., 5, 2143–2160, doi:10.5194/amt-5-2143-2012, 2012.
Draxler, R. R. and Hess, G. D.: An overview of the HYSPLIT4 modeling system of trajectories, dispersion, and deposition, Aust. Meteor. Mag., 47, 295–308, 1998.
EARLINET publishing group 2000–2010 (Adam, M., Alados-Arboledas, L., Althausen, D., Amiridis, V., Amodeo, A., Ans-mann, A., Apituley, A., Arshinov, Y., Balis, D., Belegante, L., Bobrovnikov, S., Boselli, A., Bravo-Aranda, J. A., Bösen-berg, J., Carstea, E., Chaikovsky, A., Comerón, A., D’Amico, G., Daou, D., Dreischuh, T., Engelmann, R., Finger, F., Freuden-thaler, V., Garcia-Vizcaino, D., García, A. J. F., Geiß, A., Gi-annakaki, E., Giehl, H., Giunta, A., de Graaf, M., Granados-Muñoz, M. J., Grein, M., Grigorov, I., Groß, S., Gruen-ing, C., Guerrero-Rascado, J. L., Haeffelin, M., Hayek, T., Iarlori, M., Kanitz, T., Kokkalis, P., Linné, H., Madonna, F., Mamouriat, R. E., Matthias, V., Mattis, I., Menéndez, F. M., Mitev, V., Mona, L., Morille, Y., Muñoz, C., Müller, A., Müller, D., Navas-Guzmán, F., Nemuc, A., Nicolae, D., Pan-dolfi, M., Papayannis, A., Pappalardo, G., Pelon, J., Per-rone, M. R., Pietruczuk, A., Pisani, G., Potma, C., Preißler, J., Pujadas, M., Putaud, J., Radu, C., Ravetta, F., Reigert, A., Rizi, V., Rocadenbosch, F., Rodríguez, A., Sauvage, L., Schmidt, J., Schnell, F., Schwarz, A., Seifert, P., Serikov, I., Sicard, M., Silva, A. M., Simeonov, V., Siomos, N., Sirch, T., Spinelli, N., Stoyanov, D., Talianu, C., Tesche, M., De Tomasi, F., Trickl, T., Vaughan, G., Volten, H., Wagner, F., Wandinger, U., Wang, X., Wiegner, M., and Wilson, K. M.): EARLINET Correlative Observations for CALIPSO (2006–2010), World Data Center for Climate (WDCC), Hamburg, Germany, doi:10.1594/WDCC/EN_Calipso_2006-2010, 2014.
Groß, S., Tesche, M., Freudenthaler, V., Toledano, C., Wieg-ner, M., Ansmann, A., Althausen, D., and SeefeldWieg-ner, M.: Char-acterization of Saharan dust, marine aerosols and mixtures of biomass burning aerosols and dust by means of multi-wavelength depolarization-and Raman-measurements during SAMUM-2, Tellus B, 63, 706–724, 2011.
Guerrero-Rascado, J. L., Ruiz, B., and Alados Arboledas, L.: Multi-spectral Lidar characterization of the vertical structure of Saha-ran dust aerosol over southern Spain, Atmos. Environ., 42, 2668– 2681, doi:10.1016/j.atmosenv.2007.12.062, 2008.
Hu, Y., Vaughan, M., Liu, Z., Lin, B., Yang, P., Flittner, D., Hunt, B., Kuehn, R., Huang, J., Wu, D., Rodier, S., Powell, K., Trepte, C., and Winker, D.: The depolarization –attenuated backscatter rela-tion: CALIPSO lidar measurements vs. theory, Opt. Express, 9, 5327–5332, doi:10.1364/OE.15.005327, 2007.
Hu, Y., Winker, D., Vaughan, M., Lin, B., Omar, A., Trepte, C., Flittner, C., Yang, P., Nasiri, L. N., Baum, B., Holz, R., Sun, W., Liu, Z., Wang, Z., Young, S., Stamnes, K., Huang, J., and Kuehn, R.: CALIPSO/CALIOP cloud phase discrimi-nation algorithm, J. Atmos. Ocean. Tech., 26, 2293–2309, doi:10.1175/2009JTECHA1280.1, 2009.
Illingworth, A. J., Barker, H. W., Beljaars, A., Ceccaldi, M., Chep-fer, H., Clerbaux, N., Cole, J., Delanoë, J., Domenech, C., Dono-van, D. P., Fukuda, S., Hirikata, M., Hogan, R. J., Huener-bein, A., Kollias, P., Kubota, T., Nakajima, T., Nishizawa, T. Y., Ohno, Y., Okamoto, H., Oki, R., Sato, K., Satoh, M., Shep-hard, M. W., Velázquez-Blázquez, A., Wandinger, U., Wehr, T., and Van Zadelhoff, G. J.: The earthcare satellite: the next step forward in global measurements of clouds, aerosols, precipi-tation, and radiation, B. Am. Meteorol. Soc., 96, 1311–1332, doi:10.1175/BAMS-D-12-00227.1, 2015.
Kanitz, T., Ansmann, A., Foth, A., Seifert, P., Wandinger, U., Engelmann, R., Baars, H., Althausen, D., Casiccia, C., and Zamorano, F.: Surface matters: limitations of CALIPSO V3 aerosol typing in coastal regions, Atmos. Meas. Tech., 7, 2061– 2072, doi:10.5194/amt-7-2061-2014, 2014.
Kim, M.-H., Kim, S.-W., Yoon, S.-C., and Omar, A. H.: Compari-son of aerosol optical depth between CALIOP and MODIS-Aqua for CALIOP aerosol subtypes over the ocean, J. Geophys. Res.-Atmos., 118, 13241–13252, doi:10.1002/2013JD019527, 2013. Kittaka, C., Winker, D. M., Vaughan, M. A., Omar, A., and
Re-mer, L. A.: Intercomparison of column aerosol optical depths from CALIPSO and MODIS-Aqua, Atmos. Meas. Tech., 4, 131– 141, doi:10.5194/amt-4-131-2011, 2011.
Liu, Z., Liu, D., Huang, J., Vaughan, M., Uno, I., Sugimoto, N., Kit-taka, C., Trepte, C., Wang, Z., Hostetler, C., and Winker, D.: Air-borne dust distributions over the Tibetan Plateau and surround-ing areas derived from the first year of CALIPSO lidar obser-vations, Atmos. Chem. Phys., 8, 5045–5060, doi:10.5194/acp-8-5045-2008, 2008.
Liu, Z., Vaughan, M., Winker, D., Kittaka, C., Getzewich, B., Kuehn, R., Omar, A., Powell, K., Trepte, C., and Hostetler, C.: The CALIPSO lidar cloud and aerosol discrimination: version 2 algorithm and initial assessment of performance, J. Atmos. Ocean. Tech., 26, 1198–1213, 2009.
Lopes, F. J. S., Landulfo, E., and Vaughan, M. A.: Evaluat-ing CALIPSO’s 532 nm lidar ratio selection algorithm usEvaluat-ing AERONET sun photometers in Brazil, Atmos. Meas. Tech., 6, 3281–3299, doi:10.5194/amt-6-3281-2013, 2013.
Ma, X., Bartlett, K., Harmon, K., and Yu, F.: Comparison of AOD between CALIPSO and MODIS: significant differences over ma-jor dust and biomass burning regions, Atmos. Meas. Tech., 6, 2391–2401, doi:10.5194/amt-6-2391-2013, 2013.
Madonna, F., Amodeo, A., Boselli, A., Cornacchia, C., Cuomo, V., D’Amico, G., Giunta, A., Mona, L., and Pappalardo, G.: CIAO: the CNR-IMAA advanced observatory for atmospheric research, Atmos. Meas. Tech., 4, 1191–1208, doi:10.5194/amt-4-1191-2011, 2011.
Mamouri, R. E., Amiridis, V., Papayannis, A., Giannakaki, E., Tsaknakis, G., and Balis, D. S.: Validation of CALIPSO space-borne-derived attenuated backscatter coefficient profiles using a ground-based lidar in Athens, Greece, Atmos. Meas. Tech., 2, 513–522, doi:10.5194/amt-2-513-2009, 2009.
Matthias, V., Freudenthaler, V., Amodeo, A., Balin, I., Balis, D., Bösenberg, J., Chaikovsky, A., Chourdakis, G., Comeron, A., Delaval, A., De Tomasi, F., Eixmann, R., Hågård, A., Komguem, L., Kreipl, S., Matthey, R., Rizi, V., Rodrigues, J., Wandinger, U., and Wang, X.: Aerosol lidar intercomparison in the framework of the EARLINET project. 1. Instruments, Appl. Optics, 43, 961–976, doi:10.1364/AO.43.000961, 2004. Mattis, I., Müller, D., Ansmann, A., Wandinger, U., Preißler, J.,
Seifert, P., and Tesche, M.: Ten years of multiwavelength Raman lidar observations of free-tropospheric aerosol layers over cen-tral Europe: geometrical properties and annual cycle, J. Geophys. Res.-Atmos., 113, d20202, doi:10.1029/2007JD009636, 2008. Mona, L., Amodeo, A., Pandolfi, M., and Pappalardo, G.:
Saha-ran dust intrusions in the MediterSaha-ranean area: three years of Ra-man lidar measurements, J. Geophys. Res.-Atmos., 111, d16203, doi:10.1029/2005JD006569, 2006.
Mona, L., Pappalardo, G., Amodeo, A., D’Amico, G., Madonna, F., Boselli, A., Giunta, A., Russo, F., and Cuomo, V.: One year of CNR-IMAA multi-wavelength Raman lidar measurements in coincidence with CALIPSO overpasses: Level 1 products com-parison, Atmos. Chem. Phys., 9, 7213–7228, doi:10.5194/acp-9-7213-2009, 2009.
Mona, L., Amodeo, A., D’Amico, G., Giunta, A., Madonna, F., and Pappalardo, G.: Multi-wavelength Raman lidar observations of the Eyjafjallajökull volcanic cloud over Potenza, southern Italy, Atmos. Chem. Phys., 12, 2229–2244, doi:10.5194/acp-12-2229-2012, 2012a.
Mona, L., Liu, Z., Müller, D., Omar, A., Papayannis, A., Sugi-moto, N., Pappalardo, G., and Vaughan, M.: Lidar Measurements for Desert Dust Characterization: An Overview, Adv. Meteorol., 2012, pp. 36, doi:10.1155/2012/356265, 2012b.
Mona, L., Papagiannopoulos, N., Basart, S., Baldasano, J., Bini-etoglou, I., Cornacchia, C., and Pappalardo, G.: EARLINET dust observations vs. BSC-DREAM8b modeled profiles: 12-year-long systematic comparison at Potenza, Italy, Atmos. Chem. Phys., 14, 8781–8793, doi:10.5194/acp-14-8781-2014, 2014. Müller, D., Ansmann, A., Mattis, I., Tesche, M., Wandinger, U.,
Althausen, D., and Pisani, G.: Aerosol-type-dependent lidar ra-tio observed with Raman lidar, J. Geophys. Res., 112, D16202, doi:10.1029/2006JD008292, 2007a.
Müller, D., Mattis, I., Ansmann, A., Wandinger, U., Ritter, C., and Kaiser, D.: Multiwavelength Raman lidar observations of par-ticle growth during long-range transport of forest-fire smoke in the free trosposphere, Geophys. Res. Lett., 34, L05803, doi:10.1029/2006GL027936, 2007b.
Navas-Guzmán, F., Bravo-Aranda, J., Guerrero-Rascado, J., Granados-Munoz, M., and Alados-Arboledas, L.: Statisti-cal analysis of aerosol optiStatisti-cal properties retrieved by Ra-man lidar over Southeastern Spain, Tellus B, 65, 21234, doi:10.3402/tellusb.v65i0.21234, 2013.
Omar, A. H., Won, J.-G., Winker, D. M., Yoon, S.-C., Dubovik, O., and McCormick, M. P.: Development of global aerosol models using cluster analysis of Aerosol Robotic Network (AERONET) measurements, J. Geophys. Res.-Atmos., 110, d10S14, doi:10.1029/2004JD004874, 2005.
Omar, A., Winker, D., Kittaka, C., Vaughan, M., Liu, Z., Hu, Y. X., Trepte, C., Rogers, R., Ferrare, R., Lee, K., Kuehn, R., and Hostetler, C.: The CALIPSO automated aerosol classification and lidar ratio selection algorithm, J. Atmos. Ocean. Tech., 26, 1994–2014, doi:10.1175/2009jtecha1231.1, 2009.
Omar, A. H., Winker, D. M., Tackett, J. L., Giles, D. M., Kar, J., Liu, Z., Vaughan, M. A., Powell, K. A., and Trepte, C. R.: CALIOP and AERONET aerosol optical depth comparisons: one size fits none, J. Geophys. Res.-Atmos., 118, 4748–4766, doi:10.1002/jgrd.50330, 2013.
Pappalardo, G., Amodeo, A., Pandolfi, M., Wandinger, U., Ansmann, A., Bösenberg, J., Matthias, V., Amiridis, V., De Tomasi, F., Frioud, M., Iarlori, M., Komguem, L., Papayan-nis, A., Rocadenbosch, F., and Wang, X.: Aerosol lidar intercom-parison in the framework of the EARLINET project. 3. Raman lidar algorithm for aerosol extinction, backscatter, and lidar ratio, Appl. Optics, 43, 5370–5385, doi:10.1364/AO.43.005370, 2004. Pappalardo, G., Wandinger, U., Mona, L., Hiebsch, A., Mattis, I., Amodeo, A., Ansmann, A., Seifert, P., Linné, H., Apituley, A., Alados Arboledas, L., Balis, D., Chaikovsky, A., D’Amico, G., De Tomasi, F., Freudenthaler, V., Giannakaki, E., Giunta, A., Grigorov, I., Iarlori, M., Madonna, F., Mamouri, R., Nasti, L., Papayannis, A., Pietruczuk, A., Pujadas, M., Rizi, V., Roca-denbosch, F., Russo, F., Schnell, F., Spinelli, N., Wang, X., and Wiegner, M.: EARLINET correlative measurements for CALIPSO: first intercomparison results, J. Geophys. Res., 115, D00H19, doi:10.1029/2009JD012147, 2010.
Pappalardo, G., Amodeo, A., Apituley, A., Comeron, A., Freuden-thaler, V., Linné, H., Ansmann, A., Bösenberg, J., D’Amico, G., Mattis, I., Mona, L., Wandinger, U., Amiridis, V., Alados-Arboledas, L., Nicolae, D., and Wiegner, M.: EARLINET: to-wards an advanced sustainable European aerosol lidar network, Atmos. Meas. Tech., 7, 2389–2409, doi:10.5194/amt-7-2389-2014, 2014.
Perrone, M. and Bergamo, A.: Direct radiative forcing during Sa-hara dust intrusions at a site in the Central Mediterranean: anthro-pogenic particle contribution, Atmos. Res., 111, 783–798, 2011. Preißler, J., Wagner, F., Pereira, S. N., and Guerrero-Rascado, J. L.: Multi-instrumental observation of an exceptionally strong Saha-ran dust outbreak over Portugal, J. Geophys. Res.-Atmos., 116, D24204, doi:10.1029/2011JD016527, 2011.
Preißler, J., Wagner, F., Guerrero-Rascado, J. L., and Silva, A. M.: Two years of free-tropospheric aerosol layers observed over Portugal by lidar, J. Geophys. Res.-Atmos., 118, 3676–3686, doi:10.1002/jgrd.50350, 2013.
Redemann, J., Vaughan, M. A., Zhang, Q., Shinozuka, Y., Rus-sell, P. B., Livingston, J. M., Kacenelenbogen, M., and Re-mer, L. A.: The comparison of MODIS-Aqua (C5) and CALIOP (V2 & V3) aerosol optical depth, Atmos. Chem. Phys., 12, 3025– 3043, doi:10.5194/acp-12-3025-2012, 2012.
Schuster, G. L., Vaughan, M., MacDonnell, D., Su, W., Winker, D., Dubovik, O., Lapyonok, T., and Trepte, C.: Comparison of CALIPSO aerosol optical depth retrievals to AERONET mea-surements, and a climatology for the lidar ratio of dust, Atmos.
Chem. Phys., 12, 7431–7452, doi:10.5194/acp-12-7431-2012, 2012.
Stoffelen, A., Pailleux, J., Källén, E., Vaughan, J. M., Isaksen, L., Flamant, P., Wergen, W., Andersson, E., Schyberg, H., Cu-loma, A., Meynart, R., Endemann, M., and Ingmann, P.: The at-mospheric dynamics mission for global wind field measurement, B. Am. Meteorol. Soc., 86, 73–87, doi:10.1175/BAMS-86-1-73, 2005.
Tesche, M., Ansmann, A., Müller, D., Althausen, D., Engel-mann, R., Freudenthaler, V., and Groß, S.: Vertically resolved separation of dust and smoke over Cape Verde using multi-wavelength Raman and polarization lidars during Saharan Min-eral Dust Experiment 2008, J. Geophys. Res., 114, D13202, doi:10.1029/2009JD011862, 2009a.
Tesche, M., Ansmann, A., Muller, D., Althausen, D., Mattis, I., Heese, B., Freudenthaler, V., Wiegner, M., Esselborn, M., Pisani, G., and Knippertz, P.: Vertical profiling of Saharan dust with Raman lidars and airborne HSRL in southern Morocco during SAMUM, Tellus B, 61, 144–164, doi:10.1111/j.1600-0889.2008.00390.x, 2009b.
Vaughan, M., Powell, K., Kuehn, R., Young, S., Winker, D., Hostetler, C., Hunt, W., Liu, Z., McGill, M., and Getzewich, B.: Fully automated detection of cloud and aerosol layers in the (CALIPSO) lidar measurements, J. Atmos. Ocean. Tech., 26, 2034–2050, 2009.
Wandinger, U., Tesche, M., Seifert, P., Ansmann, A., Müller, D., and Althausen, D.: Size matters: Influence of multiple scattering on CALIPSO light-extinction profiling in desert dust, Geophys. Res. Lett., 37, L10801, doi:10.1029/2010GL042815, 2010. Wandinger, U., Hiebsch, A., Mattis, I., Pappalardo, G., Mona, L.,
and Madonna, F.: Aerosols and Clouds: Long-Term Database from Spaceborne Lidar Measurements, Tech. rep., final report, ESTEC Contract 21487/08/NL/HE, ESA Publications Division, Noordwijk, the Netherlands, 2011.
Wiegner, M., Groß, S., Freudenthaler, V., Schnell, F., and Gasteiger, J.: The May/June 2008 Saharan dust event over Munich: intensive aerosol parameters from lidar measurements, J. Geophys. Res.-Atmos., 116, D23213, doi:10.1029/2011JD016619, 2011.
Winker, D., Pelon, J., and McCormick, M.: Initial results from CALIPSO, in: 23rd International Laser Radar Conference, 24– 28 July 2006, Nara, Japan, 991–994, 2006.
Winker, D., Hunt, W., and McGill, M.: Initial performance assessment of CALIOP, Geophys. Res. Lett., 34, L19803, doi:10.1029/2007GL030135, 2007.
Winker, D., Pelon, J., Coakley, J., Ackerman, S., Charlson, R., Co-larco, P., Flamant, P., Fu, Q., Hoff, R., Kittaka, C., Kubar, T., LeTreut, H., McCormick, M., Megie, G., Poole, L., Powell, K., Trepte, C., Vaughan, M., and Wielicki, B.: The CALIPSO Mis-sion: a global 3-D view of aerosols and clouds, B. Am. Meteorol. Soc., 91, 1211–1229, 2010.
Winker, D. M., Tackett, J. L., Getzewich, B. J., Liu, Z., Vaughan, M. A., and Rogers, R. R.: The global 3-D distribu-tion of tropospheric aerosols as characterized by CALIOP, At-mos. Chem. Phys., 13, 3345–3361, doi:10.5194/acp-13-3345-2013, 2013.
Observations (CALIPSO) data: algorithm description, J. Atmos. Ocean. Tech., 26, 1105–1119, 2009.
Young, S., Vaughan, M., Kuehn, R., and Winker, D.: The Retrieval of profiles of particulate extinction from Cloud Aerosol Lidar and Infrared Pathfinder Satellite Observations (CALIPSO) data: un-certainty and error sensitivity analyses, J. Atmos. Ocean. Tech., 30, 395–428, 2013.