THE DECISION SUPPORT IN ELECTRICITY GENERATION: A MODEL
OF INTEGRATED PARAMETERS AND INDICATORS
Renata Maria Abrantes Baracho School of Information Science
Federal University of Minas Gerais
Belo Horizonte, Brazil [email protected]
Rogério Amaral Bonatti School of Information Science
Federal University of Minas Gerais
Belo Horizonte, Brazil [email protected]
Francisco Ricardo A. C. Baracho School of Electrical Engineering
Federal University of Minas Gerais
Belo Horizonte, Brazil f [email protected]
Christiano Pessanha School of Information Science
Federal University of Minas Gerais
Belo Horizonte, Brazil [email protected]
Marina M. Starling Rezende School of Electrical Engineering
Federal University of Minas Gerais
Belo Horizonte, Brazil [email protected]
Cláudio Homero Ferreira Silva The Companhia Energética de
Minas Gerais – CEMIG Belo Horizonte, Brazil
Abstract: This paper presents the construction of a model to support corporate managers in the energy sector. It is expected that the identification and measurement of parameters involved in decision making in this sector can assist managers in new projects of power generation. Knowledge management and strategic planning originate the resources necessary for correct alignment with the goals and expectations of organizations. It is thus possible to define different scenarios to be presented to managers. Through interviews with consultants and experts in the energy sector it was possible to define and validate a set of indicators which will be used in the proposed model. Hence a questionnaire to a representative sample of managers and others involved in the decision making processes of companies in the electricity power sector is filled in. In addition, contributions from researchers from Information Science, Electrical Engineering and Administration are of prime importance as well and are carried out in this work. The management model proposed is part of an ongoing research on strategic planning and on decision-making to enterprises of power generation from renewable sources1.
Key-Words: Knowledge Management, Decision Making, Strategic Planning, Electric Power.
I. INTRODUCTION
The electricity sector is regulated and is always expanding, usually due to population and industrial production growth in a given country. The use of different energy sources for electricity production has been the focus of many studies, including government studies and also research in Information Science (QUEIROZ, 2001; SILVA et al., 2010; TOLMASQUIM, 2012).
Energy sources can be divided into renewable and non-renewable. The latter can be traditional or alternative. For example, hydroelectric power is a renewable resource and a traditional source; on the other hand, wind power is a renewable resource and an alternative source at the moment. According to Tomalsquim (2012), Brazil has a promising scenario that offers alternatives for energy production as well as abundant
1This work is partially supported by Fundação de Amparo à Pesquisa
do Estado de Minas Gerais (FAPEMIG), Governo do Estado de Minas Gerais, Brazil.
resources from various sources. (TOLMASQUIM, 2012, p. 249).
This fact is evidenced through publications of national regulators on their websites (Revista Brasileira de Energia - Brazilian Society of Strategic Planning - R & D Magazine and Energy Annual Magazine - National Electric Energy Agency/ANEEL).
In the year 2000, there were changes in regulation and also other factors that emphasize and encourage the investment in alternative sources in the production of electricity. In the energy sector, a set of indicators will be used by the utility companies to make strategic decisions that encourage investments in power generation. This study has focused on the generation of electricity from renewable sources.
Davenport and Prusak (1998) argue that knowledge organization by firms provides strategic advantages and generates continuous returns. These authors describe knowledge as one of the factors responsible for guiding businesses in how to act and how to improve in future scenarios (DAVENPORT, PRUSAK; 1998). Awareness of possibilities and opportunities is always present in Strategic Planning. Oliveira (2006) points out that "[...] the strategic planning corresponds to the establishment of a set of actions to be taken by the executive to the situation in which the future tends to be different from the past; however, the company has conditions and means of acting on the variables and factors that can exert some influence; [...] also implies the need for a decision-making process that occurs before, during and after developing and implementing it in the company” (OLIVEIRA, 2006, p. 35).
II. LITERATURE REVIEW
The literature review includes concepts of knowledge management and strategic planning. It also provides an overview of the electricity sector.
KNOWLEDGE MANAGEMENT
According to Bukowitz and Williams (2002), Knowledge
Management (KM) “is an evolving field, which was created by
the union of several other [...] every day are generated new insights from the experiences of organizations for them to learn,
discard, retain, adapt and advance” (BUKOWITZ;
WILLIAMS, 2002, p.16). The authors argue that organizations consider knowledge management as a source of competitive advantage. Efficient processing of information is required to obtain a result. The organization can provide tools to strengthen the free thinking that is important to establish an environment in which creativity, experimentation and responsiveness are encouraged (BUKOWITZ; WILLIAMS, 2002).
Nonaka and Takeuchi (1997) define organizational knowledge creation as a process that happens within a community in which people interact with each other and can expand their boundaries beyond the organization. Knowledge management is a process that can expand the knowledge created by individuals, implementing it as part of the knowledge network of an organization (NONAKA; TAKEUCHI, 1997). The authors define tacit knowledge and explicit knowledge. Tacit knowledge is personal knowledge, subjective expertise, the insights and intuitions that a person has after being immersed in an activity for a long period of time. This type of knowledge is difficult to articulate because it is expressed by action-based skills and cannot be reduced to rules and standards. Explicit knowledge is formal knowledge encoded in mathematical formulas, rules and specifications and can be expressed formally using a system of symbols. Tacit knowledge aims to formalize the knowledge of individuals. The evaluation, prototyping and suitability of these concepts for organizational purposes are transferred to other levels of the company and trigger new cycles of knowledge creation (NONAKA e TAKEUCHI, 1997).
For Tarapanoff (2006), knowledge management “[...] is an
independent activity, but when related to decision making, is strongly linked to the process of information management and data analysis. Intelligence [strategy] can be considered the synthesis of organizing information and knowledge, generating new knowledge. This can indicate new avenues for business” (TARAPANOFF, 2006, p.30).
Knowledge management can be considered a form of administration of the use of tacit knowledge and of disseminating practices within organizations. This administration needs the identification and mapping of knowledge, which in turn can provide input for the determination of new organizational practices.
Capurro (2011) claims that the industrial society has become a society based on knowledge. Knowledge management deals with issues of the application and form of
this knowledge and how it will be used; it is interested in its subjective side. This means that the organization often is committed to the discovery and application of knowledge (CAPURRO, 2011). This is the sense of working with a model to support strategic decisions in an industry that is considered a foundation for the current industrial structure.
One of the applications of the use of knowledge is the decision-making process, which depends on individual skills.
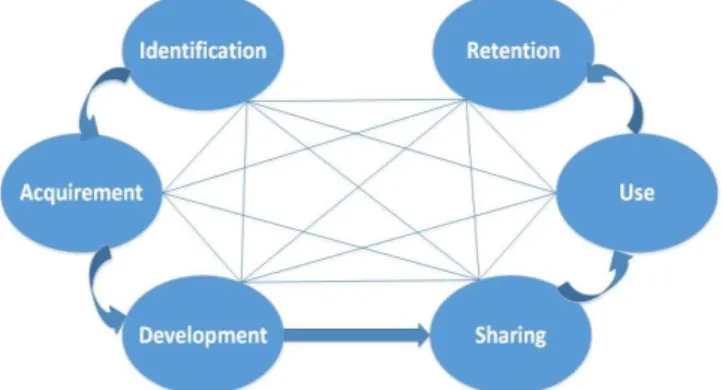
Probst et al. (2002) claim that these individual skills are important resources within the organization, however they are volatile. This means that individuals constantly need to evaluate and upgrade their skills, otherwise their skills become obsolete. Knowledge management involves the constant evaluation of individual competencies and of the organization itself (PROBST et al., 2002). The evaluation of knowledge within an organization can be described and separated into phases; these will be treated in more detail below in this paper. The adapted model shown in Figure 1 defines the connections between the stages of knowledge within an enterprise.
This model assumes the identification of these processes as a tool for visualizing new skills and opportunities.
Figure 1 –Knowledge Management Process – Adapted from Knowledge Management - Probst et al. – 2002 - p.33 and 36.
Concerning the acquisition of knowledge, the author provides information about how organizations work with external sources of information. Regarding the development phase, the author shows how the skills of the organization should be seen and used to identify opportunities. The acceptance of new technologies, business changes and, specifically, the appropriateness of the utilities for government regulation of the energy sector in the country demonstrate the advantages involved. These points to the sharing of needs. The author sets out the ways to apply the knowledge acquired and stored in the organizational context (PROBST et al., 2002).
STRATEGIC PLANNING
all involved: “A good strategy can ensure the best allocation of
resources in anticipation of planning or lack of planning, considering the circumstances of the environment and
opponents” (CHIAVENATO; SAPIRO, 2003, pp.40-42). Strategic planning enables the organization to make progress and achieve its goals satisfactorily, saving time and resources (KWASNICKA, 2007). Strategic planning should guide individual efforts toward a common result, within the goals of the organization. Planning should provide the correct understanding of the purposes and policies of the organization, by all involved. This allows the understanding and implementation of the strategic framework for the development of activities, taking the priorities into consideration (OLIVEIRA, 2006).
Trend indicators, assessment of business environment, industry development, competitive analysis and understanding of the strategic groups are part of the critical understanding of the opportunities and threats regarding the market (CHIAVENATO; SAPIRO, 2003).
According to Saaty (1990), strategic directions can deal with elements, which have different dimensions, involved in the decision making processes of organizations. He defined the AHP (Analytical Hierarchy Process), which shows the purpose of creating a hierarchical classification of these elements.
“Arranging the goals, attributes, issues, and stakeholders in a
hierarchy serves two purposes. It provides an overall view of the complex relationships inherent in the situation; and helps the decision maker assess whether the issues in each level are of the same order of magnitude, so he can compare such
homogeneous elements accurately” (SAATY, 1990, p.9). The use of a hierarchy of indicators and parameters, that are
input into the structure of the ‘Decision Model for Generating
Electricity’ (MDGEE) presented in this paper is based on Saaty’s AHP applications (1990) for making decisions. In the studies by Francischini and Barbarán (2003) and Rafaeli and Müller (2007), it is possible to identify the exemplification through practical cases of prioritization “relative to elements of
decision making in relation to a goal” (FRANCISCHINI; BARBARÁN, 2003, p.3). The analysis of the evaluators and managers, through partial associations of these elements in pairs, will be the ranking methodology applied by MDGEE.
Policies that shape the decision-making processes of an organization seek to achieve the best results from investments and mitigate the negative effects that can result from uncertainties in the market. The information system consists of internal and external sources that are used by executives to establish favorable conditions for selecting one decision over another (OLIVEIRA, 2006). That is the focus of the present study and application of strategic planning to implement a management model for concessionaires that work with internal and external information.
In Brazil, the challenge to enable the energy expansion that is necessary to meet the demand is based on new guidelines for energy conservation and efficiency. Not only are those guidelines determined by the government agencies the Ministry of Mines and Energy (Ministério de Minas e Energia - MME) and the National Electric Energy Agency (Agência Nacional de
Energia Elétrica - ANEEL), but also by studies from the Energy Research Company (Empresa de Pesquisa Energética - EPE). The investments of energy concessionaires (generation, production and transmission) in Brazil have been regulated by laws - Law 9.991 /2000 and Law 12.783/2013; and by regulation (www.aneel.gov.br, for example). This regulation provides important indicators and is used in items that refer to the MDGEE sectorial indicators.
ELETRICAL SECTOR
The electrical sector faces the challenge of adapting to
country’s expected growth for the years ahead. Studies, such as the ten-year Plan for Energy Expansion (PDE) developed by EPE, show that Brazil has been able to meet the growing demand in the energy sector through the strong interest in renewable energy sources (mainly hydro, wind, ethanol and biomass). Thus, Brazil has a promising scenario for the production of alternative energy and an abundance of resources from various sources (Tolmasquim, 2012).
Various government documents published by ANEEL and MME provide information on the indicators and parameters analyzed in this study. The literature review was done by analyzing the research sector and government documents mentioned above. The documents used are presented according to the agencies that publish them.
ANEEL was established by Law # 4.927 on December 26th, 1996. That law created the agency and established the regulation of the system of public service concessions for electrical energy. Among the publications of the agency are the Journal of Research and Development, which presents the work and results of projects of electric companies.
The MME and EPE have different publications that are the sources of the references for the indicators used in this study. The main document is the PDE, which was first published in 2006 (reference year 2005) and made projections until the year 2015. Based on this document and its subsequent annual publications, we obtained the following indicators:
Economy indicators:
- Population Growth ; - Per Capita GDP;
- Electricity Consumption; *
- Electricity Consumption per Capita ; - Electric intensity of GDP (KW / R$). * includes auto production.
Indicators of the Electricity Sector:
- Load Power (average MW); - Load Demand;
- Installed Capacity;
- Estimated Investment / Benefits; - Pollutant Emissions (mainly CO2); - Projections of Total Consumption.
country and regions that meet the criteria of sustainability and security of supply.
These documents and other data sources used, including the National Energy Balance (BEN) for the years 2012-13 and useful energy balances that make use of data from BEN, say Brazil has a fit setting for the energy growth forecast.
Nevertheless, the Government is already on alert in the BEN base for the year 2012, as can be seen in Annex IV, where it says: "Final energy and useful energy have increased over these two decades. On the other hand, the Potential Energy Savings decreases as the income of the processes approach their
paradigms” (MME/EPE, 2013). That means, in the scenario projections for the most adopted sources (hydro and thermal) that investments will be needed in other sources of electricity generation and this is, thus, considered a decision model suitable for use by utilities for such endeavors.
III. METHODOLOGICAL PROCEDURES
Scientific research consists of formal procedures that have methods of reflective thinking and is on track to identify reality or partial truths (MARCONI; LAKATOS, 2010). This paper seeks to provide a set of indicators and parameters to support strategic decisions related to the Electricity Sector Model. To this end, one should start from an exploratory study according
to Selltiz et al. (1974) that, besides having “as objective
formulating a problem for more precise investigation or for
creating hypotheses”, can also provide “other functions such as
increasing the knowledge of the researcher about the phenomenon [...]; better understanding of concepts; setting
priorities for future research” (SELLTIZ et al., 1974, p.60). In order to identify and sort the indicators and parameters mentioned above, the main sources used were the government documents cited, interviews and questionnaires with specialists and consultants having considerable experience working in the Electricity Sector and Decision Making.
IDENTIFICATION OF INDICATORS AND PARAMETERS
The first step of this study consisted of preliminary unstructured interviews with experts and consultants in the Electricity Sector, for the identification of the main documents used as sources of information for managers. According to Triviños (1992), the semi-structured interview is characterized by the use of basic questions that are supported by theories and hypotheses which relate to the research topic. These questions allow new hypotheses based on the responses of respondents (TRIVIÑOS, 1992).
The MME and EPE, through the publications of the PDE, the National Energy Plan (PNE), the BNE and other documents set forth in the subsection above, provided the Electricity Sector Economic Indicators and Sector Indicators that were denominated as the initial theme of the interviews. Five interviews were conducted.
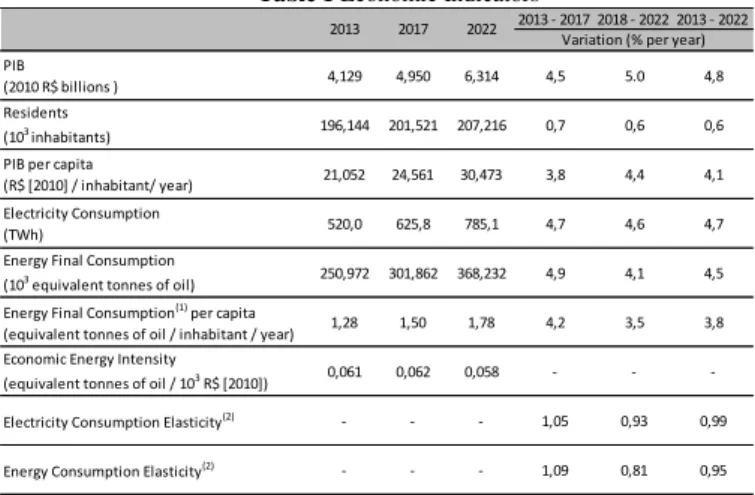
After organizing and building an initial structure, it was possible to distinguish two groups of indicators (Economic and Sector). The elements that were selected, after the pre-assessment of the respondents, are presented in Table 1 below.
The respondents were a business consultant and researcher in the energy industry and an expert in electrical engineering and strategic management. This table shows the indices used in all PNE from its first publication in 2006 until the last, published in 2013, and always use the previous year as the basis for the data presented. According to the responses, these elements are very important for decision making as well as for the regulations and additional indicators.
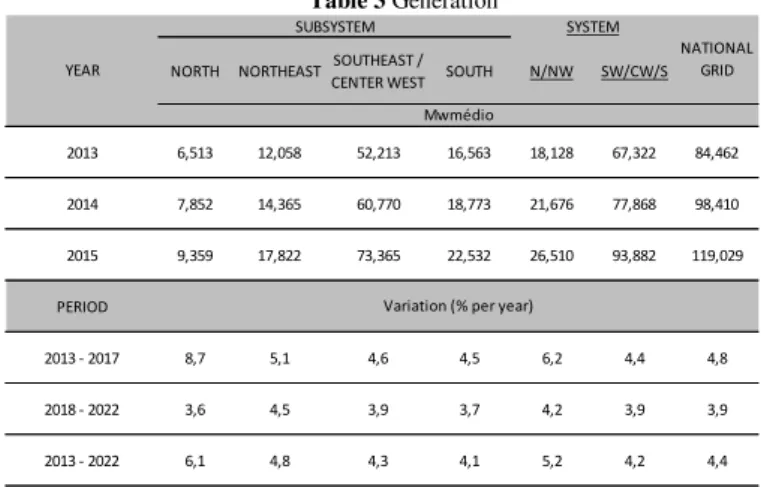
The power load (expressed in MW) corresponds to the average value of power plants required for a relatively long time interval (day, week, month, year, etc.). The load demand is required for the generation from a system in a given time or a short time interval (CASTRO et al., 2010). The tables 1, 2 and 3 refer to the National Interconnected System (SIN) and additional systems.
Table 1 EconomicIndicators
Table 2 Load
Graph 1 below shows the installed capacity of different sources that proved to have great impact.
The identification of parameters was achieved through interviews with a consultant to energy companies and an industry expert. The final eight categories are identified in 2013 - 2017 2018 - 2022 2013 - 2022
PIB
(2010 R$ billions ) 4,129 4,950 6,314 4,5 5.0 4,8 Residents
(103 inhabitants) 196,144 201,521 207,216 0,7 0,6 0,6
PIB per capita
(R$ [2010] / inhabitant/ year) 21,052 24,561 30,473 3,8 4,4 4,1 Electricity Consumption
(TWh) 520,0 625,8 785,1 4,7 4,6 4,7 Energy Final Consumption
(103 equivalent tonnes of oil) 250,972 301,862 368,232 4,9 4,1 4,5
Energy Final Consumption(1) per capita
(equivalent tonnes of oil / inhabitant / year) 1,28 1,50 1,78 4,2 3,5 3,8 Economic Energy Intensity
(equivalent tonnes of oil / 103 R$ [2010]) 0,061 0,062 0,058 - -
-Electricity Consumption Elasticity(2) - - - 1,05 0,93 0,99
Energy Consumption Elasticity(2) - - - 1,09 0,81 0,95
Source: PDE / EPE 2013 - page 38.
2013 2017 2022
Variation (% per year)
(2) the elasticity figure is related to the average of the indicated period. Notes: (1) the figures of final consumption include the energy sector consumption.
NORTH NORTHEAST SOUTHEAST / CENTER WEST SOUTH
2013 4,935 9,402 38,740 10,612 63,688
2014 6,497 11,180 45,394 12,268 75,248
2015 7,613 13,870 54,796 14,724 91,003
PERIOD
2013 - 2017 9,2 4,5 4,2 3,7 4,5
2018 - 2022 3,5 4,4 3,8 3,7 3,9
2013 - 2022 6,3 4,4 4.0 3,7 4,2
YEAR
Source: PDE / EPE 2013 - page 45.
SUBSYSTEM
NATIONAL GRID
Mwmédio
Table 4. Through the interviews with experts and consultants of the Electricity Sector, it was possible to establish the additional indicators from the above mentioned documents.
Table 3 Generation
Graph 1 Electricity Installed Capacity – 31/12/2012 – National Grid
Notes: a. The Itaipu Brazilian share of installed capacity included.
b. The Itaipu Paraguay generation imported by Brazil.
c.1 MW of solar energy included. Source: PDE / EPE 2013 - page 74.
Table 4 Parameters
Parameters in Decision-Making
Availability of the Energy Resource
Vocation of the Company to Generate with the Specified Source
Return
Source Type (Renewable / Alternative or Traditional)
Environmental impact
Technology Mastering
Regulatory Compliance
Visibility of the Company
Source: Authors.
The determination of these elements were carried out by a formalized questionnaire used to validate the sample of responses of managers and people involved in decision making on new investments in the Power Sector.
IV. RESULTS
DECISION MODEL FOR THE DEVELOPMENT OF ELECTRICITY GENERATION
The 'Decision Model for Generating Electricity' was drawn from the analysis of results in studies by Pereira (2006, 2013), Probst et al.(2002), Oliveira (2006), Jamil (2006) and other studies dealing with strategic decisions in organizations.
The MDGEE has three dimensions. The first refers to what Oliveira (2006), in his model of information systems mentioned earlier, describes as management information and consists of Economic and Energy Sector Indicators obtained from the publications of the MME and EPE, especially the PDE, PNE and BNE, reviewed in his last publication and evaluated by respondents by means of a questionnaire. For the model, in addition to these documents, other sources of information, publications and industry regulations are presented. This dimension also concerns what Mafra (2013) proposes as the first moment of the general model for decision making, where information seeking determines the steps.
The second dimension of MDGEE refers to the application of measurement of parameters identified in the methodology section and validated by industry experts. The measurement of these parameters and the techniques of AHP are responsible for defining the decision scenarios that make up the last dimension of MDGEE. In addition to the perspectives proposed in PDEs, the High, Low and Reference Trajectories, it is expected that the manager can work with the other two scenarios presented in the model as Preferred Path and Trajectory Contingency. The definition of these two additional scenarios has been proposed and discussed, based on the first model that gave rise to this version and is presented in this study as a whole.
The section of the model set forth by Mafra (2013), identified as "Decision", corresponds to the MDGEE and is considered in addition to the sources of information obtained in the decision making, those that most influenced the manager. Other factors that influence decision making, such as the experience of the manager, the time available to decide and intuition are crucial for the application of the model.
Figure 2 and Figure 3 show the proposed MDGEE, considering all the aspects described herein. It is important to stress that the MDGEE is a decision-making model, involving new ventures in the energy sector. Thus, the Post-Decision time that Mafra (2013) describes is not addressed by this version of MDGEE.
V. CONCLUSION
Considering that the model is well accepted by managers and highly skilled people in the energy sector, the collaboration with researchers from the CI and the Electrical Engineering and Administration, demonstrates the relevance of focusing on studies related to decision making and knowledge management in the electricity sector.
NORTH NORTHEAST SOUTHEAST /
CENTER WEST SOUTH N/NW SW/CW/S
2013 6,513 12,058 52,213 16,563 18,128 67,322 84,462
2014 7,852 14,365 60,770 18,773 21,676 77,868 98,410
2015 9,359 17,822 73,365 22,532 26,510 93,882 119,029
PERIOD
2013 - 2017 8,7 5,1 4,6 4,5 6,2 4,4 4,8
2018 - 2022 3,6 4,5 3,9 3,7 4,2 3,9 3,9
2013 - 2022 6,1 4,8 4,3 4,1 5,2 4,2 4,4
Source: PDE / EPE 2013 - page 45.
Note: Include the interconnection of the Tucuruí-Macapá-Manaus transmission to the North subsystem and the interconnection of Boa Vista.
YEAR
SUBSYSTEM
NATIONAL GRID
Mwmédio
Figure 3: MDGEE part I - elaborated by these authors, 2014.
Figure 4: MDGEE part II - elaborated by authors, 2014.
The application of MDGEE will permit a comparison between the projections of the PDE, from its first publication until the most current one. We intend to demonstrate that the factor called Marginal Cost of Expansion (CME) defined by EPE has approached the cost of alternative renewable sources. Preparation of scenarios to be defined by measuring the parameters used in the decision making process in the energy sector will then be done based on these partial results. The work of the classification and measurement of parameters within the AHP perspective will be the input for the creation of the n x n matrix suggested by Saaty (1990) and the related work of Francischini and Barbarán (2003), Rafaeli and Müller (2007) among other authors.
VI. REFERENCES
[1] BRASIL, Empresa de Pesquisa Energética. Balanço Energético Nacional 2013: ano base 2012. Rio de Janeiro: EPE, 2013.
[2] BUKOWITZ, W; WILLIAMS, R. Manual de Gestão do Conhecimento. Porto Alegre: Editora Bookman, 2002.
[3] CAPURRO, R. Gestão do Conhecimento Cético. Perspectivas em Gestão & Conhecimento, v. 1, n. 1, p. 4-14, 2011. Disponível em: < http://periodicos.ufpb.br/ojs2/index.php/pgc/article/view/10255>. Acesso em: 6 abr. 2014.
[4] CASTRO, N. J et al. O Equilíbrio Dinâmico e as Condições de Demanda e Oferta do Setor Elétrico Brasileiro. Texto de Discussão do Setor Elétrico, n.21, 31p. Rio de Janeiro: Universidade Federal do Rio de
Janeiro, GESEL, jun. 2010. Disponível em: < http://www.nuca.ie.ufrj.br/gesel/tdse/>. Acesso em: 17 mar. 2014. [5] CHIAVENATO, I.; SAPIRO, A. Planejamento Estratégico. Rio de
Janeiro: Elsevier, 2003.
[6] DAVENPORT, T. H.; PRUSAK, L. Conhecimento Empresarial. Rio de Janeiro: Elsevier, 1998.
[7] FERNANDINO, J. A.; DE OLIVEIRA, J. L. Arquiteturas organizacionais para a área de P&D em empresas do setor elétrico Brasileiro. Revista de Administração Contemporânea - RAC, v. 14, n. 6,
p. 1073-1093, 2010. Disponível em:
<http://www.scielo.br/scielo.php?script=sci_arttext&pid=S1415-65552010000700006&lng=pt&nrm=iso&tlng=pt>. Acesso em: 3 abr. 2014.
[8] FRANCISCHINI, P.G. ; BARBARÁN, G.C. Proposição de um indicador geral de desempenho utilizando AHP. In: ENCONTRO NACIONAL DE ENGENHARIA DE PRODUÇÃO, 23, 2003, Ouro Preto. Anais... Ouro Preto: ABEPRO, 2003. Disponível em: < http://www.abepro.org.br/biblioteca/enegep2003_tr0115_1413.pdf>. Acesso em: 19 maio 2014.
[9] JAMIL, G. L. Gestão de Informação e do Conhecimento em Empresas Brasileiras: estudo de múltiplos casos. Belo Horizonte: C/ Arte, 2006. [10] KWASNICKA, E. L. Introdução à Administração: uma visão
sistêmica. São Paulo: Atlas, 2007.
[11] MARCONI, M.A.; LAKATOS, E.M. Fundamentos de Metodologia Científica. São Paulo: Atlas, 2010.
[12] NONAKA, K; TAKEUCHI, H. Criação do conhecimento na empresa. Rio de Janeiro: Elsevier, 1997.
[13] OLIVEIRA, D. P. R. Planejamento estratégico: conceitos, metodologia e práticas. São Paulo: Atlas, 2006.
[14] PEREIRA, F. M. Uso de Fontes de Informação: Um estudo em micro e
pequenas empresas de consultoria de Belo Horizonte. Dissertação. ECI / UFMG. 2006 143 p.
[15] PEREIRA, F. M. Modelo Integrativo – Comportamento Informacional para Decisões Estratégicas: estudo de caso em MPEs mineiras. In: Encontro Nacional de Ciência da Informação e Biblioteconomia, Santa Catarina. Anais... Florianópolis: ENANCIB, 2013.
[16] PROBST, G.; RAUB, S.; ROMHARDT, K. Gestão do conhecimento:
os elementos construtivos do sucesso. Porto Alegre: Bookman, 2002. [17] QUEIROZ, G. C. Uma metodologia para tomada de decisão combinando
princípios do PIR (Planejamento Integrado de Recursos Energéticos) e critérios de estudos de impactos ambientais. Revista Brasileira de
Energia, V.8, n.2, 2001. Disponível em:
<http://www.sbpe.org.br/rbe/revista/17/>. Acesso em: 21 dez. 2013. [18] RAFAELI, L.; MÜLLER, C. J. Estruturação de um índice consolidado de
desempenho utilizando o AHP. Gestão & Produção, Universidade Federal de São Carlos, v.14, n.2, p.363-377, 2007. Disponível em:
<http://www.scielo.br/scielo.php?script=sci_pdf&pid=S0104-530X2007000200013&lng=en&nrm=iso&tlng=pt >. Acesso em: 10 jun. 2014.
[19] RICHARDSON, R. Pesquisa social: métodos e técnicas. 3 ed. São Paulo: Atlas, 2007.
[20] SAATY, T. L. How to Make a Decision: the analytic hierarchy process European Journal of Operational Research V.48, Ed.1, p.9-26, 1990.
Disponível em:<
http://www.sciencedirect.com/science/article/pii/037722179090057I>. Acesso em: 26 Maio 2014.
[21] SELLTIZ, C., JAHODA, M., DEUTSCH, C. Métodos de pesquisa nas relações sociais. São Paulo: Universidade de São Paulo, 1974. [22] TARAPANOFF, K . Informação, conhecimento e Inteligência em
corporações: relações e complementaridade. In:TARAPANOFF, K. Inteligência, Informação e Conhecimento em Corporações. Brasília: IBICT, UNESCO, 2006. P.19-35.
[23] TOLMASQUIM, M. T. Perspectivas e planejamento do setor energético no Brasil. Estudos Avançados, v. 26, n. 74, p.247-260, 2012. Disponível
em: < http://www.scielo.br/scielo.php?script=sci_arttext&pid=S0103-40142012000100017>. Acesso em: 14 Abril 2014.