ROBERTO VASSOLO [email protected]
Professor at Universidad Austral, IAE Business School – Buenos Aires, Argentina and Pontiicia Universidad Católica de Chile, Facultad de Ingeniería – Santiago, Chile
JAVIER GARCÍA-SÁNCHEZ [email protected]
Professor at Universidad Austral, IAE Business School – Buenos Aires, Argentina
LUIZ MESQUITA [email protected]
Professor at Arizona State University, School of Business – Arizona, United States of America
ARTICLES
Submitted 10.13.2015. Approved 10.13.2016Evaluated by double blind review process. Scientiic Editor: Carlos L. Rodriguez
COMPETITIVE DYNAMICS AND EARLY
MOVER ADVANTAGES UNDER ECONOMIC
RECESSIONS
Dinâmica competitiva e vantagem do pioneiro em recessões econômicas
Dinámica competitiva y ventajas de precursores en recesiones económicas
ABSTRACT
In light of the recent macroeconomic instability in global markets, we examine the evolution of com-petitive dynamics and irm proitability when industries are subject to recessions. Although ordinary intuition leads most to view recessions as harmful, we highlight conditions under which they enhance the relative value of industry-level supply-side isolating mechanisms, thereby afording early movers signiicant and sustainable proit advantages vis-à-vis laggards. We observe that the distribution of irm size within the industry switches from a bi-modal distribution (i.e., one dominated by both small and large irms) to a right-skewed one (i.e., dominated mostly by large irms) in these contexts, the-reby signaling the rise of important opportunities in the form of less rivalrous competitive contexts for survivors of recessions. We derive our results from formal modeling and multiple simulation runs.
KEYWORDS | First mover advantages, industry life cycle, competitive dynamics, recessions, supply
side isolating mechanisms.
RESUMO
À luz da recente instabilidade macroeconômica nos mercados globais, examinamos a evolução da dinâmica competitiva e da rentabilidade das empresas quando indústrias estão sujeitas a recessões. Embora a intuição comum leve a maioria das pessoas a enxergar as recessões como prejudiciais, des-tacamos condições sob as quais elas melhoram o valor de mecanismos de isolamento em nível de indústria e do lado da oferta, proporcionando aos pioneiros vantagens de lucro signiicativas e sus-tentáveis em comparação com seguidores. Observamos que a distribuição do tamanho das empresas passa de uma distribuição bimodal (ou seja, dominada tanto por empresas grandes quanto peque-nas) a uma distribuição enviesada à direita (ou seja, predominantemente dominada por empresas grandes) nesses contextos, sinalizando a emergência de importantes oportunidades na forma de con-textos de concorrência com menor rivalidade para os sobreviventes das recessões. Derivamos nossos resultados de execuções de modelagem formal e múltiplas simulações.
PALAVRAS-CHAVE | Vantagem do pioneiro, ciclo de vida de indústria, dinâmica competitiva, recessões, mecanismos de isolamento do lado da demanda.
RESUMEN
En vista de la reciente inestabilidad macroeconómica en los mercados globales, analizamos la evolu-ción de la dinámica competitiva y rentabilidad irme cuando las industrias están sujetas a recesiones. Aunque la intuición común lleva mayormente a considerar las recesiones dañinas, enfatizamos las condiciones en las que mejoran el valor relativo de mecanismos aislantes de suministros a nivel de la industria, por lo tanto, proporcionándoles a los precursores ventajas provechosas signiicativas y sostenibles con respecto a los rezagados. Observamos que la distribución de tamaño irme dentro de la industria cambia de una distribución bimodal (es decir, una dominada tanto por pequeñas como por grandes empresas) a una sesgada hacia la derecha (es decir, dominada mayoritariamente por grandes empresas) en dichos contextos, por lo tanto indicando el surgimiento de importantes oportunidades en la forma de contextos menos rivales para sobrevivientes de recesiones. Derivamos nuestros resultados de modelado formal y ejecuciones de simulaciones múltiples.
PALABRAS CLAVE | Ventajas de precursores, ciclo de vida de la industria, dinámica competitiva, rece-siones, mecanismos aislantes del lado de suministros.
INTRODUCTION
What should irms do when competing in contexts subject to a high probability of macroeconomic recessions? In the past couple of decades, important markets in distinct corners of the world seem to have sufered severe economic contractions. For instance, Singapore, Korea, Hong Kong, Brazil, and Argentina collapsed during the 1990s, whereas the United States and the European Union, in turn, were severely afected in the irst decade of this century. As if to show that there is some “regularity” to what most usually see as an “exception,” a typical OECD country experienced approximately six recessions between 1960 and 2007 (Claessens, Kose, & Terrones, 2009, 2010). The relevance of the matter is evident with the ubiquitousness of these exogenous threats and the lack of clear strategic imperatives for irms exposed to them
(García-Sánchez, Mesquita, & Vassolo, 2014). This phenomenon can gravely confuse seasoned top managers. The following 2001 quote from a top executive in Argentina—a country that at the time underwent an acute recession—highlights this strategic confusion: “Although Monsanto has been irst to commit and dominate the local market for genetically modiied seeds, headquarters has decided to not only curb but even withdraw its pledges and rethink its further investments in this market. We fear the economic turmoil may end up shifting the sources of advantages and shuling the market positions of rivals. In fact, Wall Street has already penalized us for our large Argentine asset exposure.”
Indeed, countless multinationals that had conidently entered Argentina’s economic opening a decade earlier left the country not even two years into the economic recession
(Carrera, Mesquita, Perkins, & Vassolo, 2003). However, without knowing what the industry’s competitive context would look like in the event of a recession, prescribing the suitability of given strategic courses is problematic. On the one hand, managers may stick to their original plans and race ahead of rivals, albeit such dedication to troubled markets can penalize irm value (as Monsanto found out). On the other hand, hesitation can give a irm valuable lexibility; however, the irm may be more vulnerable to rivals if the market lourishes.
Given today’s recurrent state of economic volatility in several countries, the relevance of the matter is qualiied by the matter of when and not if it will return. Motivated by this problem that currently lacks clear scholarly and practice guidelines regarding whether to enter an industry and how fast to growth in the face of a macroeconomic recession, in this paper we develop theoretical principles by examining the consequences of recessions for competitive dynamics and irm performance. To constrain our study to a manageable set of parameters, we
focus on an industry with supply-side isolating mechanisms that generate irst-mover advantages (FMAs) in the form of higher proits. We argue that recessions represent discontinuities that alter an industry’s carrying capacity in the short run, but that induce durable and—for some irms, but certainly not for all— valuable efects along the rest of industry life.
We build on García-Sánchez, Mesquita, and Vassolo (2014)
to develop a mathematical simulation model, simplifying it to focus on the mechanisms that generate FMA. Through multiple simulation runs, we observe that the distribution of irm size within the industry switches from a bi-modal distribution (i.e., one dominated by both small and large irms) to a right-skewed one (i.e., one dominated mostly by large irms) in these contexts, thereby signaling the rise of important opportunities in the form of less rivalrous competitive contexts for survivors of recessions. Therefore, although ordinary intuition can lead most to view economic shocks as harmful, we theorize on an alternative side of this phenomenon, which is that they instead create conditions that irms can strategically use to boost FMA, more speciically afording early movers valuable opportunities over laggards that do not exist in stable contexts. Therefore, the model sets the conditions for whether following a procyclical strategy (accelerating entry and growth in moments of macroeconomic expansion but under the likelihood of recessions) is optimal. The results are also relevant for multiple foreign market entry into industries subject to FMA.
Our model shows the advantages of following procyclical strategies; however, it also complements prior studies that eventually recommend anticyclical strategies (e.g., Mascarenhas & Aaker, 1989; Greer & Ireland, 1992; Gracias-Sanchez et al., 2014). In addition, with this study, we join a quickly growing body of literature that relates macroeconomic shocks with competitive advantages (Mascarenhas & Aeker, 1989; Chakrabarti, Singh, & Mahmood, 2007; Chakrabarti, Vidal, & Mitchell, 2011; Garcia-Sanchez, 2014; Ghemawat, 1993; Wan & Yiu, 2009). Using this approach, we also contribute to characterizing a contingent efect that reinforces FMA (Mascarenhas, 1992; Suarez & Lanzolla, 2007) even in the context of foreign market entry. Lastly, we ofer managers, such as the Monsanto executive, a rationale for controversial strategic decisions.
BACKGROUND
FMA and the Industry Life Cycle
1988), represent an important strategy concept. Previous FMA research explains that by assertively preempting laggards (e.g., entering and growing quickly) and maintaining technological leadership (e.g., investing in learning and R&D), early movers can sustain survival, market share, and proit advantages
(Mascarenhas, 1992; Suarez & Lanzolla, 2007). In contrast, late movers often struggle to catch up and close time-dependent resource and performance disadvantages. It is well accepted that FMAs vary along the industry life cycle. Speciically, industries are known to evolve along three commonly recognized stages: an early exploratory phase, an intermediate development stage, and a mature phase. During the earliest stage of industry life, many entrants are attracted by the absence of size advantages and the promise of hefty returns for successful innovation sometime in the near future (Klepper, 1997). In this “luid” period of development, performance criteria for new products are not well deined. As development proceeds, a particular technology design emerges dominant. Producers’ know-how also evolves over time, increasing R&D investment requirements for new entrants to replicate the knowledge of incumbents. Eventually, although industrial know-how becomes codiied, decreasing R&D entry barriers, proit margins are compressed enough to make entry unattractive. As the industry reaches maturity, competition intensiies given prior entry, thus compressing proit margins and curbing further entry. High rivalry also forces the least eicient irms to exit. At this point, competition has shifted from technology to price.
The importance of recognizing these evolutionary stages along the life of an industry lies in the changing efect on sources of competitive advantage (Baum, 1995). Passing from earlier phases to the maturity stage involves a reversal in the relative role of innovation. The earliest stage is fundamentally entrepreneurial and favorable to innovative entry, whereas maturity is the most enabling ground for established (larger) irms with well-developed operational routines (Winter 1984). In other words, rivalry among irms increases as the industry evolves and demand saturates at a fairly smooth pace, shifting the sources of competitive advantage. The evolution of proitability in this context determines the structure of the industry at maturity, with the accentuated emergence of successful large players. Speciically, the industry population tends to become more concentrated, with larger companies dominating the environment and fewer small and mid-sized ones occupying niche positions. Undoubtedly, the sources of proitability difer from large companies to niche players.
The previously described regularities along the industry evolutionary trajectory enable key theoretical elements to understand the evolution of competition in macro-economically volatile contexts. On the one hand, it helps managers and scholars understand that the economy provides resources to
irms in an overall pattern. However, this provision luctuates as gross domestic product (GDP) moves from periods of expansion to periods of contraction. Failing to distinguish changes in the level of macroeconomic activity implies a strong but questionable theoretical assumption regarding selecting mechanisms being equivalent in at least two aspects: (a) that these selecting pressures will equally afect the survival likelihood of diferent cohorts (e.g., early versus late entrants) of irms, regardless of the type of advantages they already possess; and (b) that these selecting mechanisms are stable along the industry life cycle (e.g., emergent versus maturity phases of industry life).
Our goal is then to incorporate recessionary events in the industry life cycle subject to FMA. To do so, we next examine the evolutionary patterns of the macroeconomic environment.
What are recessions?
In every country, the level of macroeconomic activity luctuates around a long-term trend, moving from cycles of recession—a trough point in the overall oscillatory evolution of economic growth—to expansion (Burns & Mitchell, 1946; Claessens, Kose, & Terrones, 2009, 2010). Recessions are particularly important moments because they afect the industry’s carrying capacity and exogenously enhance its internal competitive pressures.
During recessions, aggregate demand contracts. This downturn causes further disruptions in the liquidity of exchanges of capital and goods, as measured by factor productivity and production capacity (Mendoza, 2006, p. 411). As unemployment surges and the local currency plummets, local market dwellers observe an acute decline in wage levels (Calvo & Mendoza, 1996; Calvo, Izquierdo, & Talvi, 2006). This sequential chain of economic events ultimately culminates in an acute decline in demand and GDP (Calvo & Mendoza, 1996). Depending on the institutional conditions and the causes of the recession, economic activity eventually returns to pre-recession levels. However, as shown in Ayyagari, Demirgüç-Kunt, and Maksimovic, (2011), economic recovery has a strong and lasting heterogeneous efect on the competitive standing of companies. They observe that sales recovery is highly heterogeneous, with some companies increasing their sales and others decreasing theirs in the aftermath of recessions. Therefore, with economic shocks being this ubiquitous, understanding their efects on irm proitability and FMA becomes much more pressing.
usually follow procyclical strategies (Mascarenhas & Aaker, 1989; Ghemawat, 1993; Dobbs, Karakolev, & Malige, 2001; Pearce & Michael, 2006). To shed light on this conundrum, we develop a mathematical simulation model of an industry with FMA on the basis of cost competition and examine the efect of a recession on such advantages.
MODEL AND SIMULATION MECHANICS
Simulation methods are powerful approaches for theory building
(Davis, Eisenhardt, & Bingham, 2007; Harrison, Lin, Carroll, & Carley 2007). This approach is useful when a simple theory exists— that is, when an existing theory is underdeveloped and has only a few constructs and related propositions (Davis, Eisenhardt, & Bingham, 2007). In our case, the efect of recessions on competitive dynamics and irst-mover advantages has strong theoretical underdevelopment. We follow the standard simulation procedure of formally modeling our phenomenon and deriving next theory propositions from multiple simulation runs (Harrison, Lin, & Carroll, 2007). In rare empirical studies, scholars may choose to review prior studies and deductively distill existing hypotheses, and they compare such a prior theory with new indings from computer simulation runs (e.g., see Siggelkow & Rivkin, 2006). However, where prior studies are incomplete in conidently generating new theoretical models, formal modeling and computer simulations help to more precisely specify causal relations given that speciic processes are postulated and then directly observed in simulation runs (Cohen & Cyert, 1965; Harrison et al., 2007). Moreover, when research depends on the occurrence of natural events (which themselves trigger a multitude of uncontrolled efects that are outside the main focus of interest in the study, but that may endogenously afect the results), simulations become particularly attractive because formal modeling permits authors to precisely establish rigorous sets of controls. In this case, simulations are used instead to derive new theoretical propositions in an inductive fashion (e.g., Miller, Zhao, & Calantone, 2006; Siggelkow & Rivkin, 2006).
Given that our model parameters (e.g., window period of observation, numbers of new entrants, and others) are similar, the model we develop takes its basic form from García-Sánchez et al. (2014) precisely to help contrast our distinct indings vis-à-vis a similar background. Yet, our model is a simpliication of theirs because our goal is to stress the relationship between FMA and macroeconomic turbulence. In particular, our model describes a competitive dynamic process through which recessions produce a shift in industry muniicence levels to increase inter-irm rivalry and change irms’ performance. In turn, the simulation analyses
provide numerical solutions on the basis of which we develop testable propositions on the evolution of competition (i.e., regarding average industry concentration) and irm advantages (i.e., regarding FMA in proits and survival). At the industry level then, we adapt a Cournot model and a competitive entry and exit process. The Cournot model is particularly suitable to analyze supply-side isolating mechanisms.
Every period, each irm chooses its output levels, which we aggregate into industry supply (formally, Qt = ΣQit). In turn, aggregate supply balances with demand and the market clears, inducing price equilibrium. Our demand curve is a standard constant elasticity (i.e., downward sloping) function with a modiication to introduce a demand shift when the market sufers a recession. We also include a product substitute as a price ceiling. Formally, Pt = D(Qt) = min (S, (Δ/Qt)[1/])(1 – П
t), where
Pt is the market price in period t and D(.) is the demand function. S is the substitute product price, Δ is a demand parameter, is the elasticity of demand, and Пt is the parameter to introduce recessions.
The analysis of the recession is straightforward. We simply induce a lower equilibrium price for the same quantity of output through a downward shift in the demand curve. This shift responds to the parameter (1 – Пt), where П represents the recession magnitude and equals zero if t falls outside the recession period, or П otherwise (García-Sánchez et al., 2014). Recessions difer in magnitude and duration. To obtain external consistency, we consider recessions of diferent magnitudes and at diferent times during the life of an industry. The model certainly permits easy adaptation for longer recessions, but for ease of exposition, we focus on short and sharp contractions and recoveries.
Regarding timing and similarly to García-Sánchez et al. (2014), we selected recessions in year eight, when the industry was undergoing strong development and growth, and in year 25, when the industry was mature. Regarding magnitude, we imposed shocks of 8% and 10%. It is worth noting that we do not distinguish between macroeconomic contraction and industry contraction. Recessions afect demand contraction for many diferent industries at diferent levels. For ease of exposition, we assume that macroeconomic contraction afects the contraction of general demand and the demand for industry products at the same level.
maximize proits in the following period. Formally, Ki(t+1) = Kit*(1– δ)+Ii(t+1). Here, Ii(t+1) represents capital expenditures, which occur on the basis of proit maximization for period (t+1).
Proits are deined by πit = PtQit – cit(Qit) – (ρ + δ)Kit – rit, with πit being the proit of irm i in period t. We note that proit is a function of cit(·), which represents the related unit cost function. This cost function depends on accumulated learning and current technology, which is the product of past R&D expenditures. Unit costs decline over time as a function of learning, which itself is a function of accumulated output and irst unit cost. Additionally, the cost curve can shift down depending on R&D investments. As such, R&D afects output costs by reducing the irst unit cost. Regarding learning, the irst unit cost represents a given production technology. Formally, cit(Qit) = c(Qit, Ǭit, τit) = τit(rit,τi(t–1) * (Ǭit[1+log
2 (β
i)] – Qi(t–1)[1+ log2 β
i]), where Ǭit is the accumulated output of
irm i up to period t, τit(·) is the hypothetical irst unit cost using the technology as of period t, and βi is the progress ratio of the learning of irm i. The progress ratio of learning is a constant characteristic of every individual irm, determined at the moment of entry through a random draw from a normal distribution. By concept, as cumulative output doubles, the unit cost declines by β. For instance, an 80% progress ratio means a 20% unit cost reduction each time cumulative output doubles.
Lastly, ρ is the cost of capital, δ is the depreciation per unit of capital, and rit is the R&D expenditure of irm i in period t. At the end of every period, poor performers exit. Formally, exit occurs if either performance or capital stock results are lower than their respective minima, that is, Kit ≤ Kmin or χ
it ≤ χ
min, with χ
it = χi(t–1)θ +
(πit/Kit)(1 – θ). In turn, performance is deined as a distribution lag function of return. On the other hand, potential new entrants are given random initial conditions if their expected performance at the prevailing price is higher than their minimum threshold.
As said above, investment decisions are based on proit maximization whose irst order condition is expressed in terms of mark-up μit , deined as Pt/mcit where mcit is the marginal cost of irm i at period t, ie the irst derivative of the total cost function. When proits are maximized the optimal mark-up fulills μit = (ε+(1– si(t–1)*Ψ)) / (ε+(1–si(t–1)*Ψ–si(t–1)), where sit is irm i’s market share, and Ψ is the supply elasticity of the irm i’scompetitors as a whole, which we assume as per the Cournot conjecture, i.e., they consider the possible responses of others. If current mark-up is higher than the optimum the irm invests more than it depreciates, otherwise it stops investing and lets assets depreciate. In formal terms, Iit = min(Φit, Ki(t–1)*(λ*(1–μit*mci(t–1) / Pt–1)+ δ)), where Φit is the maximum amount of funds available for investments according inancing restrictions, λ is a model parameter that regulates the speed of growth, which represents intrinsic business restrictions, such as personnel training, asset availability, and others.
Additionally to capex decisions, irms choose the R&D expenditure, which produces cost curve shifts. One may conceptually think of a technology innovation that does not discard previous accumulated learning. We use an asymptotic function with a random error component and a parameter (0<γ≤1) that represents the R&D skills of each irm. These R&D skills are determined at a irm’s moment of entry. Thus, τit(rit, τi(t–1)) = τi(t–
1)*/(γi*(rit+1))*ξit, where γi is irm i’s R&D eiciency and ξit is its
innovation error at period t. This function implies a minimum R&D investment to prevent an increase in the irst unit cost (rimin
= (1/γi) – 1). R&D investment also relects proit maximization for (t+1). For simplicity, capital and R&D investment decisions are made sequentially (i.e., R&D investment is decided after output has been chosen). Maximizing for r, rit* = [(τ
i(t–1)/γi) * (Ǭit1+log2(βi) –
Ǭi(t–1)1+log2(βi))](1/2) – 1, where investments will be made if rit* > ritmin.
As is the case with capex, R&D expenditures are capped by funds availability, such that ritmax =Φ
it – Ii(t–1). In other words, rit = max(rimin,
min(rit*, r itmax)).
Entry is a critical aspect in any model, and in our case, it is a random variable. The number of potential entrants is a percentage of the number of irms in the industry that determines the pool; this percentage is taken from a normal distribution with mean and standard deviation parameters of the simulation. Parameters for new entrants are randomly assigned. Entry occurs if performance at the current price is higher than χmin.
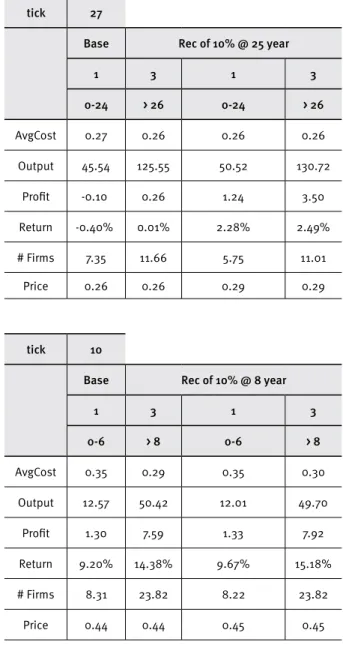
Each run of our simulation produces a particular evolutionary path, whereas our inal analysis is based on the average of 1,000 runs. We calibrated initial parameters (Table 1) found in the related literature (e.g., Winter, 1984; Calvo et al., 2006; García-Sánchez et al., 2014). We ran our simulations using the Repast Simphony software platform (Repast, 2016).
SIMULATION RESULTS AND
THEORETICAL CONSIDERATIONS
(Klepper & Graddy, 1990; Klepper, 1997; Agarwal, Sarkar, & Echambadi, 2002).
Table 1.
Simulation parameters
Name Value
Price of substitute 3
Demand elasticity 1
Demand parameter 800
Supply elasticity 2
Investment parameter 0.5
Initial capital mean 4
Initial capital StdDev 0.1
Minimum capital 1
Max external borrowing 0.3
Performance weight 0.6
Minimum performance -0.02
Cost of capital 0.15
Capital productivity (A) 1
Depreciation 0.1
Entrants mean 12
Entrants StdDev 0.1
Fixed cost 0.5
R&D eiciency mean 0.9
R&D eiciency StdDev 0.1
Initial irst unit cost 2
Learning rate mean 0.9
Learning rate StdDev 0.1
Sudden stop magnitude 8%; 10%
Sudden stop duration 1
Sudden stop start 8; 25
Industry variance emerges from the stochastic nature of the diferent parameters. Therefore, the aggregate level of industry growth is contingent on individual irms’ entry and growth decisions. We report the aggregate results of the 1,000 simulation runs, which hide part of this variability.
In the following sections, we analyze the efect of recessions on industry evolution and competitive advantages. For this purpose, we irst study the efect of recessions on the distribution of irm size within the industry. We take this approach because size is a fundamental antecedent of irm survival and growth, and
indicates potential sources of competitive advantages (Baum, 1995; Dobrev & Carrol, 2003; Porter, 1985; Josefy, Kuban, Ireland, & Hitt, 2015). A change in the structure of the size distribution is a necessary condition for detecting that recessions alter the value of the isolating mechanisms.
Recessions and irm size distribution
To examine the evolution of the size distribution, we contrast the size proile of irms in industries subject to recessionary events vis-à-vis those free of them. Graph 2 shows a simulated snapshot in year 50 of an industry that hypothetically evolved from the same birth year (year 1) in three diferent and independent macroeconomic environments. In each of these environments, the industry similarly goes through the same natural development phases (namely, development, shakeout, and maturity), except that each was subject to diferent recessions. In the “base model,” environment 1 was stable for the 50 years during which the industry evolved. In contrast, environments 2 and 3 were respectively hit in years 8 and 25 by recessions of similar magnitude. The selection of these two moments has theoretical motives: they allow us to examine the efect of the recession with diferent conditions of environmental muniicence in key moments during the life of the industry. Therefore, although we only analyze one type of industry, we highlight diferent levels of muniicence, expanding the generalizability of the results. We believe that a snapshot analysis of average irm size in year 50 accurately relects what we would ind in the long run.
To contrast the firm size profile across these three hypothetical industries, we classiied all irms by the size of their output in year 50 across 10 diferent categories evenly distributed in terms of number of competitors. Each group of three columns in Graph 3 then represents the count of irms in that size category, by context. The smallest irms conform to the irst category, represented in the irst group of vertical columns from left to right along the x-axis (i.e., the group closest to the y-axis). Following the same logic, our 10 categories are thus displayed sequentially from left to right, given that the last category (the one farthest to the right along the x-axis) incorporates all irms producing more than 182 units of output in year 50.
irms in the industry subject to a recession in year 25 (i.e., full-patterned columns) difers signiicantly. The size distribution is skewed to the right, indicating a concentrated industry populated by large irms. The results for the smaller recession efect (i.e., dot-patterned bars) are not as starkly dissimilar from that of the recession-free context but are still diferent. However, the earlier in the life of an industry that recessions occur, the quicker the industry recovers.
In this analysis, we highlight the different strategic approaches by irms across diferent environments. Firms subject to recessions, assuming they survive over the long haul, are likely to enjoy more oligopolistic and proitable contexts, whereas their counterparts in recession-free settings are more likely
to sufer a more rivalrous context at a much later stage in the life of an industry. The point is that recessions induce a higher concentration of the industry population, with few medium-sized and even fewer small-sized companies in the market.
P1a: Recessions that occur momentarily along the industry life cycle permanently alter the long-term size distribution of the population.
P1b: In a context of FMAs that emerge from supply-side isolating mechanisms, recessions shift the industry structure; that is, compared with that of a recession-free context, an industry comes to display a population size distribution dominated by larger irms.
Graph 1.
Base evolution of number of irms (left-hand side Y-axis) and industry output (right-hand side Y-axis)
70 3.500
3.000
2.500
2.000
1.500
1.000
500
0 60
50
40
30
20
10
1 2 3 4 5 6 7 8 9 10 11 12 13 14 15 16 17 18 19 20 21 22 23 24 25 26 27 28 29 30 31 32 33 34 35 36 37 38 39 40 41 42 43 44 45 46 47 48 49 50
0
Number of irms and total output – base case
Number of irms Total output
Graph 2.
Evolution of size proile under recession on diferent moments
Histogram of output (Year 50) 20%
2:18 - 36 3:36 - 55 4:55 - 73 5:73 - 91
Base Rec of 10% @ 8 year Rec of 10% @ 15 year
6:91 - 109 7:109 - 127 8:127 - 146 9:146 - 164 10:164 - 182 11: > 182 18%
Small competitors survival
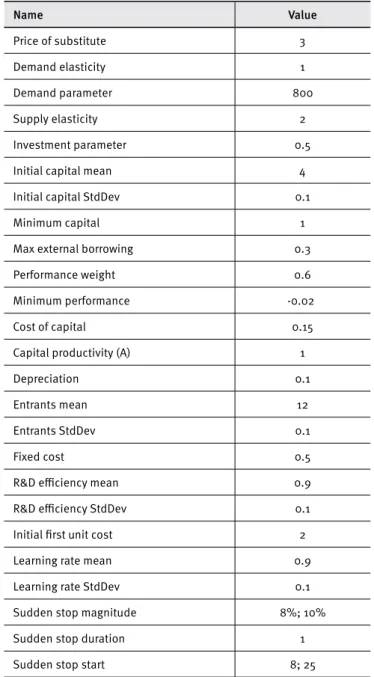
We have observed that recessions reinforce large competitors’ advantages. It is worth asking whether small competitors that survive are latter entrants that never grow enough given a lack of resources or, rather, are niche players with sustainable competitive protection. To analyze this tradeof, we examine the average entry year of niche players. Table 2 reports the average age of the competitors for each size.
Table 2.
Age by Cohort in year 50
Bucket FirmBucketName
Escenario base age average
Valores number of
irms
Rec of 10% @ 8 year age average
Number of irms
Rec of 10% @ 25 year age average
Number of irms
2 18 - 36 44.5 1.6 44.6 1.5 44.1 1.1
3 36 - 55 46.0 4.7 46.0 4.2 45.5 3.0
4 55 - 73 47.0 4.9 47.1 5.2 46.8 4.4
5 73 - 91 47.5 4.9 47.5 4.4 47.5 4.7
6 91 - 109 47.9 3.6 48.0 4.0 47.9 3.8
7 109 - 127 48.1 2.9 48.1 3.1 48.1 3.0
8 127 - 146 48.3 2.5 48.3 2.6 48.2 2.6
9 146 - 164 48.4 1.9 48.4 2.1 48.5 2.1
10 164 - 182 48.5 2.1 48.5 2.0 48.5 2.2
11 > 182 48.8 2.8 48.8 2.7 48.8 3.1
The result shown in Table 2 indicates that larger competitors are older irms with an average age of 48.8 years. Smaller competitors are younger, with an average age of 44.5 years. It is worth noting that even small competitors entered the industry at a very early stage. Therefore, this phenomenon seems to conirm that small competitors have a sustainable niche position and that this niche decreases in size given the long-term efect of recessions on large competitors’ cost structures. As the industry becomes more concentrated, larger competitors reduce the remaining space for niche players. Interestingly, the diferences in age between large and small competitors are relatively small, indicating that most survivors enter the industry during the development stage. Therefore,
P2: In a context of FMAs that emerge from supply-side isolating mechanisms, recessions reduce the viability of a niche strategy.
Recessions and irm proitability
Graph 3.
Evolution of average cost per Cohort
0.28
0.275
0.27
0.265
0.26
0.255
0.25
1 2 3 4 5 6 7 8 9 10 11 12 13 14 15 16 17 18 19 20 21 22 23 24 25 26 27 28 29 30 31 32 33 34 35 36 37 38 39 40 41 42 43 44 45 46 47 48 49 50 Recession impact on irms average costs per age Cohorts
Base - 1 Base - 2 Rec of 10% @ 25 year - 1 Rec of 10% @ 25 year - 3
In the base case, average costs monotonically decrease for both early and late entrants. The main diference is the cost magnitude, where early movers have a clear cost advantage that persists through the years. Recessions transitorily alter this evolutionary path, inducing a sharp cost reduction. In the aftermath of recessions, the average cost increases and continues the decreasing trajectory but at a lower level than the base recession-free case.
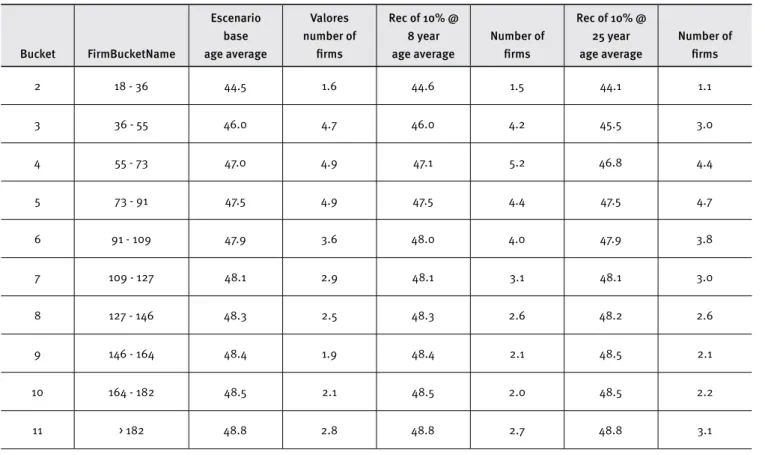
To further examine the mechanisms behind these trajectories, Table 3 summarizes the changes in cost, quantities, proits, performance, number of competitors, and prices of each cohort for recessions of 10% magnitude that occur in years 8 and 25. To describe the short-term mechanisms, the upper left table provides these values for year 23 and the upper right table provides these values for year 27. Similarly, the lower left table provides these values for year 6 and the lower right table for year 10.
Several mechanisms are in place. First, consistent with our previous discussion, the late entrant cohort sufered the most severe reduction during recessions, although early entrants are also partially afected by recessions. In addition, an industry subject to a recession—in contrast to one that is not— observes a short-run drastic decline in average proitability. At a surface level, the logic is straightforward: because a recession constrains aggregate consumer budgets, the downshift in GDP and the associated decline in aggregate demand cause a rift vis-à-vis industry supply, thus creating a sudden and major decline in prices. This decline in market prices naturally induces an immediate and acute decline in irm proitability. In our model, irms are assumed to work at full capacity. With the
new price equilibrium, competition evolves on the basis of cost efectiveness—i.e., superior production process know-how or technologies—for which cost-efective irms have an upper hand and earn market share as lower industry carrying capacity shakes out cost-inefective irms. In summary, one obvious observation is that, during recessions, early movers have a signiicant surviving beneit, although average proitability in the industry falls precipitously in the very short run.
Although this short-term efect may be rather intuitive, further observations reveal a counter-intuitive result. In the aftermath of recessions, irst movers attain a signiicant proit advantage over their counterparts in recession-free industries. However, perhaps much more importantly, such an advantage is sustainable over time.
Table 3.
Proits, variable costs, and production by Cohort
tick 23 tick 27
Base Rec of 10% @ 25 year Base Rec of 10% @ 25 year
1 3 1 3 1 3 1 3
0-20 > 21 0-20 > 21 0-24 > 26 0-24 > 26
AvgCost 0.27 0.27 0.27 0.27 AvgCost 0.27 0.26 0.26 0.26
Output 40.97 102.19 40.97 102.19 Output 45.54 125.55 50.52 130.72
Proit -0.06 0.27 -0.06 0.27 Proit -0.10 0.26 1.24 3.50
Return -0.37% -0.03% -0.37% -0.03% Return -0.40% 0.01% 2.28% 2.49%
# Firms 7.77 22.46 7.77 22.46 # Firms 7.35 11.66 5.75 11.01
Price 0.27 0.27 0.27 0.27 Price 0.26 0.26 0.29 0.29
tick 6 tick 10
Base Rec of 10% @ 8 year Base Rec of 10% @ 8 year
1 3 1 3 1 3 1 3
0-2 > 4 0-2 > 4 0-6 > 8 0-6 > 8
AvgCost 0.77 0.39 0.77 0.39 AvgCost 0.35 0.29 0.35 0.30
Output 4.44 16.90 4.44 16.90 Output 12.57 50.42 12.01 49.70
Proit 2.41 14.77 2.41 14.77 Proit 1.30 7.59 1.33 7.92
Return 45.67% 83.49% 45.67% 83.49% Return 9.20% 14.38% 9.67% 15.18%
# Firms 7.31 23.82 7.31 23.82 # Firms 8.31 23.82 8.22 23.82
Price 1.23 1.23 1.23 1.23 Price 0.44 0.44 0.45 0.45
Note: Tables per age Cohort.
Two important matters regarding capex must be noted. First, they result from early movers being more proitable given that the price stabilizes higher than competitive levels. We then highlight the fact that irst movers have a signiicant proit advantage over their counterparts in contexts not subject to recessions. Assuming path-dependent processes, early movers accrue production process competencies over laggards and subsequently attain superior proitability. We note that irst movers (i.e., irms representing the irst cohort, in line above all others) have a natural proitability advantage over late movers. This by itself is consistent with earlier FMA literature (e.g., Lieberman & Montgomery, 1988). In contrast, and less intuitively, recessions asymmetrically afect diferent cohorts, given that irst movers turn out to be even more proitable than late movers.
In addition, the decline and rise of returns are asymmetrical. The critical element of this asymmetrical behavior is the existence of companies that exit the industry. Therefore, although macroeconomic recovery at the aggregate level is at the same level as the contraction (i.e., it was modeled with symmetrical behavior), the competitive efects are heterogeneous. In fact, as irst movers grow larger from their capex investments, they further enhance their scale and cost competencies. These competencies then reinforce the entry barriers in the aftermath of recessions. In summary,
Procyclical versus anticyclical strategies
The business cycle imposes tensions on growth strategies because scale eventually puts companies in a vulnerable position when demand diminishes. Companies need to determine whether it is better to accelerate as economic activity increases and to retrench when it slows down (i.e., follow a procyclical strategy) or, eventually, to restrict growth in periods of expansion and accelerate growth during recessions (i.e., follow an anticyclical, also known as contrarian, strategy). For example, García-Sánchez et al. (2014) focus on the tension between the need to achieve FMA and the inancial risk that gaining such advantage using debt imposes during recessionary times. Greer and Ireland (1992)
analyze the same tradeof in hiring processes. They examine how countercyclical hiring could ensure irms the supply of talent that is quite diicult to access during expansionary periods.
The underlying question is whether it is convenient for a irm to follow a countercyclical or contrarian strategy, taking advantage of recessions, or a procyclical strategy. In their seminal manuscript, Mascarenhas and Aaker (1989) examine these situations and assess that the answer lies in the link between a contemporaneous strategy and inter-temporal relationships, which ultimately determines the optimal strategy over the business cycle. In fact, the best strategies for recessionary or recovery periods are not necessarily the best from a long-term, inter-temporal consideration.
In our model, the main mechanisms leading to a competitive advantage work in a procyclical manner. Recessions afect every competitor in the industry; however, smaller competitors with lower cost advantages are the most afected during periods of lower industry carrying capacity and are selected out. Therefore, the best strategy is to seek cost advantages faster than other competitors, which is achieved by entering earlier and growing faster when economic activity is increasing. That is, because our model does not contain any important inter-temporal tradeofs, the winner strategy is to behave procyclically. Consequently,
P4: The value of a countercyclical strategy in an industry with FMA based on a supply-side isolating mechanism depends on the magnitude of the inter-temporal tradeofs. Because the inter-temporal tradeofs are not important, following a procyclical strategy seems superior to following an anticyclical strategy.
Implications for international entry timing
management
The previous analysis allows us to develop conjectures on the efect of recessions regarding the best moment to enter a given
market. However, it is not possible to expand these conclusions to foreign market entry because diferences in the social, economic, and political environments afect the difusion of a new product
(Isobe, Makino, & Montgomery, 2000). Because new products’ international difusion is slow and incomplete, the timing of entry is a source of a competitive advantage under certain conditions
(Mascarenhas, 1992, 1997). In particular, international entry accelerates as uncertainty diminishes, markets mature, and/or markets are larger.
In our analysis, moving irst and growing fast is a clear source of competitive advantages. Therefore, it is worth questioning the extent to which the observed delay in the international expansion of industries subject to FMA is a convenient strategy, moreover given certain hypotheses suggesting that global industry leaders are often irst movers (Porter, 1986). In particular, the main supply-side isolating mechanisms emerge from scale and learning economies that are reinforced after unexpected market contractions.
In addition, to prepare for recessions (e.g., strategically choose a market position that is most beneicial under such circumstances), irms can seek to act in multiple and not perfectly correlated markets (Pearce & Michael, 2006). Competing in diferent markets allows irms to diminish their exposure to recessions, even in the case of the existence of market structures that favor FMA under recessions. Recessions often lead to inancial market contractions that might eventually damage a irm’s growth strategy. Competing in multiple international markets that are not subject to simultaneous recessions (e.g., operating subsidiaries in Argentina, the United States, and China) enhances the possibility of inancing growth strategies that seek FMA.
The main question refers to the existence of potential diseconomies that might emerge from coordinating multiple international business activities. That is, being present in multiple countries implies clear organizational costs that might generate cost diseconomies. Under the assumption that irms have such capabilities, our conjecture for fast foreign entry remains unaltered, and even more so in the context of high macroeconomic volatility. Therefore,
P5: In industries subject to supply-side isolating mechanisms, recessions enhance the value of entering irst in foreign markets.
Robustness checks
coincident with the results previously exposed. Based on these alternative models, a particular outcome that we add to these discussions regards recessions of large magnitudes that occur in maturity. Apart from considering diferent scenarios, we analyze runs with diferent values for the most important parameters: Price of Substitute, (S); Demand Elasticity, (ε); Demand Parameter (Δ); Supply Elasticity (Ψ); First Unit Cost Mean (τ); Progress Ratio Mean (β); Speed of Growth (λ); Initial Capital Mean (K); Capital Productivity (α); Entrants Mean; R&D Eiciency Mean (γ); and Sudden Stop Duration. For each parameter, we attempt several neighboring values, keeping others constant. Each trial consists of at least ive scenarios (i.e., base industry and four diferent recession levels) with 100 runs per scenario. In all cases, the results are essentially the same.
DISCUSSION AND CONTRIBUTIONS
The efect of recessions on the competitive landscape and on the competitive advantage of irms has often been overlooked by strategic management research, with a few noteworthy exceptions. For instance, the 1997 Asian crises spurred important studies that explored the relationship between macroeconomic shocks and diversiication (e.g., Chakrabarti et al., 2007; Wan and Yiu, 2009; Chakrabarti, 2014). More recently, these studies were expanded conceptually to encompass not speciic but more generic country settings under the inluence of recessions
(García-Sánchez et al., 2014). We build on this prior literature and model the evolution of industry structure (particularly as it relates to irm size-distribution), irm behavior (especially regarding the growth limitations of small irms), and the accompanying proitability of irms when industries are hit by recessions throughout their lives. We start with the observation that recessions induce otherwise unexpected shakeouts; however, beyond this obvious occurrence, we examine that such an event asymmetrically afects early and late movers, inducing sustainable FMA in the form of asymmetric survival between larger and smaller irms and proits for early movers, and shapes the industrial context to be more concentrated and less rivalrous later in the life of an industry. Speciically, the shocks tend to weed out late movers because—given path-dependent learning processes and R&D related to production processes—these irms tend to lag behind in competitive cost-based races. By staying ahead of the learning curve on production process eiciencies as well as preempting more scale-eicient production capacity spaces, irst movers tend to survive recessions and, as such, naturally accrue proit advantages. However, more importantly, in the aftermath of recessions, early movers further accrue barriers to entry that congeal their concentrated market just
as demand naturally crawls back to normal. As a result, in contrast to their counterparts in recession-free contexts, irst movers in an industry subject to recessions will be able to enjoy signiicant competitive advantages long after the efects of the economic shock disappear. Lastly, irst-mover advantages are more likely to be sustainable if recessions occur late rather than early in the life of an industry. This competitive dynamic process induces population evolutionary processes that favor large irms in enhancing their competitive advantages but are more detrimental to smaller irms. Said diferently, recessions induce shifts in the industrial context that much more emphatically favor scale-based sources of advantage.
Certainly, because early movers naturally seem to obtain advantages throughout the life of an industry (e.g., Agarwal et al., 2002), our inding that FMA evolves larger during the life of an industry is consistent with this literature. However, we highlight that the FMA modeled and simulated in this study exists beyond those naturally arising from the resolution of endogenous uncertainties inherent in the life cycle process. Speciically, we add an important stratum of uncertainty to the analysis and, in the process, are able to ascertain how FMA evolves in contexts in which managers usually ind it puzzling and complex to make decisions, such as markets undergoing recessions. This result helps us support the claim that, even in the context of foreign entry into turbulent macroeconomic environments, the early mover strategy is convenient.
It is worth noting that this analysis is valid in the absence of inter-temporal tradeofs. García-Sánchez et al. (2014) build their mechanisms on an eventual inter-temporal tradeof that imposes a risk to the growing speed of early movers. Under this tradeof, our conclusions should be taken with caution. We claim that, in the absence of a clear inter-temporal tradeof, following a procyclical strategy (i.e., reinforcing early entrance) is the best choice. However, exit is a fundamental system mechanism that determines future survivors’ performance. Consequently, if being an early mover increases any size liability attributable to the existence of inter-temporal tradeofs, following a more countercyclical strategy might be better.
Our modeling helps unravel factors inluencing competitive dynamics and irm advantages through an ex post analysis of recessions that occur during the life of an industry. Certainly, we do not wish to advise irms with “catch-all” statements, such as “be sure to rush ahead with investments when macroeconomic uncertainty grows,” but we believe that our theorizing and indings are valuable to help improve the quality of management decision making ex ante. As the Monsanto executive highlights, economic shocks can be very puzzling even for seasoned executives and irms leading the industry (as Monsanto did at the time). A vast majority would use common intuition to infer that recessions spell doom and subsequently adopt a “wait-and-see”’ or even an “abandon the ship” strategic approach (as Wall Street suggested that Monsanto and many other irms should do in Argentina in 2001). In contrast, some wiser ones would attempt to ind opportunities in the storm, as the old Chinese dictum suggests. Giving veracity to the latter’s belief, we pinpoint speciic sources of advantage in such troubled contexts. We highlight that a macroeconomic shock increases the value of isolating mechanisms (learning as well as preemption), thus making it worthwhile for some to “weather the storm.”
Our study highlights the increase of FMAs in a macroeconomically unstable context. First movers, understood as those that signiicantly occupy a new market space ahead of others (Lieberman & Montgomery, 1988), often seek the vast proits and market power rewarded to initiators. However, controversy exists as to the persistence of such advantages vis-à-vis quick followers. Recent research has indicated that FMAs change over time and technological and market uncertainties decrease during the life of an industry (Suarez & Lanzolla, 2007). We build up from this point to examine how industry-level factors (i.e., number of irms) as well as irm-level advantages (i.e., proit beneits) evolve when such natural industry evolution is hit by economic shocks at diferent moments. The contrast is mostly apparent in that traditional life cycle concepts consider the evolution of technological and market uncertainties as inherently endogenous to the evolutionary path. In turn, our analysis considers the resulting consequences from the exogenous shocks applied to this process. The diference in the analysis is not trivial because, although FMA has attracted signiicant attention in the literature, much is still to be found regarding early movers’ timing and subsequent access to markets and resources (Lieberman & Montgomery, 1998, p. 1112; Suarez & Lanzola, 2007, p. 378). Because our modeling and simulation provide a contrast between regular and recession-stricken evolutionary industry paths, our results draw attention to the increase that irst-mover advantages accrue to pioneers, in addition to those already demonstrated in the prior literature.
FUTURE RESEARCH AND CONCLUDING
REMARKS
Because of the limited space in a research manuscript, our study certainly faces scope tradeofs but also points to valuable opportunities for future research. Our focus is on understanding the evolution of competitive dynamics and irst-mover advantages when maturing industry contexts are hit by economic shocks. Thus, we began our model by suppressing the industry endogenous uncertainties related to Schumpeterian shocks, that is, those surrounding the competition through product technology introductions early in the life of an industry. Therefore, future modeling is needed to unveil the competitive dynamics that occur when both endogenous and exogenous uncertainties clash. One possible study is to examine how exogenous shocks disrupt network externalities that develop among sellers and buyers when product innovation evolves into an industry standard early in the Schumpeterian competition process. Further, we limited our modeling and analyses to two “supply side” forms of isolating mechanisms. Further studies need to ascertain “demand side” isolating mechanisms, such as buyer switching costs.
Two assumptions underlying our model may also be revised in future research. For one, our model is limited to a demand shock on normal goods for which price elasticity is positive. However, some industries operate with inferior goods for which demand shocks may behave diferently and even in opposite ways. Thus, such diferences may lead to alternative strategy implications vis-à-vis those found in this study. Moreover, we assume that production technologies developed by diferent irms during the life of an industry aford similar levels of organizational lexibility. Thus, shakeout occurrences tend to naturally weed out ineicient irms, which tend to be late movers in a path-dependent context in which technologies evolve linearly. However, if we allow for diferent levels of lexibility, a late mover with a less eicient technology might have more lexibility. In this case, it could adapt more easily to an economic shock. If such is the case, late movers could theoretically have an upper hand in economically unstable contexts. In fact, with the current speciication, our model has no room for early mover disadvantages, which future simulations and empirical studies might be able to tease out.
Recessions seem intrinsic to capitalism and afect the evolution of competition. We are hopeful that our theory and modeling will be helpful to academics and practitioners in better understanding the evolution of industry- and irm-level advantages in volatile contexts, and to be prepared to surf an eventually turbulent future.
ACKNOWLEDGEMENTS
We acknowledge inancial support from Fondecyt (grant N1160048) and Núcleo Milenio Research Center in Entrepreneurial Strategy Under Uncertainty (NS130028).
REFERENCES
Agarwal, R., Sarkar, M. B., & Echambadi, R. (2002). The conditioning efect of time on irm survival: An industry life cycle approach.
Academy of Management Journal, 45(5), 971-994.
Ayyagari, M., Demirgüç-Kunt, A., & Maksimovic, V. (2011). Do Phoenix miracles exist? Firm-level evidence from inancial crises.World Bank Policy Research Working Paper Series 5799, September.
Baum, J. (1995). The changing basis of competition in organizational populations: The Manhattan hotel industry, 1898–1990. Social Forces, 74(1), 177-204. doi:10.1093/sf/74.1.177
Burns, A. F., & Mitchell, W. C. (1946). Measuring business cycles. New York, USA: NBER Books.
Calvo, G. A., & Mendoza, E. G. (1996). Mexico’s balance-of-payments crisis: A chronicle of death foretold. Journal of International Economics, 41(3-4), 235-264. doi:10.1016/S0022-1996(96)01436-5 Calvo, G. A., Izquierdo, A., & Talvi, E. (2006). Sudden stops and phoenix
miracles in emerging markets. American Economic Review, 96(2), 405-410.
Carrera, A., Mesquita, L., Perkins, G., & Vassolo, R. (2003). Business groups and their corporate strategies in the Argentine roller coaster of competitive and anti-competitive shocks. Academy of Management Executive, 17(3), 32-44.
Chakrabarti, A. (2014). Organizational adaptation in an economic shock: The role of growth reconiguration. Strategic Management Journal, 36(11), 1717-1738. doi:10.1002/smj.2309.
Chakrabarti, A., Singh, K., & Mahmood, I. (2007). Diversiication and performance: Evidence from East Asian irms. Strategic Management Journal, 28(2), 101-120. doi:10.1002/smj.572
Chakrabarti, A., Vidal, E., & Mitchell, W. (2011). Business transformation in heterogeneous environments: The impact of market development and irm strength on retrenchment and growth reconiguration. Global Strategy Journal, 1(1-2), 6-26. doi:10.1002/gsj.3
Claessens, S., Kose, M. A., & Terrones, M. E. (2009). What happens during recessions, crunches and busts? Economic Policy. 24(60), 653-700. doi:10.1111/j.1468-0327.2009.00231.x 653-700
Claessens, S., Kose, M. A., & Terrones, M. E. (2010). The global inancial crisis: How similar? How diferent? How costly? Journal of Asian Economics, 21(3), 247-264. doi:10.1016/j.asieco.2010.02.002
Cohen, K. J., & Cyert, R. M. (1965). Simulation of organizational behavior. In J. G. March (Ed.), Handbook of Organizations. Chicago, USA: Rand McNally.
Davis, J. P., Eisenhardt, K. M., & Bingham, C. B. (2007). Developing theory through simulation methods. Academy of Management Review, 32(2), 480-499. doi:10.5465/AMR.2007.24351453
Dobbs, R. F., Karakolev, T., & Malige, F. (2001). Learning to love recessions. The McKinsey Quarterly, (2). Retrieved from http://www. mckinsey.com/
Dobrev, S. D., & Carroll, G. R. (2003). Size (and competition) among organizations: Modeling scale‐based selection among automobile producers in four major countries, 1885-1981. Strategic Management Journal, 24(6), 541–558. doi:10.1002/smj.317
García-Sánchez, J., Mesquita, L. F., & Vassolo, R. S. (2014). What doesn’t kill you makes you stronger: The evolution of competition and entry‐
order advantages in economically turbulent contexts. Strategic Management Journal, 35(13), 1972-1992. doi:10.1002/smj.2189
Ghemawat, P. (1993). The risk of not investing in a recession. Sloan Management Review, 34, 51-51. Retrieved from http://sloanreview. mit.edu/
Greer, C. R., & Ireland, T. C. (1992). Organizational and inancial correlates of a “contrarian” human resource investment strategy. Academy of Management Journal, 35(5), 956-984.
Harrison, R. J., Lin, Z., Carroll, G. R., & Carley, K. M. (2007). Simulation modeling in organizational and management research. Academy of Management Review, 32(4), 1229-1245. doi:10.5465/ AMR.2007.26586485
Isobe, T., Makino, S., & Montgomery, D. B. (2000). Resource commitment, entry timing, and market performance of foreign direct investments in emerging economies: The case of Japanese international joint ventures in China. Academy of Management Journal, 43(3), 468-484. Josefy, M., Kuban, S., Ireland, R. D., & Hitt, M. (2015). All things great and small: Organizational size, boundaries of the irm, and a changing environment. Academy of Management Annals, 9(1), 715-802. doi:10 .1080/19416520.2015.1027086
Klepper, S., & Graddy, E. (1990). The evolution of new industries and the determinants of market structure. RAND Journal of Economics, 21(1), 27-44.
Klepper, S. (1997). Industry life cycles. Industrial and Corporate Change, 6(1), 145-181. doi:10.1093/icc/6.1.145
Lieberman, M., & Montgomery, D. (1988). First-mover advantages.
Strategic Management Journal, 9(S1), 41-58. doi:10.1002/ smj.4250090706
Lieberman, M., & Montgomery, D. (1998). First-mover (dis)advantages: retrospective and link with resource-based view. Strategic Management Journal, 19(12), 1111-1125.
Mascarenhas, B. (1992). Order of entry and performance in international markets. Strategic Management Journal, 13(7), 499-510. doi:10.1002/ smj.4250130703
Mascarenhas, B., & Aaker, D. A. (1989). Strategy over the business cycle. Strategic Management Journal, 10(3), 199-210. doi:10.1002/ smj.4250100302
Mendoza, E. G. (2006). Lessons from debt-delation theory of sudden stops. American Economic Review, 96(2), 411-416.
Miller, K. D., Zhao, M., & Calantone, R. J. (2006). Adding interpersonal learning and tacit knowledge to March’s exploration-exploitation model. Academy of Management Journal, 49(4), 709-722.
Pearce, J. A., & Michael, S. C. (2006). Strategies to prevent economic recessions from causing business failure. Business Horizons, 49(3), 201-209. doi:10.1016/j.bushor.2005.08.008
Porter, M. E. (1985). Competitive advantage. New York, USA: Free Press
Porter, M. E. (1986). Changing patterns of international competition.
California Management Review, 28(2), 9-40.
Siggelkow, N., & Rivkin, J. W. (2006). When exploration backires: Unintended consequences of multilevel organizational search.
Academy of Management Journal, 49(4), 779-795. doi:10.5465/ AMJ.2006.22083053
Suarez, F., & Lanzolla, G. (2007). The role of environmental dynamics in building a irst mover advantage theory. Academy of Management Review, 32(2), 377-392. doi:10.5465/AMR.2007.24349587
Wan, W. P., & Yiu, D. W. (2009). From crisis to opportunity: Environmental jolt, corporate acquisitions, and irm performance. Strategic Management Journal, 30(7), 791-801. doi:10.1002/smj.744