Applied nutritional investigation
Triacylglycerols and body fat mass are possible independent predictors of C3 in
apparently healthy young Brazilian adults
Ana Carolina Pinheiro Volp Ph.D.
a
, Kiriaque Barra Ferreira Barbosa Ph.D.
b
, Jose
fi
na Bressan Ph.D.
c
,*
aDepartment of Clinical and Social Nutrition, School of Nutrition, Federal University of Ouro Preto, Ouro Preto, BrazilbDepartment of Nutrition, Federal University of Sergipe, Aracaju, Brazil cDepartment of Nutrition and Health, Federal University of Vic¸osa, Vic¸osa, Brazil
a r t i c l e
i n f o
Article history:
Received 9 February 2011 Accepted 20 August 2011
Keywords:
Complement factor-3 Body composition Obesity Lifestyle
Inflammation
Metabolic syndrome Triacylglycerols
a b s t r a c t
Objective:To evaluate the association between serum concentrations of complement factor-3 (C3) with anthropometric, biochemical, and lifestyle features in healthy young adults.
Methods:From 157 young healthy adults 18 to 35 y old, anthropometric measurements and body composition, systolic and diastolic blood pressures, and lifestyle data were collected and analyzed. Blood samples were collected after a 12-h fast for the determination of glucose, triacylglycerols, total cholesterol, high-density lipoprotein cholesterol, low-density lipoprotein cholesterol, insulin, C3, ceruloplasmin, and uric acid.
Results:Complement factor-3 correlated directly with body mass index (r¼0.23417,P¼0.0032), body fat mass (bioelectrical impedance analysis;r¼0.33407,P<0.0001), percentage of body fat (bioelectrical impedance analysis;r¼0.26873,P¼0.0007), waist circumference (r¼0.21266,P¼ 0.0075), insulin (r¼0.26152,P¼0.0009), homeostasis model assessment of insulin resistance (r¼ 0.24831,P¼0.0017), total cholesterol (r ¼0.23335,P¼0.0033), triacylglycerols (r¼0.38435, P<0.0001), and other outcome measurements. In the multiple linear regression analysis, tri-acylglycerols (r2¼0.1379,P<0.0001) and body fat mass (bioelectrical impedance analysis;r2¼ 0.0621,P¼0.0010) were independently associated with the C3 concentration after adjusting for age, gender, smoking status, and physical activity.
Conclusion:Complement factor-3 seems to be related to several anthropometric and biochemical measurements in healthy young adults. These results demonstrate an independent role of tri-acylglycerols, a component of the metabolic syndrome, and body fat mass as possible predictors of C3 concentrations. Thus, C3 can be used as an early marker for metabolic syndrome manifestations. Ó2012 Elsevier Inc. All rights reserved.
Introduction
Adipose tissue is an active endocrine organ that secretes
several factors called
adipokines
, such as complement factor-3
(C3), which play a role in some in
fl
ammatory manifestations
associated with obesity and the metabolic syndrome (MS)
[1,2]
.
The third component of the complement system, C3, is
a multifunctional protein because it plays a central role in the
activation of three pathways of the complement system (classic,
alternative, and lectin pathways)
[3,4]
. C3 is an adipokine
produced primarily by the liver
[5]
, but adipose tissue
[3]
and
activated macrophages also produce the molecule
[6]
. In addition
to its role in exercise and many important immune system
functions, C3 behaves like an acute-phase protein and is
synthesized by hepatocytes in response to interleukin-1
b
, which
is secreted by activated macrophages
[3,7]
at the site of in
fl
am-mation. In this context, C3 has been studied because of its
expression and secretion by adipose tissue
[3]
.
An increase in C3 concentrations is associated with increases
in fasting plasma glucose, triacylglycerol concentrations
[8]
,
insulin resistance (IR)
[9]
, body mass index (BMI), waist
circumference (WC), body fat
[8]
, and body weight gain
[9]
. Thus,
these results suggest that C3 may be a risk factor for developing
type 2 diabetes
[10]
and obesity
[9]
and a risk indicator for
coronary heart disease
[11]
. Nevertheless, in addition to the MS
This work was supported by scholarships from the Coordination for theImprovement of Higher Education of the Ministry of Education of Brazil and a grant from the Foundation for Research Support of Minas Gerais proposal (CDS 303/06).
*Corresponding author. Tel.:þ55-313-899-3388; fax:þ55-313-899-2541.
E-mail address:[email protected](J. Bressan).
0899-9007/$ - see front matterÓ2012 Elsevier Inc. All rights reserved.
doi:10.1016/j.nut.2011.08.014
Contents lists available at
ScienceDirect
Nutrition
and C-reactive protein, C3 has been helpful for identifying people
with components of MS
[12]
and conferring their risk for
cardiovascular disease
[12]
.
Besides the association between anthropometric
measure-ments and body composition with in
fl
ammation, several risk
factors related to lifestyle have been associated with in
fl
amma-tion
[13]
. The effect of these parameters on the in
fl
ammation and
the cumulative effect of several risk factors have not been suf
fi
-ciently explored
[14]
.
The aim of this study was to evaluate the associations
between C3 and anthropometric measurements, body
compo-sition, and speci
fi
ed biochemical and lifestyle features in healthy
young adults.
Materials and methods
Subjects
In this study, 157 healthy subjects 18 to 35 y old were recruited to participate
(91 women and 66 men, 23.33.5 y old, BMI 22.02.9 kg/m2). The initial
enrollment screening included evaluations to exclude subjects with evidence of
any disease related to chronic inflammation, oxidative stress, hydric unbalance,
and changes in body composition, nutrient absorption, or metabolism. Other exclusion criteria were drug or nutritional treatments that affect energy balance,
dietary intake, lipid profile, insulin levels, and glucose metabolism; contraceptive
use up to 2 mo before participation in this study; and recent diets designed for weight loss or unstable weight in the previous 6 mo. In accordance with the principals of the Declaration of Helsinki, each participant provided a written informed consent to participate after a clear explanation of the study protocol. The study was approved by the committee of ethics in research with humans of
Vic¸osa University, Minas Gerais State, Brazil (official reference no. 009/2006).
Anthropometric, body composition, and blood pressure assessments
Body weight was measured to the nearest 0.1 kg using an electronic micro-digital scale balance (model TBF-300A, Tanita, Tokyo, Japan). Height was measured with a stadiometer (model 206, Seca, Hamburg, Germany) to the
nearest 0.1 cm[15]. From those measurements, the BMI was calculated[16].
Thereafter, the BMI was calculated and used to categorize the underweight/
normal weight (BMI24.9 kg/m2) and overweight/obesity (BMI25.0 kg/m2) of
the volunteers according to the World Health Organization[16]. The WC, hip
circumference (HC)[16], and arm circumference[17]were measured with an
inelastic andflexible tape to the nearest 0.1 cm. The waist-to-hip ratio was also
calculated[16]. Triceps, biceps, subscapular, and suprailiac skinfold thicknesses
(STs) were measured to the nearest 1 mm using a skinfold caliper (Lange caliper,
Cambridge Scientific Industries, Inc., Cambridge, MD, USA) according to a
previ-ously described protocol[18]. The sum of four STs was calculated, and the
percentage of body fat (%BF) was estimated according to equations published
previously[19,20]. Also, the arm fat area (AFA; square centimeters) and
adipo-se–muscle arm index (A-MAI)[17]were calculated. Measurements of body fat
mass (BFM; kilograms), fat-free mass (kilograms), and %BF were determined using a body composition analyzer (model 310, Biodynamics, Seattle, WA, USA)
[21]. Systolic and diastolic blood pressures were measured by a mercury
sphygmomanometer (BIC, S~ao Paulo, Brazil) to the nearest 2 mmHg, as described
previously[22].
Analyses of biological samples
Blood samples were drawn by vein puncture after a 12-h overnight fast. The ethylenediaminetetra-acetic acid plasma and serum samples were separated
from whole blood by centrifugation at 2465gat 5C for 15 min (model 5804R,
Eppendorf AG, Hamburg, Germany) and were immediately stored at 80C until
the assay. Serum C3, glucose, total cholesterol, triacylglycerols, high-density lipoprotein cholesterol (HDL-C), total proteins, uric acid, and ceruloplasmin concentrations (milligrams per deciliter) were assessed by automatized colori-metric or turbidicolori-metric assays (model BS-200, Shenzhen Mindray Bio-medical
Electronics Co., Nanshan, China) with specific commercially available kits
(Bioclin, Quibasa, Minas Gerais, Brazil). Low-density lipoprotein cholesterol (LDL-C) data were calculated by the Friedewald equation, as described elsewhere
[23]. Then, the ratio of total cholesterol to HDL-C (atherogenic index) was
calculated [24]. Plasma insulin concentrations (sensitivity 2 mU/mL) were
measured by an enzyme-linked immunosorbent assay kit using a specific
monoclonal antibody, 4E6, as described by the supplier (Mercodia, Uppsala, Sweden). Also, to determine sensitivity to insulin, the homeostasis model
assessment of IR (HOMA-IR) was calculated[25].
Lifestyle assessments
For non-dietary covariates, a questionnaire on lifestyle habits was used to collect lifestyle information such as smoking (number of smokers and non-smokers), regularly practiced sports activities (yes or no), and pattern of phys-ical activity (hours per week). To quantify the amount (Pattern) of physphys-ical activity, a metabolic equivalent index (MET) was calculated to denote a multiple of the resting metabolic rate for each physical activity performed during the week
and weekend. These values were then converted into METs per hour[26].
Statistical methods
The Shapiro–Wilk normality test was used to determine the variable
distribution. Comparisons between groups were made by a Wilcoxon–Mann–
Whitney Utest. Spearman correlation coefficients were used to screen for
statistical associations between C3 concentrations (dependent variable) and the variables of interest. A multiple regression model was used to identify possible predictors of C3 using the technique of indirect elimination (backward) for the selection of variables and including the variables gender, smoking, and physical activity (qualitative variables) as indicator variables. Then, these analyses were performed for a subgroup without IR. For these analyses, IR was considered
when the HOMA-IR wasp90 (HOMA-IR 3.79). Results are presented as
median (interquartile range). Multiple regression coefficients (b) were
described using 95% confidence intervals.P<0.05 was considered statistically
significant. Statistical analyses were performed using SAS 9.0 (SAS Institute,
Cary, NC, USA).
Results
Anthropometric, biochemical data, and lifestyle features
assessments
The general characteristics for age, anthropometric and
biochemical data, body composition, data on systolic and
dia-stolic blood pressures, and METs are presented in
Table 1
. The
anthropometric data showed that BFM (bioelectrical impedance
analysis [BIA]) and WC were signi
fi
cantly greater in women and
men, respectively (
P
<
0.05;
Table 2
).
According to nutritional status, the total sample of volunteers
consisted of 86.6% (
n
¼
136) with underweight/normal weight
and 13.4% (
n
¼
21) with overweight or obesity according to the
World Health Organization (WHO) categorization
[16]
. Except for
age, all anthropometric and body composition measurements
were signi
fi
cantly higher in overweight/obese volunteers (
P
<
0.05). For the sample divided by nutritional status,
concentra-tions of C3, glucose, insulin, and uric acid, values of HOMA-IR,
and the atherogenic index were higher in the overweight or
obese group compared with the low-weight/normal-weight
group (
P
<
0.05; data not shown).
For the data indicating the lifestyle of volunteers, 10.8% and
89.2% of the volunteers were smokers and non-smokers,
respectively, (
n
¼
15/124) and 71.95% and 28.05% of the
volun-teers participated or did not participate regularly in sports
activities, respectively (
n
¼
100/39). Only 88.53% of the
volun-teers returned the lifestyle habits questionnaire (
n
¼
139).
Correlations between C3 and adiposity indicators, IR, and MS
The correlations between C3 and age, anthropometric and
biochemical data, body composition, data on systolic and
dia-stolic blood pressures, and MET are presented in
Table 3
.
For the total volunteer sample, the correlations between C3
and anthropometric measurements and body composition
demonstrated a direct and signi
fi
cant association between C3
and BMI, tricipital ST, bicipital ST, subscapular ST, suprailiac ST,
the sum of the four STs, %BF (ST), BFM (BIA), %BF (BIA), AFA,
A-MAI, WC, and HC (
P
<
0.05). The correlation between C3 and
a direct and signi
fi
cant association between C3 and insulin,
HOMA-IR, total cholesterol, triacylglycerols, the atherogenic
index, and ceruloplasmin (
P
<
0.05). There was no correlation
between C3 and age and blood pressure (
P
>
0.05).
For the subgroup without IR, the correlations between C3 and
anthropometric measurements and body composition
demon-strated a direct and signi
fi
cant association between C3 and
tri-cipital ST, bitri-cipital ST, subscapular ST, suprailiac ST, the sum of
the four STs, %BF (ST), BFM (BIA), %BF (BIA), AFA, A-MAI, WC, and
HC (
P
<
0.05). The correlation between C3 and the biochemical
characteristics of the volunteers demonstrated a direct and
signi
fi
cant association between C3 and insulin, HOMA-IR, total
cholesterol, triacylglycerols, LDL-C, the atherogenic index, and
ceruloplasmin (
P
<
0.05). There was no correlation between C3
and age and blood pressure (
P
>
0.05).
Possible predictive factors for C3 concentrations
Based on the relation between the biochemical and
anthro-pometric data, body composition and lifestyle indicators with C3,
we performed a multiple linear regression analysis to assess the
possible predictors of C3 concentrations.
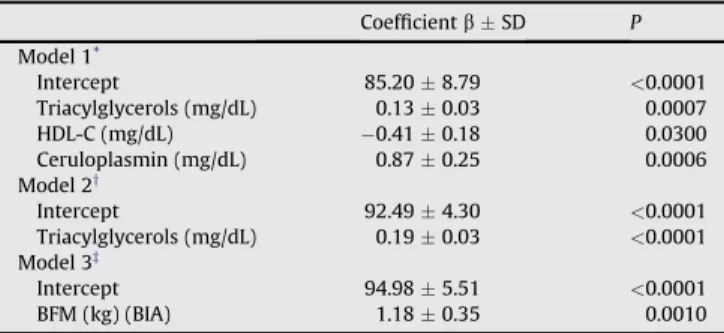
For the total volunteer sample, with regard to the biochemical
data, the model that best explained the variation (20.48%) in C3
concentrations was de
fi
ned by the following regression equation:
C3
¼
85.20
þ
0.13
triacylglycerols
0.41
HDL-C
þ
0.87
ceruloplasmin (
P
<
0.05;
Table 4
, model 1). When we inserted the
indicator variables gender, smoking, and physical activity, the
model explained 13.79% of the C3 concentrations and was de
fi
ned
by the following regression equation: C3
¼
92.49
þ
0.19
tri-acylglycerols (
P
<
0.05;
Table 4
, model 2;
Fig. 1
). In this model,
there were no signi
fi
cant effects of gender, smoking, or physical
activity (PA) (
P
>
0.05).
For anthropometric data and body composition, blood
pres-sure, and MET, the model that best explained the variation
(6.21%) in C3 concentration was de
fi
ned by the following
regression equation: C3
¼
94.98
þ
1.18
BFM determined by BIA
(
P
<
0.05;
Table 4
, model 3). When we inserted the indicator
variables gender, smoking, and physical activity, the model
remained unchanged (
P
<
0.05;
Table 4
, model 3;
Fig. 2
),
and there were no signi
fi
cant effects of gender, smoking, or PA
(
P
>
0.05). All models were adjusted for age.
For the subgroup without IR, with respect to the biochemical
data, the model that best explained the variation (18.71%) in C3
concentrations was de
fi
ned by the following regression equation:
C3
¼
58.68
þ
0.16
triacylglycerols
þ
3.81
uric acid
þ
0.61
ceruloplasmin (
P
<
0.05;
Table 5
, model 1). When we inserted the
indicator variables gender, smoking, and physical activity, the
model explained 14.23% of the C3 concentrations and was de
fi
ned
by the following regression equation: C3
¼
88.64
þ
0.22
tri-acylglycerols (
P
<
0.05;
Table 5
, model 2). In this model, there
were no signi
fi
cant effects of gender, smoking, or PA (
P
>
0.05).
For anthropometric data and body composition, blood
pres-sure, and MET, the model that best explained the variation
Table 1
General, anthropometric, biochemical, and lifestyle data of volunteers (n¼157)
MeanSD CI Median IQR P
C3 (mg/dL) 112.5223.56 20–171 114 102–128 <0.0012
Age (y) 23.33.5 18–35 23 21–25 <0.0001
BMI (kg/m2) 22.082.99 16.7–34.9 21.5 20.3–23.3 <0.0001
Tricipital ST (mm) 18.136.88 5.0–41.0 18.0 13.0–22.5 0.0185
Bicipital ST (mm) 7.273.80 2.0–23.0 7.0 4.0–9.0 <0.0001
Subscapular ST (mm) 17.717.31 7.0–43.0 15.5 12.5–20.5 <0.0001
Suprailiac ST (mm) 18.038.95 4.5–48.0 18.03 11.0–22.5 <0.0001
Sum of 4 STs (mm) 61.1523.85 21.5–148.0 57.0 42.3–75.0 <0.0001
%BF (ST) 25.337.50 8.1–42.3 26.5 19.0–31.2 0.0021
BFM (kg) (BIA) 14.795.18 4.9–41.1 13.80 11.1–17.4 <0.0001
FFM (kg) (BIA) 47.5710.12 20.6–72.0 45.30 39.5–55.9 0.0003
%BF (BIA) 23.576.48 9.4–38.3 23.50 18.7–28.25 0.1336
AC (cm) 28.133.71 21.0–39.5 27.50 25.5–30.0 0.0006
AFA (cm2) 22.759.15 5.93–60.6 22.2 15.97–27.4 <0.0001
A-MAI 0.620.31 0.12–1.48 0.58 0.38–0.81 0.0003
WC (cm) 78.08.51 60.0–100.0 77.0 71.5–83.0 <0.0001
HC (cm) 95.476.72 69.0–114.5 95.5 91.0–100.0 0.2554
WHR 0.810.06 0.65–1.01 0.82 0.78–0.85 0.3008
Systolic blood pressure (mmHg) 109.40.93 90–140 110 100–120 <0.0001
Diastolic blood pressure (mmHg) 73.30.66 60–90 70 70–80 <0.0001
Glucose (mg/dL) 90.316.26 72–106 90 87–94 0.31
Insulin (mU/mL) 10.105.63 0.49–45.46 9.50 6.55–12.95 <0.001
HOMA-IR index 2.261.27 0.11–9.08 2.14 1.43–2.86 <0.001
Total cholesterol (mg/dL) 159.6631.22 100–268 157 140–177 <0.0001
Triacylglycerols (mg/dL) 100.1544.62 34–373 91 69–121 <0.0001
HDL-C (mg/dL)* 4610,46 21–71 45 38–53 <0.003
LDL-C (mg/dL) 95.6826.93 41.8–181.6 91.20 78.4–109.6 <0.001
Atherogenic index* 3.560.80 2.21–8.24 3.47 3.06–4.0 <0.0001
Total proteins (mg/dL) 6.740.38 5.9–7.8 6.8 6.5–7.0 0.2097
Uric acid (mg/dL) 3.561.06 1.1–6.5 3.4 2.8–4.2 0.1370
Ceruloplasmin (mg/dL) 37.218.36 21.4–56.2 34.8 31.1–43.1 <0.001
METy 76.9323.60 31.3
–197.7 72.25 60.80–88.60 <0.0001
AC, arm circumference; AFA, arm fat area; A-MAI, adipose–muscle arm index; %BF, percentage of body fat; BFM, body fat mass; BIA, bioelectrical impedance analysis;
BMI, body mass index; C3, complement factor-3; CI, confidence interval; FFM, fat-free mass; HC, hip circumference; HDL-C, high-density lipoprotein cholesterol;
HOMA-IR, homeostasis model assessment of insulin resistance; IQR, interquartile range (quartiles 1–3); LDL-C, low-density lipoprotein cholesterol; MET, metabolic equivalent
index; ST, skinfold thickness; WC, waist circumference; WHR, waist-to-hip ratio
Test of normality: Shapiro-Wilk,P<0.05
*For 150 volunteers.
(5.11%) in C3 concentration was de
fi
ned by the following
regression equation: C3
¼
95.70
þ
1.05
BFM determined by BIA
(
P
<
0.05;
Table 5
, model 3). When we inserted the indicator
variables gender, smoking, and physical activity, the model
remained unchanged (
P
<
0.05;
Table 5
, model 3), and there were
no signi
fi
cant effects of gender, smoking, or PA (
P
>
0.05). All
models were adjusted for age.
Discussion
In this study, after the correlation analysis, there was a direct
and signi
fi
cant association of C3 with BMI (all volunteers) and
adiposity measurements, including the tricipital, bicipital,
sub-scapular, and suprailiac STs, the sum of the four STs, %BF (ST),
BFM (BIA), %BF (BIA), AFA, A-MAI, WC, and HC (
P
<
0.05).
Nevertheless, when the analysis was performed by multiple
linear regression to assess the possible predictors of C3
concentrations, for the total volunteer sample, BFM (BIA)
explained 6.21% of the variation in C3 concentration. For this
sample of volunteers, for each 1-kg increase in BFM (BIA), the C3
concentrations increased 1.18 mg/dL (
P
<
0.05). For the subgroup
without IR, BFM (BIA) explained 5.11% of the variation in C3
concentration. For this subgroup of volunteers, for each 1-kg
increase in BFM (BIA), C3 concentrations increased 1.05 mg/dL
(
P
<
0.05). Nevertheless, BFM (BIA) explained variations in C3
regardless of gender, smoking, and physical activity. In this
context, and in accordance with our results, in
fl
ammation can
occur in individuals independently of BMI but dependently and
proportionally of BFM. This fact demonstrates that volunteers
classi
fi
ed as being underweight/normal weight
[16]
can also
present excesses of BFM and IR.
Complement factor-3 is a protein of liver in
fl
ammation
[5]
,
but activated macrophages and adipose tissue also synthesize C3
[3,6]
, thus explaining the relation between C3 and adiposity. In
addition, the fragment of C3 (C3adesArg), also known as
acylation-stimulating protein
(ASP), is a hormone produced by
adipocytes as a result of the interaction of C3, factor B, and
adipsin (factor D)
[27]
. ASP stimulates glucose transport through
the membrane and the synthesis of triacylglycerols in
adipo-cytes, an action independent and additional to that exerted by
insulin
[28]
. Thus, C3 and ASP are increased in individuals with
excess adiposity and with obesity
[27]
, con
fi
rming the C3 results
found in this study.
The relation between adiposity, particularly central obesity
(visceral), and the increased production of hepatic in
fl
ammatory
proteins has been described by some researchers
[29,30]
.
The expansion of adipose tissue leads to adipocyte hypertrophy
and hyperplasia, and these large adipocytes decrease the local
supply of oxygen, leading to autonomous cell hypoxia with the
resultant activation of cellular stress pathways (oxidative or
Table 2
General, anthropometric, biochemical, and lifestyle data of volunteers by gender (n¼157)
Women (n¼91) Men (n¼66) P
Median IQR Median IQR
C3 (mg/dL) 115 101–131 110 102–123 0.2433
Age (y) 23 21–25 22 20–25 0.0309
BMI (kg/m2) 21.1 19.7
–23.0 22.45 21.0–24.4 <0.0016
Tricipital ST (mm) 21.0 17.0–24.5 14.25 10.0–17.5 <0.0001
Bicipital ST (mm) 8.0 6.5–11.0 4.0 3.0–6.0 <0.0001
Subscapular ST (mm) 16.7 13.0–22.0 15.0 11.0–18.5 0.0606
Suprailiac ST (mm) 20.0 15.0–24.0 12.0 9.0–17.0 <0.0001
Sum of 4 STs (mm) 66.0 52.0–80.5 46.7 35.0–57.0 <0.0001
%BF (ST) 30.2 26.5–33.1 17.7 14.7–20.1 <0.0001
BFM (kg) (BIA) 15.1 12.8–17.6 12.05 9.8–15.2 <0.0001
FFM (kg) (BIA 40.7 36.9–44.0 57.8 52.3–62.2 <0.0001
%BF (BIA) 26.8 23.8–31.0 17.65 15.0–20.7 <0.0001
AC (cm) 26.5 24.5–28.0 29.7 28.0–33.0 <0.0001
AFA (cm2) 23.59 18.31–30.09 18.57 13.9–24.6 0.0007
A-MAI 0.75 0.59–0.97 0.38 0.26–0.48 <0.0001
WC (cm) 76.5 69.5–82.5 79.25 74.5–86.0 0.0103
HC (cm) 96.0 91.5–100.0 94.5 90.0–99.0 0.1265
WHR 0.80 0.75–0.84 0.84 0.81–0.89 <0.0001
Systolic blood pressure (mmHg) 110 100–110 110 110–120 <0.0001
Diastolic blood pressure (mmHg) 70 70–80 80 70–80 0.0001
Glucose (mg/dL) 88 85–92 92 88–97 0.0002
Insulin (mU/mL) 10.16 6.88–13.27 8.64 6.06–12.04 0.2687
HOMA-IR index 2.21 1.44–2.97 1.96 1.37–2.77 0.4837
Total cholesterol (mg/dL) 165 145–187 146 134–160 <0.0001
Triacylglycerols (mg/dL) 99 79–127 81.5 67–101 0.0038
HDL-C (mg/dL)* 52 45–57 38 36–43 <0.0001
LDL-C (mg/dL) 98.2 77.8–114.4 87.7 78.4–102.8 0.0751
Atherogenic index* 3.29 2.83–3.76 3.73 3.39–4.17 <0.0001
Total proteins (mg/dL) 6.7 6.4–7.0 6.8 6.6–7.0 0.0290
Uric acid (mg/dL) 3.0 2.4–3.5 4.15 3.6–4.8 <0.0001
Ceruloplasmin (mg/dL) 41 33.0–48.5 31.6 29.2–34.4 <0.0001
METy 76 60.3–89.7 71.7 62.3–84.3 0.1572
AC, arm circumference; AFA, arm fat area; A-MAI, adipose–muscle arm index; %BF, percentage of body fat; BFM, body fat mass; BIA, bioelectrical impedance analysis;
BMI, body mass index; C3, complement factor-3; FFM, fat-free mass; HC, hip circumference; HDL-C, high-density lipoprotein cholesterol; HOMA-IR, homeostasis model
assessment of insulin resistance; IQR, interquartile range (quartiles 1–3); LDL-C, low-density lipoprotein cholesterol; MET, metabolic equivalent index; ST, skinfold
thickness; WC, waist circumference; WHR, waist-to-hip ratio
For differences between groups: Wilcoxon–Mann–WhitneyUtest,P<0.05
*For 85 women and 65 men.
y
in
fl
ammatory). This in
fl
ammation leads to an autonomous cell
(autocrine effect) and the release of cytokines and other
proin-fl
ammatory signals. Like resistin, leptin and adiponectin, which
are secreted by adipocytes, adipokines may also affect in
fl
am-mation and IR. As part of the chronic in
fl
ammatory process
and with low intensity, locally secreted chemokines attract
proin
fl
ammatory macrophages to adipose tissue that form
a crown-shaped structure around the large, dead, and/or in
fi
rm
adipocytes. Then, these macrophages stimulate the release of
cytokines that have yet to activate in
fl
ammatory pathways in
adipocytes and other tissues, such as hepatocytes (autocrine and
paracrine effect), aggravated in
fl
ammation, and IR
[29,30]
. Thus,
hepatic in
fl
ammation can occur in individuals with an excess of
adiposity because the activation of in
fl
ammatory pathways may
be the result of steatosis and/or increased airway responses to
stress in hepatocytes. This can result in the in
fl
ammation of
autonomous hepatocytes (autocrine effect). The Kupffer cells
(liver cells resembling macrophages) may also become activated,
thus stimulating the local release of cytokines that further
aggravate hepatic in
fl
ammation and IR. In addition, caloric
surplus and an excess of adiposity are frequently accompanied by
increased concentrations of circulating and tissue free fatty acids,
and these can directly activate proin
fl
ammatory responses in
vascular endothelial cells, adipocytes, and myeloid cells
[29,30]
.
The result of these physiologic events induced by an excess of
adiposity is the development of systemic in
fl
ammation
[30]
.
Thus, it seems that the process is bidirectional and additive; C3 is
produced by fat tissue, and its concentration can increase
because of a larger supply of BF; C3 is still a liver protein of
systemic in
fl
ammation, and its concentration can increase with
greater in
fl
ammation independent of hepatocytes (steatosis
from cellular hypoxia generated by an excess of BFM).
In regard to the biochemical data, there was a direct and
signi
fi
cant association of C3 with total cholesterol,
triacyl-glycerols, LDL-C (subgroup without IR), the atherogenic index,
insulin, HOMA-IR, and ceruloplasmin (
P
<
0.05). When we
applied multiple linear regression analysis to assess the possible
predictors of C3, for the total volunteer sample, triacylglycerols,
HDL-C, and ceruloplasmin explained 20.48% of the variation in
C3 concentration (
P
<
0.05). For this sample of volunteers, for
each increase of 1.0 mg/dL in triacylglycerols and 1.0 mg/dL in
ceruloplasmin, there were 0.13- and 0.87-mg/dL increases in C3
Table 4
Multiple linear regression models to predict possible complement factor-3
concentrations (n¼157)
CoefficientbSD P
Model 1*
Intercept 85.208.79 <0.0001
Triacylglycerols (mg/dL) 0.130.03 0.0007
HDL-C (mg/dL) 0.410.18 0.0300
Ceruloplasmin (mg/dL) 0.870.25 0.0006
Model 2y
Intercept 92.494.30 <0.0001
Triacylglycerols (mg/dL) 0.190.03 <0.0001
Model 3z
Intercept 94.985.51 <0.0001
BFM (kg) (BIA) 1.180.35 0.0010
BFM, body fat mass; BIA, bioelectrical impedance analysis; HDL-C, high-density lipoprotein cholesterol
*Variables included were age, glucose, insulin, homeostasis model assessment
of insulin resistance index, total cholesterol, triacylglycerols, HDL-C, total
proteins, uric acid, and ceruloplasmin (r2¼0.2048,P
<0.0001).
yAdjusted for the variables gender, smoking, and physical activity. Variables
included were age, glucose, insulin, homeostasis model assessment of insulin resistance index, total cholesterol, triacylglycerols, HDL-C, total proteins, uric
acid and ceruloplasmin (r2¼0.1379,P<0.0001).
zWith and without adjustment for the variables gender, smoking, and
phys-ical activity. Variables included were age, body mass index; tricipital, bicipital, subscapular, and suprailiac skinfold thicknesses; fat-free mass (BIA); BFM (BIA), percentage of body fat (BIA); arm circumference, waist circumference; hip circumference; systolic blood pressure; diastolic blood pressure; and the
meta-bolic equivalent index (r2¼0.0621,P¼0.0010).
Fig. 1.Independent association between triacylglycerol concentration and C3
(n¼157). C3, complement factor-3.
Table 3
Correlations between complement factor-3 and general, anthropometric, biochemical, and lifestyle data of volunteers
Total volunteers
(n¼157)
Subgroup without
IR*(n¼139)
r P r P
Age (y) 0.00770 0.9237 0.00391 0.9636
BMI (kg/m2) 0.23417 0.0032 0.16546 0.0516
Tricipital ST (mm) 0.27422 0.0005 0.24573 0.0035
Bicipital ST (mm) 0.23631 0.0029 0.19630 0.0206
Subscapular ST (mm) 0.28093 0.0004 0.23860 0.0047
Suprailiac ST (mm) 0.25729 0.0011 0.22538 0.0076
Sum of 4 STs (mm) 0.31070 <0.0001 0.27020 0.0013
%BF (ST) 0.26380 0.0008 0.23968 0.0045
BFM (kg) (BIA) 0.33407 <0.0001 0.29898 0.0003
FFM (kg) (BIA 0.05912 0.4620 0.02860 0.7382
%BF (BIA) 0.26873 0.0007 0.28288 0.0007
AC (cm) 0.10047 0.2106 0.5464 0.5229
AFA (cm2) 0.28191 0.0003 0.24103 0.0043
A-MAI 0.26581 0.0008 0.24769 0.0033
WC (cm) 0.21266 0.0075 0.19529 0.0212
HC (cm) 0.25132 0.0015 0.22443 0.0079
WHR 0.07694 0.3381 0.07507 0.3798
Systolic blood pressure (mmHg) 0.07993 0.3197 0.03493 0.6831
Diastolic blood pressure (mmHg) 0.2969 0.7120 0.00689 0.9358
Glucose (mg/dL) 0.01891 0.8141 0.05154 0.5468
Insulin (mU/mL) 0.26152 0.0009 0.19175 0.0237
HOMA-IR index 0.24831 0.0017 0.17403 0.0405
Total cholesterol (mg/dL) 0.23335 0.0033 0.27754 0.0009
Triacylglycerols (mg/dL) 0.38435 <0.0001 0.35954 <0.0001
HDL-C (mg/dL)y
0.01804 0.8266 0.06555 0.4552
LDL-C (mg/dL) 0.12770 0.1110 0.17879 0.0352
Atherogenic indexy 0.19622 0.0161 0.17229 0.0482
Total proteins (mg/dL) 0.14448 0.0710 0.16650 0.0501
Uric acid (mg/dL) 0.10596 0.1866 0.8308 0.3309
Ceruloplasmin (mg/dL) 0.37139 <0.0001 0.38127 <0.0001
METz
0.02036 0.8126 0.02771 0.7629
AC, arm circumference; AFA, arm fat area; A-MAI, adipose–muscle arm index; %
BF, percentage of body fat; BFM, body fat mass; BIA, bioelectrical impedance analysis; BMI, body mass index; FFM, fat-free mass; HC, hip circumference; HDL-C, high-density lipoprotein cholesterol; HOMA-IR, homeostasis model assess-ment of insulin resistance; IR, insulin resistance; LDL-C, low-density lipoprotein cholesterol; MET, metabolic equivalent index; ST, skinfold thickness; WC, waist circumference; WHR, waist-to-hip ratio
Test of correlation: Spearman,P<0.05
*IR was considered when the HOMA-IR wasp90 (HOMA-IR3.79).
For total volunteers:yn¼150,zn¼139.
concentrations, respectively. Similarly, each 1.0-mg/dL decrease
in HDL-C correlated with a 0.41-mg/dL increase in C3
concen-tration (
P
<
0.05). For the subgroup without IR, triacylglycerols,
uric acid, and ceruloplasmin explained 18.71% of the variation in
C3 concentration (
P
<
0.05). For this sample of volunteers, for
each increase of 1.0 mg/dL in triacylglycerols, 1.0 mg/dL in uric
acid, and 1.0 mg/dL in ceruloplasmin, there were increases
of 0.16, 3.81, and 0.61 mg/dL in C3 concentrations, respectively
(
P
<
0.05). Nevertheless, triacylglycerols explained the variations
in C3 regardless of gender, smoking, and physical activity.
Studies have con
fi
rmed that C3 is correlated with fasting
insulin
[31]
, IR
[32]
, and total cholesterol
[31,33]
. However, C3
concentrations are higher in obese non-diabetics and type 2
diabetics than in healthy men, whereas C3 concentrations are
similar between obese non-diabetics and type 2 diabetics and
between type 1 diabetics and lean, healthy young men. In the
same study, C3 concentrations did not differ between healthy
men and young adults
[34]
. It is noteworthy that in this study
there was no correlation between C3 and age, and all models of
multiple linear regression analysis remained unchanged when
adjusted for age. Although the age of the volunteers was
restricted to young adults (18
–
35 y), this result is consistent with
a study that showed that C3 was not modi
fi
ed by age
[34]
.
The positive correlations between C3 concentrations and
triacylglycerols is consistent with others studies
[11,12]
. The
relation between C3 and biochemical measurements can be
explained by the products of metabolism, i.e., ASP is a hormone
also produced by adipocytes as a result of the interaction of C3,
factor B, and adipsin (factor D)
[27]
. The events stimulate glucose
transport through membranes and increase the synthesis of
triacylglycerols in adipocytes, an action independent and
addi-tional to that exerted by insulin
[28]
. Just as for C3, ASP
concentrations are increased in individuals with excess adiposity
and obesity, diabetes, and cardiovascular disease
[27]
. Although
the receptors and signaling mechanisms mediated by ASP are
still unknown, there is evidence that ASP is involved in the
activation of glucose transport and the stimulation of its
absorption. As a result, ASP increases the re-esteri
fi
cation of fatty
acids, the ef
fi
ciency of triacylglycerol synthesis in adipocytes
through the paracrine and autocrine effects, and the activation of
diacylglycerol acyl-transferase and inhibits hormone-sensitive
lipase activity and lipolysis
[27,35]
. The result of the action of
ASP is a rapid postprandial lipid clearance. Therefore, the C3/ASP
system has been proposed to be a regulator of fatty acid
metabolism in adipose tissue
[36]
. Nonetheless, it is noteworthy
that C3 is an in
fl
ammatory biomarker; thus, the direct
associa-tion between C3 and ceruloplasmin (a glycoprotein family
member of in
fl
ammation-sensitive proteins)
[37,38]
in the
present study is expected.
Thus, in
fl
ammation assessed by C3 appears to be modulated by
anthropometry and body composition and by biochemical factors,
and MS components seem to be good indicators of subclinical
in
fl
ammation. These results are con
fi
rmed by the scienti
fi
c
litera-ture. One study demonstrated that C3 was independently
associ-ated with measurements of adiposity and triacylglycerols
[11]
. In
our study, in a model with all covariates added, measurements of
adiposity (BFM) and triacylglycerols also were independent
possible predictors of C3 concentrations. In fact, C3 is partly
secreted by adipocytes
[6]
and its fragment, ASP, is a potent
simulator of glucose transport and triacylglycerol synthesis
[27,35]
.
Other investigators have shown that a high C3 concentration
is associated with cardiovascular diseases
[39]
, WC, and high
triacylglycerol concentrations in the fasting and postprandial
states, proposing that it is a coronary risk factor
[11]
, a risk factor
for the development of diabetes
[10]
and obesity
[34]
, and
a useful marker for identifying people with MS
[12]
.
These results are clinically important because the association
between C3 and the development of atherosclerosis (myocardial
infarction) can occur from the following mechanisms: 1)
vulnerable plaques rich in macrophages and lipid may represent
a source of the direct or indirect production of C3, which can thus
be a marker for the presence of these plaques; 2) some C3
fragments and other cytokines
[31,40]
are associated with MS
and a pro-atherogenic state, including IR and C3 (with other
cytokines), and may play a causal role; and 3) these mechanisms
can coexist in a circular process in which vulnerable plaques
producing cytokines and C3 can trigger MS, which then
promotes the growth of existing plaques and the formation of
new plaques
[40]
.
Our study had certain limitations. Because the nature of this
study was cross-sectional, we cannot prove that the reported
associations are causal because residual confounding may have
affected the observed associations, although we controlled for
Fig. 2.Independent association between body fat mass and C3 (n¼157). BIA,
bioelectrical impedance analysis; C3, complement factor-3.
Table 5
Multiple linear regression models to predict possible complement factor-3
concentrations in volunteers without insulin resistance*(n¼139)
CoefficientbSD P
Model 1y
Intercept 58.6812.03 <0.0001
Triacylglycerols (mg/dL) 0.160.05 0.0026
Uric acid (mg/dL) 3.811.82 0.0383
Ceruloplasmin (mg/dL) 0.610.26 0.0196
Model 2z
Intercept 88.644.99 <0.0001
Triacylglycerols (mg/dL) 0.220.04 <0.0001
Model 3x
Intercept 95.705.88 <0.0001
BFM (kg) (BIA) 1.050.38 0.0074
BFM, body fat mass; BIA, bioelectrical impedance analysis
*Insulin resistance was considered when the homeostasis model assessment
of insulin resistance index wasp90 (homeostasis model assessment of insulin
resistance index3.79).
y
Variables included were age, glucose, insulin, the homeostasis model assessment of insulin resistance index, total cholesterol, triacylglycerols, high-density lipoprotein cholesterol, total proteins, uric acid, and ceruloplasmin (r2¼0.1871,P
<0.0001).
zAdjusted for the variables gender, smoking, and physical activity. Variables
included were age, glucose, insulin, the homeostasis model assessment of insulin resistance index, total cholesterol, triacylglycerols, high-density lipoprotein
cholesterol, total proteins, uric acid, and ceruloplasmin (r2¼0.1423,P<0.0001).
x
With and without adjustment for the variables gender, smoking, and phys-ical activity. Variables included were age, body mass index; tricipital, bicipital, subscapular, and suprailiac skinfold thicknesses; fat-free mass (BIA); BFM (BIA); percentage of body fat (BIA); arm circumference; waist circumference; hip circumference; systolic blood pressure; diastolic blood pressure; and the
potential covariates. However, we controlled for the more
important known factors that affect in
fl
ammation. Although the
sample size was adequate from the standpoint of the initial
association discovery, further replication in independent and
larger samples would be convenient for a future translational
application at a population level.
In summary, the present study analyzed the association
between C3 and anthropometric measurements and body
composition, biochemical parameters, and lifestyle in apparently
healthy young adults. It demonstrated also that C3 correlated
with measurements of adiposity and that BFM was a possible
predictive of C3 concentrations. C3 was correlated with the
following biochemical measurements: insulin, total cholesterol,
triacylglycerols, ceruloplasmin, HOMA-IR, and the atherogenic
index. Moreover, the possible predictors of C3 were
tri-acylglycerols and ceruloplasmin. Nevertheless, we demonstrated
an independent role for triacylglycerols, a component of MS, and
BFM as possible predictors of C3 in young healthy adults.
Conclusion
This study contributes to a better understanding of the
associations between C3 and the risk factors for the occurrence
of MS at an early stage. Triacylglycerols and BFM were possible
independent predictors of C3 in apparently healthy young
Bra-zilian adults.
Acknowledgments
The authors thank Anto
ˇ
nio Policarpo S. Carneiro, Ph.D., for
technical assistance, Elisa
ˇ
ngela Lessa and Carolina O. Resende for
their help with the data collection, and all those who
vol-unteered to participate in the study.
References
[1] Monteiro R, Azevedo I. Chronic inflammation in obesity and the metabolic
syndrome. Mediat Inflamm 2010.
[2] Onat A, Hergenc G, Can G, Kaya Z, Yuksel H. Serum complement C3: a determinant of cardiovascular risk, additive to the metabolic syndrome,
in middle-aged population. Metabolism 2010;59:628–34.
[3] Choy LN, Rosen BS, Spiegelman BM. Adipsin and an endogenous pathway of
complement from adipose cells. J Biol Chem 1992;267:12736–41.
[4] Sahu A, Lambris JD. Structure and biology of complement protein C3, a connecting link between innate and acquired immunity. Immunol Rev
2001;180:35–48.
[5] Alper CA, Johnson AM, Birtch AG, Moore FD. Human C3: evidence for the
liver as the primary site of synthesis. Science 1969;163:286–8.
[6] Zimmer B, Hartung HP, Scharfenberger G, Bitter-Suermann D, Hadding U. Quantitative studies of the secretion of complement component C3 by resident, elicited and activated macrophages. Comparison with C2, C4 and
lysosomal enzyme release. Eur J Immunol 1982;12:426–30.
[7] Baumann H, Gauldie J. The acute phase response. Immunol Today
1994;15:74–80.
[8] Puchau B, Zulet MA, Gonzalez de Echavarri A, Navarro-BlascoI, Martınez JA.
Selenium intake reduces serum C3, an earlier marker of metabolic syndrome
manifestations, in healthy young adults. Eur J Clin Nutr 2008;63:858–64.
[9] Enstrom G, Hedblad B, Janzon L, Lindgarde F. Weight gain in relation to plasma levels of complement factor 3: results from a population-based
cohort study. Diabetologia 2005;48:2525–31.
[10] Engstrom G, Hedblad B, Eriksson KF, Janzon L, Lindgarde F. Complement C3 is a risk factor for the development of diabetes: a population-based cohort
study. Diabetes 2005;54:570–5.
[11] Onat A, Uzunlar B, Hergenc¸ G, Yazici M, Sari I, Uyarel H, et al. Cross-sectional study of complement C3 as a coronary risk factor among men and
women. Clin Sci 2005;108:129–35.
[12] Van Oostrom AJHHM, Plokker HWM, Van Asbeck BS, Rabelink TJ, Van Kessel KPM, Jansen EHJM, et al. Effects of rosuvastatin on postprandial leukocytes in mildly hyperlipidemic patients with premature coronary
sclerosis. Atherosclerosis 2006;185:331–9.
[13] Lee W-Y, Jung C-H, Park J-S, Rhee E-J, Kim S-W. Effects of smoking, alcohol, exercise, education, and family history on the metabolic syndrome as
defined by the ATP III. Diabetes Res Clin Pract 2005;67:70–7.
[14] Hamer M, Stamatakis E. The accumulative effects of modifiable risk factors
on inflammation and haemostasis. Brain Behav Immun 2008;22:1041–3.
[15] Jelliffe DB. Evolucion del estado de nutricion de la comunidad. Ginebra:
Organizacion Mundial de la Salud; 1968.
[16] World Health Organization/Food and Agriculture Organization. Diet, nutrition and the prevalence of chronic diseases. Report of a joint FAO/ WHO expert consultation. Technical report series 916. Geneva: World Health Organization; 2003.
[17] Frisancho AR. New norms of upper limb fat and muscle areas for
assess-ment of nutritional status. Am J Clin Nutr 1981;34:2540–5.
[18] Durnin JVGA, Rahaman MM. The assessment of the amount of fat in the human body from measurements of skinfold thickness. Br J Nutr
1967;21:1–9.
[19] Durnin JV, Womersley J. Body fat assessed from total body density and its estimation from skinfold thickness: measurements on 481 men and
women aged from 16 to 72 years. Br J Nutr 1974;32:77–97.
[20] Siri WE. The gross composition of the body. Adv Biol Med Phys
1956;4:239–80.
[21] Lukaski HC, Johnson PE, Bolonchuk WW, Lykken GI. Assessment of fat-free mass using bioelectrical impedance measurement of the human body. Am J
Clin Nutr 1985;41:810–7.
[22] Perloff D, Grim C, Flack J, Frohlich ED, Hill M, McDonald M, et al. Human blood pressure determination by sphygmomanometry. Circulation 1993;
88:2460–70.
[23] Friedewald WT, Levy RI, Fredrickson DS. Estimation of the concentration of low-density lipoprotein cholesterol in plasma, without use of the
prepar-ative ultracentrifuge. Clin Chem 1972;18:499–502.
[24] Castelli WP. Cholesterol and lipids in the risk of coronary artery
dis-easedthe Framingham Heart Study. Can J Cardiol 1988;4:5–10.
[25] Matthews DR, Hosker JP, Rudenski AS, Naylor BA, Teacher DF, Turner RC. Homeostasis model assessment: insulin resistance and beta cell function from fasting plasma glucose and insulin concentration in man.
Dia-betologia 1985;28:412–9.
[26] Ainsworth BE, Haskell WL, Whitt MC, Irwin ML, Strath SJ, O’Brien WL, et al.
Compendium of physical activities: an update of activity codes and MET
intensities. Med Sci Sports Exerc 2000;32:498–516.
[27] Cianflone K, Xia Z, Chen LY. Critical review of acylation-stimulating protein
physiology in humans and rodents. Biochim Biophys Acta 2003;1609:127–43.
[28] Germinario R, Sniderman AD, Manuel S, Lefebvre SP, Baldo A, Katherine C. Coordinate regulation of triacylglycerol synthesis and glucose transport by
acylation-stimulating protein. Metabolism 1993;42:574–80.
[29] Kim F, Tysseling KA, Rice J, Pham M, Haji L, Gallis BM, et al. Free fatty acid impairment of nitric oxide production in endothelial cells is mediated by
IKKbeta. Arterioscler Thromb Vasc Biol 2005;25:989–94.
[30] Luca C, Olefsky JM. Inflammation and insulin resistance. FEBS Lett
2008;582:97–105.
[31] Muscari A, Massarelli G, Bastagli L, Poggiopollini G, Tomassetti V, Drago G, et al. Relationship of serum C3 to fasting insulin, risk factors and previous
ischaemic events in middle-aged men. Eur Heart J 2000;21:1081–90.
[32] Weyer C, Tataranni PA, Pratley RE. Insulin action and insulinemia are closely related to the fasting complement C3, but not acylation stimulating
protein concentration. Diabetes Care 2000;23:779–85.
[33] Muscari A, Massarelli G, Bastagli L, Poggiopollini G, Tomassetti V, Volta U, et al. Relationship between serum C3 levels and traditional risk factors for
myocardial infarction. Acta Cardiol 1998;53:345–54.
[34] Koistinen HA, Koivisto VA, Ebeling P. Serum complement protein C3 concentration is elevated in insulin resistance in obese men. Eur J Intern
Med 2000;11:21–6.
[35] Sniderman AD, Maslowska M, Cianflone K. Of mice and men (and women) and
the acylation-stimulating protein pathway. Curr Opin Lipidol 2000;11:291–6.
[36] Zulet MA, Puchau B, Navarro C, MartıA, Martınez JA. Biomarcadores del
estado inflamatorio: nexo de union con la obesidad y complicaciones
asociadas. Nutr Hosp 2007;22:511–27.
[37] Engstrom G, Stavenow L, Hedblad B, Lind P, Tyden P, Janzon L, et al.
Inflammation sensitive plasma proteins and incidence of myocardial
infarction in men with low cardiovascular risk. Arterioscler Thromb Vasc
Biol 2003;23:2247–51.
[38] Engstrom G, Stavenow L, Hedblad B, Lind P, Eriksson KF, Janzon L, et al.
Inflammation sensitive plasma proteins, diabetes, and incidence of
myocardial infarction and stroke. Diabetes 2003;52:442–7.
[39] Muscari A, Sbano D, Bastagli L, Poggiopollini G, Tomassetti V, Forti P, et al. Effects of weight loss and risk factor treatment in subjects with elevated
serum C3, an inflammatory predictor of myocardial infarction. Int J Cardiol
2005;100:217–23.
[40] Muscari A, Bastagli L, Poggiopollini G, Tomassetti V, Massarelli G, Boni P, et al. Short term effect of atorvastatin and vitamin E on serum levels of C3, a sensi-tive marker of the risk of myocardial infarction in men. Cardiovasc Drugs Ther