Genetic analysis of the
ELOVL6
gene
polymorphism associated with type 2
diabetes mellitus
Y. Liu*, F. Wang*, X.L. Yu*, Z.M. Miao, Z.C. Wang, Y. Chen and Y.G. Wang
Department of Endocrinology, The Affiliated Hospital of Medical College, Qingdao University, Qingdao, China
Abstract
Recent animal studies have indicated that overexpression of the elongation of long-chain fatty acids family member 6 (Elovl6) gene can cause insulin resistance andb-cell dysfunction. These are the major factors involved in the development of type 2 diabetes mellitus (T2DM). To identify the relationship between single nucleotide polymorphisms (SNP) ofELOVL6and T2DM pathogenesis, we conducted a case-control study of 610 Han Chinese individuals (328 newly diagnosed T2DM and 282 healthy subjects). Insulin resistance and islet first-phase secretion function were evaluated by assessment of insulin resistance in a homeostasis model (HOMA-IR) and an arginine stimulation test. Three SNPs of theELOVL6gene were genotyped with polymerase chain reaction-restriction fragment length polymorphism, with DNA sequencing used to confirm the results. Only genotypes TT and CT of the ELOVL6SNP rs12504538 were detected in the samples. Genotype CC was not observed. The T2DM group had a higher frequency of the C allele and the CT genotype than the control group. Subjects with the CT genotype had higher HOMA-IR values than those with the TT genotype. In addition, no statistical significance was observed between the genotype and allele frequencies of the control and T2DM groups for SNPs rs17041272 and rs6824447. The study indicated that theELOVL6gene polymorphism rs12504538 is associated with an increased risk of T2DM, because it causes an increase in insulin resistance.
Key words: Elongation of long-chain fatty acids family member 6; Single nucleotide polymorphism; Type 2 diabetes mellitus; Insulin resistance;b-cell function
Introduction
It is generally accepted that insulin resistance and
b-cell dysfunction are major factors involved in the development of type 2 diabetes mellitus (T2DM) (1). One of the genes involved is the elongation of long-chain fatty acids family member 6 (ELOVL6) gene, located on chromosome 4q25. It encodes a microsomal enzyme that catalyzes the elongation of saturated and monounsatu-rated fatty acids with 12, 14, and 16 carbons (2,3). Recent studies have indicated that overexpression of Elovl6
contributes to b-cell dysfunction (4). A deficiency in
Elovl6increases insulin sensitivity and decreases insulin resistance (5). These facts indicate the possible involve-ment ofElovl6in the development of T2DM.
Studies on the role ofElovl6have been performed in animal models (3,6) and in vitro (7). To date, only one European study has been carried out to explore the possible association between insulin resistance and the genetic variation ofELOVL6 in a human population (8).
There are no comparable data available on Asian populations and no study has demonstrated the relation-ship betweenELOVL6and islet function.
In this study, we analyzed three single nucleotide polymorphisms (SNPs), rs12504538, rs17041272, and rs6824447, to identify the relationship betweenELOVL6
and T2DM pathogenesis. We have previously found that rs12504538 is associated with gout (Miao ZM, Li CG, Han L, Wang YG, unpublished data), based on the outcome of microarray analyses. A series of studies (9-11) have suggested that elevated serum uric acid levels potentially increase the risk of T2DM. We investi-gated whether genes or loci that contribute to gout could also play a role in the pathogenesis of T2DM. An additional aim was to verify that, in a Chinese Han population, SNPs rs17041272 and rs6824447 are asso-ciated with T2DM, as reported in a previous European study (8).
Correspondence: Y.G. Wang, Department of Endocrinology, The Affiliated Hospital of Medical College, Qingdao University, No. 16 Jiangsu Road, Qingdao 266003, China. E-mail: [email protected]
*These authors contributed equally to this study.
Material and Methods
Study population
A total of 610 age-matched subjects (328 newly diagnosed T2DM patients and 282 healthy control individuals) were recruited from the Affiliated Hospital of the Medical College, Qingdao University (Shandong, China), from January 2009 to June 2012. All patients and controls were natives of the Shandong Province. Geographic matching of patients and controls to the Shandong Province was the best method of ensuring the same ancestral origin of the two groups. This can effectively eliminate the adverse impact of population stratification (12). The study protocol conformed to the ethics guidelines of the 1975 Declaration of Helsinki and was approved by the Ethics Committee of the Affiliated Hospital of Medical College, Qingdao University. Informed consent was obtained from all participants. The diagnosis and classification of T2DM was based on the criteria published by the American Diabetes Association in 2010 (13). Patients with other endocrine diseases and acute, severe diabetic complications were excluded. Healthy individuals, with no personal or familial history of T2DM or any other serious illness, were recruited for the control group.
Metabolic testing
Subjects underwent metabolic testing after an over-night fast (8-12 h). All participants had plasma levels of fasting blood glucose (FBG), total cholesterol (TC), and triglycerides (TG) measured using a Sysmex Chemix-180 automatic biochemistry analyzer (Sysmex Corporation of America, USA). An arginine stimulation test was also performed as described below.
A dose of 5 g arginine hydrochloride (Shanghai Biochemical Pharmaceutical Factory, China) was infused into subjects within 30-60 s. Blood samples were collected at -10, 2, 4, and 6 min from infusion. Serum insulin was
measured using a Roche Elecsys 2010 automatic electro-chemiluminescence immunoassay analyzer (Hoffmann-La Roche Ltd., Switzerland).
Laboratory methods
Blood samples were collected from the subjects and stored at -206C. Genomic DNA was extracted from peripheral blood leukocytes using a whole blood genome extraction kit (Beijing Tiangen Biotech Corporation, China).
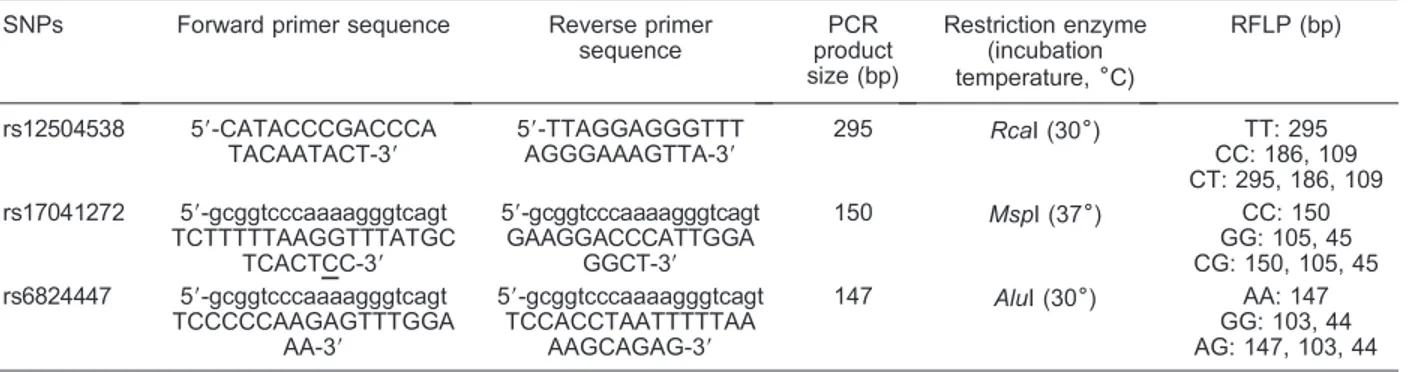
Information on the polymerase chain reaction (PCR) conditions for the selected SNPs is shown in Table 1. The reactions contained 0.5mL genomic DNA, 0.8mL dNTPs, 0.15mL of each primer, 1.5mL MgCl2, and 0.15mL Taq
DNA polymerase (5 U/mL), in a total reaction volume of 15mL. Amplification was performed using the following program: 956C for 5 min, 20 cycles of 956C for 30 s, 686C for 45 s, and 726C for 1 min, with the annealing temperature decreased by 0.56C/cycle. This was followed by 20 cycles of 956C for 30 s, 586C for 30 s, and 726C for 40 s, with a final single extension step of 726C for 6 min. The PCR products were digested with three different restriction enzymes (Fermentas Life Sciences, Lithuania):
RcaI (rs12504538), MspI (rs17041272), and AluI (rs6824447). The fragments were separated by electro-phoresis on a 3% ethidium bromide-stained agarose gel and visualized under ultraviolet illumination (Vilber Lourmat, France). In addition, all the samples were tested with DNA sequencing to confirm the genotype.
Calculations
We calculated the body mass index (BMI) values of the subjects to assess obesity. Insulin resistance was measured using a homeostasis model (HOMA-IR), as follows: HOMA-IR=FBG6fasting insulin (FIns)/22.5 (14).
Basic insulin secretion was calculated using b-cell function of homeostasis model assessment (HOMA-b), as follows: HOMA-b=206FIns/(FBG-3.5) (14). Early
Table 1. Information for the SNPs of theELOVL6gene studied here.
SNPs Forward primer sequence Reverse primer
sequence
PCR product size (bp)
Restriction enzyme (incubation temperature,6C)
RFLP (bp)
rs12504538 59-CATACCCGACCCA TACAATACT-39
59-TTAGGAGGGTTT AGGGAAAGTTA-39
295 RcaI (306) TT: 295
CC: 186, 109 CT: 295, 186, 109 rs17041272 59-gcggtcccaaaagggtcagt
TCTTTTTAAGGTTTATGC TCACTCC-39
59-gcggtcccaaaagggtcagt GAAGGACCCATTGGA
GGCT-39
150 MspI (376) CC: 150
GG: 105, 45 CG: 150, 105, 45 rs6824447 59-gcggtcccaaaagggtcagt
TCCCCCAAGAGTTTGGA AA-39
59-gcggtcccaaaagggtcagt TCCACCTAATTTTTAA
AAGCAGAG-39
147 AluI (306) AA: 147
GG: 103, 44 AG: 147, 103, 44
phase insulin secretion was assessed by acute insulin response to arginine (AIRarg) and was defined as the average of the three insulin values measured at 2, 4, and 6 min after, minus the value measured 10 min before, infusion with arginine hydrochloride (15).
Statistical analysis
The Statistical Package for Social Sciences (SPSS) version 17.0 was used for all the statistical analyses. The Student t-test was used to determine the statistical significance of differences between continuous variables. The chi-square test was used for analysis of the distribution of the allele and genotype frequencies, with the corresponding P values adjusted using the Bonferroni correction. Hardy-Weinberg equilibrium was calculated using the chi-square test to compare the observed genotype frequencies with the expected genotype fre-quencies. P values ,0.05 were considered to be significant.
Results
Participant characteristics
Table 2 shows the clinical characteristics of the T2DM patients (n=328) and control subjects (n=282). The T2DM group presented a higher mean TG, FBG and FIns levels, and HOMA-IR value (P,0.05), and lower AIRarg
than the control group. There was no significant difference between the two groups in the following variables: age, BMI, waist circumference, TC, and HOMA-b(P.0.05).
Distribution ofELOVL6genotypes and alleles in T2DM patients and controls
The distribution of genotypes at the rs12504538, rs17041272, and rs6824447 loci in both groups showed no significant difference from the Hardy-Weinberg equilibrium values (P.0.05 in T2DM and control groups).
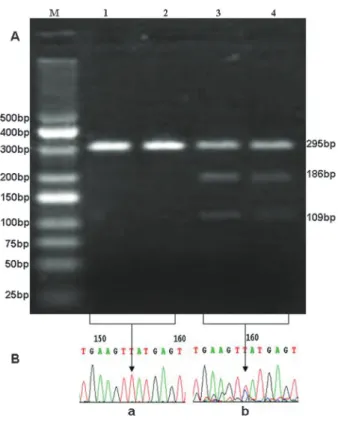
The possible genotypes at the rs12504538 locus were TT, CT, and CC (T is thymine, C is cytosine), but only TT and CT were detected in the samples (Figure 1). The T2DM group had higher frequencies of the C allele and CT genotype than the control group (23.8vs 14.9% and 11.9 vs 7.4%, respectively). The differences were significant (P,0.017, 0.05/3) after Bonferroni’s correction (Table 3). No statistical differences were observed in allele and genotype frequencies between the T2DM and control groups (Table 3) for SNPs rs17041272 (Figure 2) and rs6824447 (Figure 3).
Table 2. Demographic and clinical characteristics of the study population.
Parameter Control
(n=282)
T2DM (n=328)
P
Age (years) 50.6 ± 13.6 52.3 ± 10.9 0.197
BMI (kg/m2) 24.7 ± 5.3 25.7 ± 3.4 0.162
Waist circumference (cm)
85.9 ± 8.7 83.7 ± 23.5 0.329
TC (mM) 5.4 ± 0.9 5.1 ± 1.0 0.113
TG (mM) 1.3 ± 0.7 1.9 ± 1.2 ,0.001
FBG (mM) 5.6 ± 1.6 8.3 ± 2.7 ,0.001
FIns (mU/L) 11.9 ± 8.7 21.6 ± 43.7 0.010
Ins (2 min; mU/L) 74.7 ± 56.1 67.5 ± 51.3 0.323 Ins (4 min; mU/L) 63.4 ± 51.8 58.5 ± 47.1 0.467 Ins (6 min; mU/L) 48.1 ± 41.3 46.1 ± 46.6 0.740 AIRarg (mU/L) 50.0 ± 41.7 35.7 ± 30.3 0.003
HOMA-IR 3.1 ± 3.0 8.5 ± 18.8 0.001
HOMA-b 142.6 ± 118.5 192.2 ± 281.8 0.067
Data are reported as means±SD. BMI: body mass index; TC: total cholesterol; TG: triglycerides; FBG: fasting blood glucose; FIns: fasting insulin; Ins (2 min), Ins (4 min), and Ins (6 min): plasma insulin levels in response to bolus injections of arginine at 2, 4, and 6 min; AIRarg: acute insulin response to arginine; HOMA-IR: insulin resistance of homeostasis model assessment; HOMA-b: b-cell function of homeostasis model assessment; T2DM: type 2 diabetes mellitus. Statistical analysis was carried out with the Studentt-test.
Association between the rs12504538 polymorphism of theELOVL6gene and T2DM
The clinical characteristics of the enrolled subjects were subsequently compared with genotypes of the rs12504538 polymorphism (TTvsCT). Results (Table 4) showed that the CT genotype was significantly associated with higher TG (P=0.041), TC (P=0.034), FBG (P=0.043), FIns (P=0.046), and HOMA-IR (P=0.040).
Discussion
To our knowledge, this is the first report to indicate that rs12504538 is relevant to the prevalence of T2DM. Our results showed a significant increase in the frequency of the C allele and the CT genotype for the T2DM group compared with the control group.
Recent murine studies have shown the importance of
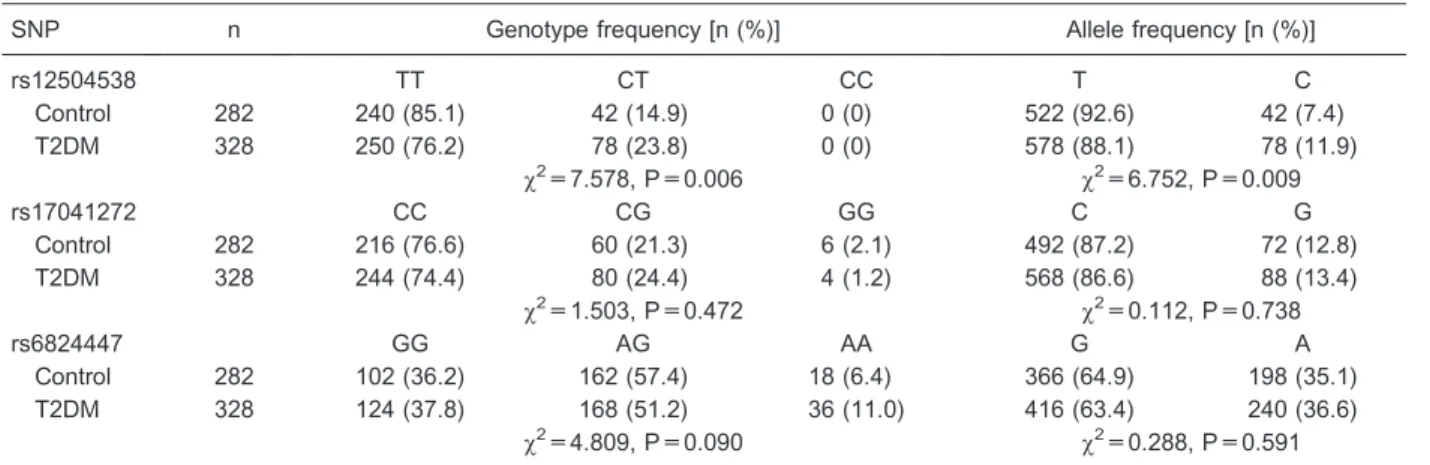
Table 3. Distribution of theELOVL6genotypes and alleles in T2DM patients and controls.
SNP n Genotype frequency [n (%)] Allele frequency [n (%)]
rs12504538 TT CT CC T C
Control 282 240 (85.1) 42 (14.9) 0 (0) 522 (92.6) 42 (7.4)
T2DM 328 250 (76.2) 78 (23.8) 0 (0) 578 (88.1) 78 (11.9)
x2=7.578, P=0.006 x2=6.752, P=0.009
rs17041272 CC CG GG C G
Control 282 216 (76.6) 60 (21.3) 6 (2.1) 492 (87.2) 72 (12.8)
T2DM 328 244 (74.4) 80 (24.4) 4 (1.2) 568 (86.6) 88 (13.4)
x2=1.503, P=0.472 x2=0.112, P=0.738
rs6824447 GG AG AA G A
Control 282 102 (36.2) 162 (57.4) 18 (6.4) 366 (64.9) 198 (35.1)
T2DM 328 124 (37.8) 168 (51.2) 36 (11.0) 416 (63.4) 240 (36.6)
x2=4.809, P=0.090 x2=0.288, P=0.591
P,0.017 (0.05/3) were significant after Bonferroni’s correction. T2DM: type 2 diabetes mellitus.
Figure 2. Genotypes of the ELOVL6 single nucleotide poly-morphism (SNP) rs17041272. A, Restriction fragment length polymorphism analyses for determination of the rs17041272 genotype (digested byMspI). The GC genotype shows 3 bands of 150, 105, and 45 bp (lanes 1and2), the GG genotype shows 2 bands of 105 and 45 bp (lanes 3and4), and the CC genotype shows a band of 150 bp (lanes 5 and 6). B, Nucleotide sequences surrounding the SNP rs17041272.a, GC genotype; b, GG genotype;c, CC genotype.Lane M: DNA marker.
Elovl6in energy metabolism and insulin sensitivity. Mice with a targeted deletion of Elovl6 do not develop diet-induced insulin resistance, despite being obese and showing hepatosteatosis. This is partially due to the restoration of hepatic insulin receptor substrate-2 and suppression of hepatic protein kinase Ce, which results in the restoration of Akt phosphorylation (6). ReducedElovl6
expression may play a protective role inb-cell function. Knockdown ofElovl6limits the elongation of palmitate to stearate, which instead allows palmitate to be desaturated to palmitoleate, a potentially less lipotoxic fatty acid. This results in the attenuation of palmitate-induced endoplasmic reticulum stress and apoptosis in pancreatic b-cells (4). Therefore, the Elovl6 gene is closely associated with insulin resistance andb-cell dysfunction.
In order to test the function of the ELOVL6gene in humans, we conducted this study in a Chinese Han population. We calculated insulin resistance using a homeostasis model and observed that the CT genotype of rs12504538 was associated with higher FBG, BMI, TG, TC, FIns, and HOMA-IR values than the TT genotype. This indicated that the CT genotype has the potential to
increase the risk of T2DM by increasing insulin resistance through an effect on fatty acid metabolism. However, no association was observed between the rs12504538 polymorphism and AIRarg. Therefore, the relationship between ELOVL6 and b-cell function needs further investigation.
No statistical significance was observed between the genotype and allele frequencies of the control and T2DM groups for the rs17041272 and rs6824447 SNPs. This is contradictory to the Spanish data reported by Morcillo et al. (8), in which carriers of the minor allele of rs17041272 had a higher risk of having a high HOMA-IR value. Carriers of the minor allele of rs6824447 had a lower risk of being insulin resistant. This led to the conclusion that these ELOVL6gene polymorphisms are related to insulin sensitivity. The differences between the two studies are partially due to racial genetic differences. It is well known that there are differences between races in genetic background and living environment. It may even be that the same gene locus plays a different role in different races. Thus, the racial differences observed in these gene polymorphisms indicate that
ELOVL6 could provide a potential target for future directed therapies for T2DM, using geographic region for patient stratification.
In our study there are several limitations that should be considered. First, the data for some of the phenotypic disease characteristics, such as the duration of T2DM history, hemoglobin A1c, low-density lipoprotein cholesterol, and high-density lipoprotein cholesterol, were not described in detail. Additional details of the patients’ clinical history will be needed. The sample size was relatively small and the study should be replicated in a much larger sample. Finally, to unravel the exact mechanism by which this chromosomal region is pathologically involved in T2DM, a more in-depth investigation of the locus, with functional experiments, is required.
Despite these limitations, this is the first study to test the hypothesis that ELOVL6 genetic variation is asso-ciated with insulin sensitivity and b-cell function in a Chinese Han population. We have revealed an associa-tion between SNP rs12504538 and T2DM and identified
ELOVL6as a novel candidate gene for T2DM therapy.
Acknowledgments
We thank the study participants for their important contribution: X.Y. Yuan helped to proofread the manu-script, and L. Wang contributed with the reagents.
References
1. Chiasson JL, Rabasa-Lhoret R. Prevention of type 2 diabetes: insulin resistance and beta-cell function. Diabetes 2004; 53 (Suppl 3): S34-S38, doi: 10.2337/ diabetes.53.suppl_3.S34.
2. Moon YA, Shah NA, Mohapatra S, Warrington JA, Horton JD. Identification of a mammalian long chain fatty acyl elongase regulated by sterol regulatory element-binding proteins. J Biol Chem 2001; 276: 45358-45366, doi:
Table 4. Clinical characteristics according to genotypes of the rs12504538 polymorphism of theELOVL6gene.
Parameter TT (n=250) CT (n=78)
Age (years) 50.8 ± 12.3 51.9 ± 11.8
BMI (kg/m2) 24.1 ± 3.2 25.7 ± 4.3*
Waist circumference (cm) 80.5 ± 19.0 84.4 ± 19.6*
TC (mM) 5.1 ± 0.9 5.4 ± 1.0*
TG (mM) 1.4 ± 0.8 1.8 ± 1.2*
FBG (mM) 6.8 ± 1.6 7.9 ± 2.7*
FIns (mU/L) 13.7 ± 13.1 32.2 ± 67.4*
Ins (2 min; mU/L) 66.6 ± 51.3 81.5 ± 57.6
Ins (4 min; mU/L) 57.9 ± 47.2 68.0 ± 53.4
Ins (6 min; mU/L) 43.4 ± 39.3 57.6 ± 58.1*
AIRarg (mU/L) 42.2 ± 36.3 36.2 ± 32.0
HOMA-IR 4.5 ± 6.0 12.6 ± 28.3*
HOMA-b 164.5 ± 229.9 200.8 ± 245.5
10.1074/jbc.M108413200.
3. Matsuzaka T, Shimano H, Yahagi N, Yoshikawa T, Amemiya-Kudo M, Hasty AH, et al. Cloning and character-ization of a mammalian fatty acyl-CoA elongase as a lipogenic enzyme regulated by SREBPs.J Lipid Res2002; 43: 911-920.
4. Green CD, Olson LK. Modulation of palmitate-induced endoplasmic reticulum stress and apoptosis in pancreatic beta-cells by stearoyl-CoA desaturase and Elovl6. Am J Physiol Endocrinol Metab 2011; 300: E640-E649, doi: 10.1152/ajpendo.00544.2010.
5. Matsuzaka T, Shimano H. Elovl6: a new player in fatty acid metabolism and insulin sensitivity.J Mol Med2009; 87: 379-384, doi: 10.1007/s00109-009-0449-0.
6. Matsuzaka T, Shimano H, Yahagi N, Kato T, Atsumi A, Yamamoto T, et al. Crucial role of a long-chain fatty acid elongase,Elovl6, in obesity-induced insulin resistance.Nat Med2007; 13: 1193-1202, doi: 10.1038/nm1662.
7. Shimamura K, Nagumo A, Miyamoto Y, Kitazawa H, Kanesaka M, Yoshimoto R, et al. Discovery and characteriza-tion of a novel potent, selective and orally active inhibitor for mammalianELOVL6.Eur J Pharmacol2010; 630: 34-41, doi: 10.1016/j.ejphar.2009.12.033.
8. Morcillo S, Martin-Nunez GM, Rojo-Martinez G, Almaraz MC, Garcia-Escobar E, Mansego ML, et al.ELOVL6genetic variation is related to insulin sensitivity: a new candidate
gene in energy metabolism.PLoS One 2011; 6: e21198, doi: 10.1371/journal.pone.0021198.
9. Li C, Hsieh MC, Chang SJ. Metabolic syndrome, diabetes, and hyperuricemia.Curr Opin Rheumatol2013; 25: 210-216, doi: 10.1097/BOR.0b013e32835d951e.
10. Krishnan E, Pandya BJ, Chung L, Hariri A, Dabbous O. Hyperuricemia in young adults and risk of insulin resistance, prediabetes, and diabetes: a 15-year follow-up study.Am J Epidemiol2012; 176: 108-116, doi: 10.1093/aje/kws002. 11. Zhu Y, Pandya BJ, Choi HK. Comorbidities of gout and
hyperuricemia in the US general population: NHANES 2007-2008.Am J Med2012; 125: 679-687, doi: 10.1016/ j.amjmed.2011.09.033.
12. Chen J, Zheng H, Bei JX, Sun L, Jia WH, Li T, et al. Genetic structure of the Han Chinese population revealed by genome-wide SNP variation.Am J Hum Genet 2009; 85: 775-785, doi: 10.1016/j.ajhg.2009.10.016.
13. American Diabetes Association. Standards of medical care in diabetes - 2010.Diabetes Care2010; 33 (Suppl 1): S11-S61.
14. Levy JC, Matthews DR, Hermans MP. Correct homeostasis model assessment (HOMA) evaluation uses the computer program.Diabetes Care1998; 21: 2191-2192, doi: 10.2337/ diacare.21.12.2191.