BAR, Curitiba, v. 5, n. 2, art. 5, p. 160-176,
Apr./June 2008
Financial Disclosure and International Capital Mobility in
Financial Disclosure and International Capital Mobility in
Financial Disclosure and International Capital Mobility in
Financial Disclosure and International Capital Mobility in
Latin America
Latin America
Latin America
Latin America
Otavio R. de Medeiros *
E-mail address: [email protected] Universidade de Brasília – UnB Brasília, DF, Brazil.
Luis Gustavo do Lago Quinteiro
E-mail address: [email protected] Tribunal Superior Eleitoral
Brasília, DF, Brazil.
A
A
A
A
BSTRACTBSTRACTBSTRACTBSTRACTThe extant literature provides evidence on the impact of financial disclosure environments on international capital mobility. However, to our knowledge, there are no such studies including Latin-American countries. We aimed to fill this void by assessing the influence of accounting information on international capital mobility in a twenty-two-country sample, including the three largest Latin-American countries: Argentina, Brazil and Mexico. The countries included in the sample represent around 80% of the world’s GDP from 1995 to 2001. Our empirical results show with a 99% confidence level that the degree of disclosure of value-relevant accounting information has positively influenced international capital mobility. We also show, with a 95% confidence level, that countries where financial accounting is less aligned with tax accounting present higher international capital mobility. The three Latin-American countries studied present relatively low levels of disclosure among the sampled countries. However, whereas Argentina and Brazil show low levels of capital mobility, Mexico stands out with a high capital mobility, which we reckon could be accounted for by the country’s trade and investment connections with the US and by its participation in the NAFTA.
Key words: international capital mobility; financial accounting disclosure; international CAPM; direct foreign investment.
Received 19 May 2007; received in revised form 08 May 2008.
Copyright © 2008 Brazilian Administration Review. All rights reserved, including rights for
translation. Parts of this work may be quoted without prior knowledge on the condition that
the source is identified.
* Corresponding author: Otavio R. de Medeiros
IIII
NTRODUCTIONNTRODUCTIONNTRODUCTIONNTRODUCTIONSince the 1960s, several empirical studies on the effects of the disclosure of accounting information on capital markets have been produced. A recent work assessed the influence of accounting information on international capital mobility in a study involving 23 countries (Young & Guenther, 2003). This work concludes that countries whose legislation enforces higher levels of disclosure of accounting information and where financial accounting is not influenced by tax accounting present higher international capital mobility. The evidence indicates that a higher level of relevance of the accounting information produced in a country contributes towards reducing the information asymmetry on the markets, thus lowering the risk of foreign investors making wrong decisions when trading with better informed domestic investors and, consequently, increasing the flow of resources of international investors to the local capital market.
Taking into account several studies showing the existence of economic phenomena caused by accounting information, our study can be considered relevant for including Latin America [LA] in a comparative analysis with a representative sample of developed and developing countries. Currently, Brazil is well situated on the route of foreign investments, together with Russia, India and China (the BRICs), which are the four emerging markets receiving the highest attention at the moment, due to their development potential and, consequently, higher profitability for foreign capital. Moreover, this study becomes especially relevant for connecting different areas of contemporary knowledge (administration, finance, accounting, and economics), for revealing the degree of development of LA’s accounting standards, as well as for providing guidelines for decision making, both at the corporate and the regulatory levels, since it becomes clear that the disclosure of the countries’ accounting information affects the perception of risk and, consequently, the decision making of international investors.
Accordingly, we test the following hypotheses:
. Ha – the degree of disclosure of relevant accounting information positively affects international capital mobility across countries.
. Hb – conformity of financial and tax accounting norms negatively affects international capital mobility across countries.
Our sample includes twenty-two countries: South Africa, Germany, Argentina, Australia, Belgium, Brazil, Canada, Denmark, Spain, the United States, Finland, France, Netherlands, Ireland, Italy, Japan, Mexico, Norway, New Zealand, the United Kingdom, Sweden and Switzerland. The sample period extends from 1995 to 2001. The paper contains five sections: introduction, literature review, research methodology, analysis of results, and conclusions.
L
L
L
L
ITERATURE ITERATURE ITERATURE ITERATURER
R
R
R
EVIEWEVIEWEVIEWEVIEWThe literature points out various factors that might constitute barriers to international capital mobility and stresses transactions cost across frontiers as a likely barrier. These costs include taxes, restrictions or caveats to the access to markets, as well as informational disadvantages. Such factors would induce concentration in domestic portfolios since the net return on assets is higher for domestic than for foreign investors (Cooper & Kaplanis, 1994). With respect to informational disadvantage, it is more expensive for foreign than domestic investors to obtain relevant information on the domestic markets. Thus, foreign investors tend to become less informed and to take higher risks of making wrong decisions (Harris & Havenscraft, 1991; Shukla & Inwegem, 1995). It has been argued that when foreign investors are less informed than domestic ones, there is less activity related to foreign investments in market equilibrium situations, which means that there is a reduction in the flow of international capital (Gehrig, 1993; Gordon & Bovenberg, 1996).
On the other hand, the prior commitment of firms in publishing their information would deter the acquisition of private information based on the principle that public information is a substitute for private information (Diamond, 1985; Lundholm, 1991; Verrecchia, 1982). It has also been argued that the adoption of policies that determine higher transparency of financial information would favor the interests of less informed investors vis-à-vis better informed ones, reducing the informational disadvantage of the former and bringing a better equilibrium to the risk-return tradeoff associated with their investment decisions (Lev, 1988). Hence, one should expect a positive relationship between the degree of relevance of accounting information and capital mobility between countries (Young & Guenther, 2003).
The existence of a positive relationship between the disclosure of accounting information and international capital mobility has been empirically shown in a recent study using a sample of 23 countries (Young & Guenther, 2003). The levels of compulsory disclosure and the conformity of financial and tax accounting rules across countries were collected and tested against factors of international capital mobility. It was found that countries with a higher degree of disclosure present higher international capital mobility and that countries where financial accounting is not aligned with tax accounting also show higher capital mobility than those where this alignment is strong. Moreover, the conformity of financial and tax accounting rules is more significant than the level of disclosure itself (Young & Guenther, 2003).
A recent study by Durnev and Kim (2007), involving 859 companies across 27 countries in Asia, Latin America, and Eastern Europe found that three corporate characteristics — investment opportunities, capital requirements, and ownership concentration — seem to make firms implement governance and disclosure rules exceeding those established by the local countries’ laws and regulations. In addition, they show that: (a) this phenomenon seems to be more intense in countries with low investor protection; (b) that firms with better governance and disclosure levels are better valuated; and (c) that this governance valuation effect is higher in countries where weaker legal systems prevail. Durnev and Kim (2007) conclude that firms that create reputations for high level governance and transparency are rewarded by investors with higher valuations. Based on that, they argue that policy makers should trust that market behavior will make firms with large funding requirements will improve their governance in order to attract new potential shareholders, and that firms with narrow investment opportunities, little need for external financing, and controlling shareholders with voting control unbalanced with their claims on cash flow are the ones to be concerned with, since these have no incentive to improve governance. The authors believe that their results bring good news to firms, investors, and policymakers in emerging economies with low institutional protection for minority shareholders. They also associate their results with the debate between economic development supporters and income redistribution supporters. They argue that as long as economic development policies foster new investment opportunities, firms depending on financing will be willing to improve their governance practices, while redistribution-oriented policies that tend to decrease property rights and reduce incentives investment and raise capital will make the policy makers’ mission much more difficult.
Standards Board gets extensive support for its efforts to harmonize international accounting standards. However, at least on empirical grounds, the adoption of International Accounting Standards [IASs] is a controversial issue particularly in the context of developing countries. For instance, Larson and Kenny (1995) report the results of an exploratory study examining the relationships between the adoption of International Accounting Standards [IASs], equity market development and economic growth in developing countries with equity markets. They analyzed 27 developing countries by means of a cross-country research design and found no major association between developing countries’ equity market development and economic growth owing to the adoption of IASs. Partial least squares analysis [PLS] was used to test the hypothesized relationships, since PLS analysis is suitable for small samples and studies where the theoretical background is not fully developed. Their PLS regressions are statistically significant, with an R2 of 0.50 for equity market development and 0.58 for economic growth. However, although the coefficients associated to IAS adoption are statistically significant, they are relatively small and, moreover, present wrong signs with respect to expectations. The overall results indicate that countries in the sample that had adopted IASs had lower equity market development and lower economic growth than countries that had not adopted IASs, which is a rather disappointing upshot. The authors acknowledge that their study suffers from several limitations, such as small sample size, time frame and other problems, which might have contributed to produce poor results.
Aware of the importance of the introduction of international accounting standards into the Brazilian market, and bearing in mind the significant changes that took place in recent years in the world economic scenario, notably those conveyed by the fast globalization process, the Central Bank of Brazil issued on 06.10.2006 Communiqué No. 14259, which informs that 10.31.2010 is the starting date for the implementation of procedures leading to the convergence of accounting norms applicable to the financial institutions and to other institutions chartered by the Central Bank for the international standards issued by the International Accounting Standards Board [IASB] and by the International Federation of Accountants [IFAC], starting on 10.31.2010.
Similarly, the Security Exchange Commission of Brazil issued on 07.13.2007 Instruction CVM no. 457, establishing that Brazilian publicly listed companies must present their consolidated financial statements according the international accounting standards, according to statements issued by IASB, starting in the fiscal year ending in 2010. The referred norm emphasizes that Brazilian accounting practices must converge towards the international accounting practices, aiming at assigning greater transparency and trustworthiness to Brazilian financial information, as well as providing access to international sources of financing at lower costs, especially when taking into account that several markets and regulators of foreign countries and international blocks have been continuously striving to develop means to restrain access to their markets by countries that have not adopted or have not shown any intention to adopt international accounting standards.
It should be stressed that the Financial Accounting Standards Board [FASB] and IASB issued on 06.27.2006 a memorandum of understanding reporting the evolution of the conversations begun in 2002 concerning the convergence between the international accounting norms [IFRS], edited by IASB and the US accounting principles [USGAAP], issued by FASB, which draws a convergence roadmap that makes reconciliation between the IFRS and the US norms unnecessary from 2009 onwards.
These efforts show that, in general, the convergence between domestic and international accounting norms is virtually irreversible and that Brazil has been an active participant in this process.
R
R
R
R
ESEARCH ESEARCH ESEARCH ESEARCHD
D
D
D
ESIGNESIGNESIGNESIGNOur study involved a sample of 22 countries, including three in Latin-America (Argentina, Brazil and Mexico) and 19 non Latin-American countries (South Africa, Germany, Australia, Belgium, Canada, Denmark, Spain, the United States, Finland, France, Netherlands, Ireland, Italy, Japan, Norway, New Zealand, the United Kingdom, Sweden, and Switzerland). It should be mentioned that by the end of 2001, the 22 countries sampled were responsible for 82.5% of the World’s GNP, whereas the Latin-American countries included held 72.8% of the GNP of Latin America and the Caribbean (The World Bank, 2005). The sample period extends from 1995 through 2001.
Measures of international capital mobility and of accounting information relevance and control variables were computed for each of the 22 sampled countries, according to methodology developed in previous work (Young & Guenther, 2003). To capture the relevance of accounting information, two measures were calculated for each country. The first one is an index of accounting information disclosure, which consists of a ranking built from relevant disclosure items for foreign investment decisions. The second refers to the conformity of financial and tax accounting rules. In its turn, the measure of international capital mobility was obtained from three distinct measures: consumption-based mobility, CAPM-consumption-based mobility, and direct foreign investment consumption-based mobility [DFI]. Based on these three measures, a single measure was built for each country (CAPMO) by means of factor analysis. This single measure was then used as proxy for the degree of international capital mobility for each country.
The control variables used are: exchange rate variability [ERV], risk adjusted stock market return [RET], type of law system (Civil Law or Common Law) [LEGAL], number of listed firms per capita [LIST] and shareholder protection index [PROT]. The two main explanatory variables are the ranking of disclosure of accounting information [DISC] and the index of conformity of financial and tax accounting [FT]. To assess the relationship between the variables, we utilized time-series and cross-section linear regressions in addition to the factor analysis. Among the capital mobility measures, those based on consumption and on international CAPM are estimated in time-series dimension, while the measure based on direct foreign investment is obtained by means of correlation analysis. The measure of accounting disclosure, i.e. the degree of development of the countries’ accounting standards, are based on the methodology described in this Section and, together with up to five control variables, they are tested separately as factors explaining capital mobility. Considering that the majority of the explanatory variables are static, this methodology, adopted by Young and Guenther (2003), becomes more appropriate. In order to check for the robustness of results, we carried out diagnostic tests: unit root, serial correlation, heteroscedasticity and normality tests. The unit root tests are necessary to check the data for non-stationarity, which could entail spurious regressions. The serial correlation, heteroscedasticity and normality tests on the residuals are necessary to test the distributional properties of the residuals, which are required to validate the significance tests. For these, we used the Durbin-Watson, the White, and the Bera-Jarque tests, respectively. The significance of the regression coefficients was assessed by Student’s t and Fisher’s F tests.
To attest the adequacy of the factor analysis, we used two basic tests: Bartlett’s test for sphericity and the Kaiser-Meyer-Olkin [KMO] test. An essential requirement for performing an adequate factor analysis is the existence of significant correlation between the variables. If a visual inspection of the variable involved does not identify the predominance of correlation coefficients equal to or higher than 0.3, a factor analysis might not be suitable (Hair, Anderson, Tatham, & Black, 1998). Bartlett’s test of sphericity aims at assessing the general significance of the cross correlations, by testing the null that the variables within the population are not correlated.
We test the relationship between the degree of disclosure of accounting information and international capital mobility by specifying equation (1):
0 1 1
...
j j j j j j nj nj j
where CAPMOj is the capital mobility factor of the j-th country, DISCj is the measure of disclosure of relevant accounting information of the j-th country, VCij are control variables for the j-th country, and
ujis assumed to be the j-th regression’s IID ~ (, 2
) error term.
We test the impact of the conformity of financial and tax accounting rules and international capital mobility by specifying equation (2):
0 1 1
...
j j j j j j nj nj j
CAPMO
FT
VC
VC
v
(2)where FTj is a measure indicating the alignment of financial and tax accounting of the j-th country, and vjt is assumed to be the j-th regression’s IID ~ (,
2
) error term.
Several studies argue that consumption patterns could be utilized as a measure of international capital mobility (Backus, Kehoe, & Kydland, 1994; Baxter & Crucini, 1993; Mace, 1991). If capital can circulate freely among countries, then consumption across countries should be highly correlated to the world’s aggregate consumption, making a country’s consumption to be vulnerable to global shocks. On the other hand, if there are barriers to the capital flow among countries, the degree of risk sharing should be lower. The estimation of the degree of international capital mobility across countries is made based on the relationship of the country’s consumption and the rest of the world’s consumption, controlled for the country’s GDP:
1 2
log
C
jtlog
C
wtlog
GDP
jt it
(3)
where Cjt is the real per capita private aggregate consumption of the j-th country in year t; Cwtis the real per capita private aggregate consumption of all countries except country j in year t; GDPjt is the
per capita GDP of the j-th country in year t; log is the natural log operator; is the 1st difference operator; the s and s are coefficients; and it is an IID ~ (, 2) white noise disturbance. We use the
sum of the consumption of the 22 sampled countries as a proxy for the world’s consumption. We employ annual data from 1995 to 2001 to estimate equation (3). If capital is freely mobile across countries, we expect 1 to be close to 1. In order to control for the variance across countries, we used the standardized estimate of 1 as a measure of international capital mobility for each country. The standardized estimate is computed by dividing 1 by the standard deviation of the 1s of the 22 countries. The data for consumption and GDP of all countries were collected from The World Bank’s World Development Indicators, expressed in constant 1995 USD.
The measure of capital mobility based on the international CAPM was utilized in previous studies (Korajczyk & Viallet, 1989; Levine & Zervos, 1998; Young & Guenther, 2003). In a situation of perfect capital mobility, capital moves internationally with the purpose of equalizing the risk premium. The CAPM is based on the assumption that the return of an asset is a linear function of a benchmark portfolio or groups of benchmark portfolios. If the CAPM principle holds, the intercept ( j) in
equation (4) must be equal to zero:
R
jt j jR
mt jt(4)
where Rjtis the excess return on the j-th asset in the period t with respect to the return of a risk-free asset, Rmt is the excess of the benchmark portfolio m in period t (Rf) and jt is an IID ~ (, 2) error term. Both excess returns are the differences between normal returns and the return on a riskless asset.
normal asset and market returns are computed in the continuous compounded form, by using the log operator, i.e. log (xt) = log(xt) – log(xt-1):
log
jt jt
R
P
(5)where Pjt is the j-th asset price in period t; and
log
mt jt
R
MC
(6)
where MCjt is the market capitalization of the j-th asset in period t.
The return on short-term US Treasury Bills is the proxy for the riskless return rate. We used the median of the absolute value of the j’s of each country’s assets as a proxy for international capital mobility. To compute the measure of mobility based on the International CAPM, we collected stock prices and market caps of all firms based on the sampled countries available in the Compustat Global Vantage® on 08.10.2004. Only assets having at least 50 monthly returns within the period from 1995 to 2001 were included in the sample. The source of data on the monthly returns of the US Treasury Bills is the International Financial Statistics [IFS], published by International Monetary Fund [IMF]. The measure of mobility based on foreign direct investment is the Pearson’s correlation coefficient between the volume of foreign direct investment made by non-residents and the Gross Fixed Capital Formation, the latter being a proxy for investment opportunities. The central rationale for this measure is that if capital is freely mobile across countries, foreign investments should be strongly correlated with the countries’ investment opportunities. The data on Gross Fixed Capital Formation and Foreign Direct Investment were obtained from The World Bank’s World Development Indicators [WDI].
By using the methods described above, we end up with three measures of capital mobility (consumption-based, CAPM-based and DFI-based). Therefore, we need a consistent method capable of extracting the relevant information from these measures and transforming them into one single measure: factor analysis. This means that the three measures are transformed into one factor only, which is then used as a proxy for international capital mobility in the multivariate analysis in order to assess its relationship with the measures of relevance of accounting information.
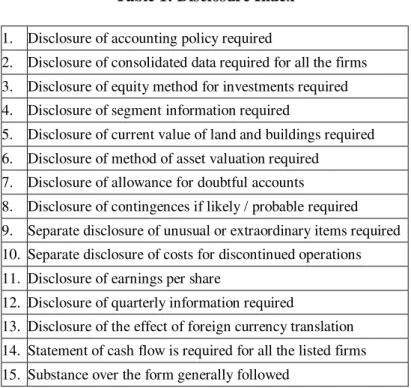
Table 1: Disclosure Index
1. Disclosure of accounting policy required
2. Disclosure of consolidated data required for all the firms
3. Disclosure of equity method for investments required
4. Disclosure of segment information required
5. Disclosure of current value of land and buildings required
6. Disclosure of method of asset valuation required
7. Disclosure of allowance for doubtful accounts
8. Disclosure of contingences if likely / probable required
9. Separate disclosure of unusual or extraordinary items required
10. Separate disclosure of costs for discontinued operations
11. Disclosure of earnings per share
12. Disclosure of quarterly information required
13. Disclosure of the effect of foreign currency translation
14. Statement of cash flow is required for all the listed firms
15. Substance over the form generally followed
Each item was set to 1 if the country’s accounting standards impose its disclosure and to zero, otherwise. For each country, the total sum of the 15 items was used as a proxy for relevance of accounting information. Country surveys on accounting disclosure are available for 1993 and 2001. For 1993, we utilized the information published by Coopers and Lybrand’s (1993) International Accounting Summaries. The 2001 index assessment was made based on the same criteria described above, but using as a source the report entitled GAAP (Andersen et al., 2001) – A Survey of National Accounting Rules Benchmarked against International Account Standards. The results of the 1993 and the 2001 assessments were tested separately as explanatory variables of international capital mobility. In a third test we used an index calculated as the average between the 1993 and the 2001 indexes. The variables resulting from these assessments are denominated DISC_93, DISC_01 and DISC_M.
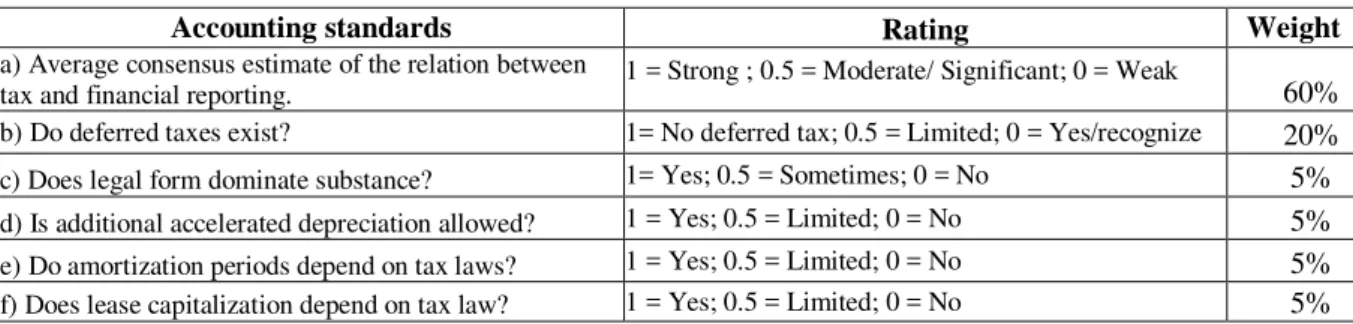
Another measure of relevance of accounting information, which is also based on previous literature, is a binary variable indicating the country’s level of conformity between financial accounting and tax accounting regulations (Ali & Hwang, 2000; Hung, 2001; Young & Guenther, 2003). It has been argued that tax accounting regulations are affected by political, social, economic and income distribution requirements and often utilized as a policy instrument to promote or to disincentive certain economic activities. Hence, the alignment of financial and tax accounting probably weakens the relevance of published accounting information (Ali & Hwang, 2000). The criteria used to compute this measure, as shown in Table 2, is based on 6 items. Each item allows three alternative scores, according to the degree of conformity between financial and tax accounting. Each option has a certain weight on the item’s score, which has in turn a certain weight on the global classification (Hung, 2001). The items are then assessed for each country. When the sum of scores, weighted by their respective weights, is equal to zero, the country’s indicator is set to 1 and when it is greater than zero, the country’s indicator is set to zero. Attributing zero to a country means that the country’s financial accounting is aligned with tax accounting, whereas attributing 1 indicates the opposite. We expect this variable to be positively related to international capital mobility.
Table 2: Financial Tax Alignment
Accounting standards Rating Weight
a) Average consensus estimate of the relation between
tax and financial reporting. 1 = Strong ; 0.5 = Moderate/ Significant; 0 = Weak 60%
b) Do deferred taxes exist? 1= No deferred tax; 0.5 = Limited; 0 = Yes/recognize 20%
c) Does legal form dominate substance? 1= Yes; 0.5 = Sometimes; 0 = No 5%
d) Is additional accelerated depreciation allowed? 1 = Yes; 0.5 = Limited; 0 = No 5%
e) Do amortization periods depend on tax laws? 1 = Yes; 0.5 = Limited; 0 = No 5%
f) Does lease capitalization depend on tax law? 1 = Yes; 0.5 = Limited; 0 = No 5%
Exchange rate variability captures changes between domestic and foreign interest rates. High exchange rate variability is probably associated with high risk to investors, both with respect to capital inflows and outflows, which hampers capital mobility. Hence, we expect a negative correlation between exchange rate variability and international capital mobility across countries. The proxy for the exchange rate is the IMF’s SDR rate, which compares a country’s currency to the Special Drawing Rights [SDRs]. SDRs are fiduciary reserve assets created by the IMF in 1970 as a supplement to existing reserve assets. The value of one SDR is determined by the weighted average of a basket of the currencies of the five countries with the largest share of world exports of goods and services - the US dollar, the Japanese yen, the British pound, and the Euro (representing France and Germany). The data source for these is the IMF’s International Financial Statistics. Exchange rate variability is calculated as the standard deviation of the exchange rate divided by its mean using monthly data from 1995 to 2001.
The risk-adjusted market return captures the performance of the country’s stock market and hence its investment opportunities (Ahearne, Griever, & Warnock, 2004). Higher risk-adjusted market returns will probably attract larger foreign investments, which can foster international capital mobility. Therefore, we expect a positive relationship between the risk-adjusted market return and international capital mobility across countries. The risk-adjusted market return, denominated RET, is calculated according to previous literature as the mean of the risk-adjusted monthly market return normalized by its standard deviation based on data from 1995 to 2001. The monthly stock market returns for each country were collected from the IMF’s International Financial Statistics, except for Belgium, Canada, Denmark and Norway, since the data of these countries were not available from this source. For these countries, we computed the returns based on assets available in the Compustat Global Vantage® which were traded at least in 50 of the 84 months from 1995 to 2001.
The number of domestic firms listed on stock markets per capita (LIST) indicates a country’s level of economic development and the size of its stock market (Young & Guenther, 2003). Since both developed economies and large capital markets tend to attract higher investment volumes, we expect a positive relationship between this variable and the measure of international capital mobility. The variable is computed as the average number of publicly listed firms divided by the country’s total population based on annual data from 1995 to 2001 taken from The World Bank’s World Development Indicators [WDI].
With respect to shareholder protection, previous studies have found that regulations established with this purpose, especially with regard to minority shareholders, are essential for the development of larger and more liquid capital markets (La Porta et al., 1997). Foreign investors are generally minority shareholders and hence bear more risk of being expropriated by managers or controlling shareholders (Young & Guenther, 2003). A legal system protecting minority shareholders’ interests can reduce the risk they bear and increase their confidence and inclination to invest in a foreign country. As a proxy for shareholder protection, we used an indicator developed in previous work, which establishes five levels of protection of shareholders’ rights, where zero indicates the lowest and five the highest protection level (La Porta et al., 1997). We expect a positive relationship between this variable, denominated PROT, and international capital mobility.
A
A
A
A
NALYSIS OF NALYSIS OF NALYSIS OF NALYSIS OFR
R
R
R
ESULTSESULTSESULTSESULTSSince most economic time series are non-stationary, we started by carrying out unit-root tests on the data series prior to performing the regression analyses associated with the consumption-based measure. The Augmented Dickey-Fuller [ADF] - test detected unit roots in most variables, which required differentiation in order to obtain stationarity. Accordingly, equation (3) was differenced once prior to estimation. Among the 22 consumption regressions performed, one for each country, the 1
coefficients estimated for 17 regressions were found to be significant at the 5% level and 5 at the 10% level. According to the estimated 1s, the countries with the highest capital mobility are Mexico,
Ireland and Sweden, whereas those with the lowest capital mobility are Brazil, Denmark and Germany, as depicted in the 2nd column of Table 3. Stock price and market capitalization data of firms established in the sampled countries, as well as interest rates on US Treasury Bills and Brazil’s country risk, are necessary to compute the measure based on the international CAPM. In order to get stock prices and market caps, we initially collected all assets available on Compustat® for all countries, which totaled 19.030 assets. From this base, we selected assets traded at least in 50 of the 84 months from 1995 to 2001, totaling 9.965 assets. The benchmark portfolio’s market cap was obtained by summing up the market caps of these assets. We then performed the 9,327 regressions, 4,676 of which were considered valid after carrying out ADF unit root, Durbin-Watson’s autocorrelation, Student’s t, Bera-Jarque’s normality, and White’s heteroscedasticity tests.
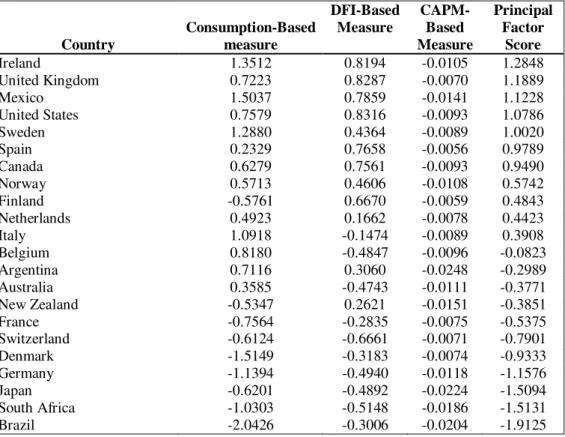
The measure of capital mobility based on Direct Foreign Investment [DFI] is proxied by the Pearson correlation coefficient between DFI and the Gross Fixed Capital Formation. Results for this variable are shown in the 3rd column of Table 3. According to this measure, the countries with the highest international capital mobility are the US, the UK and Ireland, whereas the countries with the lowest international capital mobility are Switzerland, South Africa and Germany. After computing the measures of international capital mobility we performed a factor analysis in order to extract the principal component. The results for the three measures, together with the principal component obtained from the factor analysis are depicted on Table 3.
measure, we found that the countries with the highest international capital mobility are Spain, Finland and the UK, whereas the countries with the lowest capital mobility are Argentina, Brazil, and Japan.
Table 3: Measures of International Capital Mobility and Principal Component
Country
Consumption-Based measure
DFI-Based Measure
CAPM-Based Measure
Principal Factor
Score
Ireland 1.3512 0.8194 -0.0105 1.2848
United Kingdom 0.7223 0.8287 -0.0070 1.1889
Mexico 1.5037 0.7859 -0.0141 1.1228
United States 0.7579 0.8316 -0.0093 1.0786
Sweden 1.2880 0.4364 -0.0089 1.0020
Spain 0.2329 0.7658 -0.0056 0.9789
Canada 0.6279 0.7561 -0.0093 0.9490
Norway 0.5713 0.4606 -0.0108 0.5742
Finland -0.5761 0.6670 -0.0059 0.4843
Netherlands 0.4923 0.1662 -0.0078 0.4423
Italy 1.0918 -0.1474 -0.0089 0.3908
Belgium 0.8180 -0.4847 -0.0096 -0.0823
Argentina 0.7116 0.3060 -0.0248 -0.2989
Australia 0.3585 -0.4743 -0.0111 -0.3771
New Zealand -0.5347 0.2621 -0.0151 -0.3851
France -0.7564 -0.2835 -0.0075 -0.5375
Switzerland -0.6124 -0.6661 -0.0071 -0.7901
Denmark -1.5149 -0.3183 -0.0074 -0.9333
Germany -1.1394 -0.4940 -0.0118 -1.1576
Japan -0.6201 -0.4892 -0.0224 -1.5094
South Africa -1.0303 -0.5148 -0.0186 -1.5131
Brazil -2.0426 -0.3006 -0.0204 -1.9125
Source: prepared by the authors.
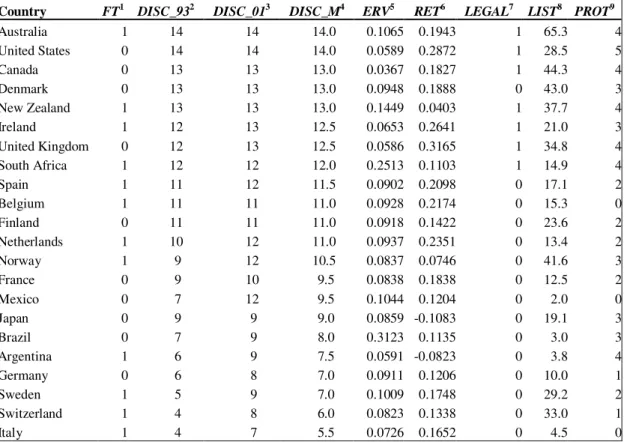
The degree of Disclosure of Relevant Accounting Information is based on a list of 15 disclosure items where it is verified, for each country, whether local regulations impose their disclosure (compulsory disclosure). An item is set to 1 when it is mandatory and to zero otherwise. The 1993, the 2001 and the average 1993/2001 indexes are shown in the 3rd, 4th, and 5th columns of Table 4.
Table 4: Accounting Information Relevance and Control Variables
Country FT1 DISC_932 DISC_013 DISC_M4 ERV5 RET6 LEGAL7 LIST8 PROT9
Australia 1 14 14 14.0 0.1065 0.1943 1 65.3 4 United States 0 14 14 14.0 0.0589 0.2872 1 28.5 5 Canada 0 13 13 13.0 0.0367 0.1827 1 44.3 4 Denmark 0 13 13 13.0 0.0948 0.1888 0 43.0 3 New Zealand 1 13 13 13.0 0.1449 0.0403 1 37.7 4 Ireland 1 12 13 12.5 0.0653 0.2641 1 21.0 3 United Kingdom 0 12 13 12.5 0.0586 0.3165 1 34.8 4 South Africa 1 12 12 12.0 0.2513 0.1103 1 14.9 4 Spain 1 11 12 11.5 0.0902 0.2098 0 17.1 2 Belgium 1 11 11 11.0 0.0928 0.2174 0 15.3 0 Finland 0 11 11 11.0 0.0918 0.1422 0 23.6 2 Netherlands 1 10 12 11.0 0.0937 0.2351 0 13.4 2 Norway 1 9 12 10.5 0.0837 0.0746 0 41.6 3 France 0 9 10 9.5 0.0838 0.1838 0 12.5 2 Mexico 0 7 12 9.5 0.1044 0.1204 0 2.0 0 Japan 0 9 9 9.0 0.0859 -0.1083 0 19.1 3 Brazil 0 7 9 8.0 0.3123 0.1135 0 3.0 3 Argentina 1 6 9 7.5 0.0591 -0.0823 0 3.8 4 Germany 0 6 8 7.0 0.0911 0.1206 0 10.0 1 Sweden 1 5 9 7.0 0.1009 0.1748 0 29.2 2 Switzerland 1 4 8 6.0 0.0823 0.1338 0 33.0 1 Italy 1 4 7 5.5 0.0726 0.1652 0 4.5 0
1
Financial-tax accounting alignment (0 = high; 1 = low); 2 Disclosure 1993; 3 Disclosure 2001; 4 Average disclosure (1993/2001); 5 Exchange rate variability; 6 Risk-adjusted stock market return; 7 Legal system (0 = Civil Law; 1 = Common Law); 8 Number of listed firms per capita; 9 Shareholder protection.
Source: prepared by the authors.
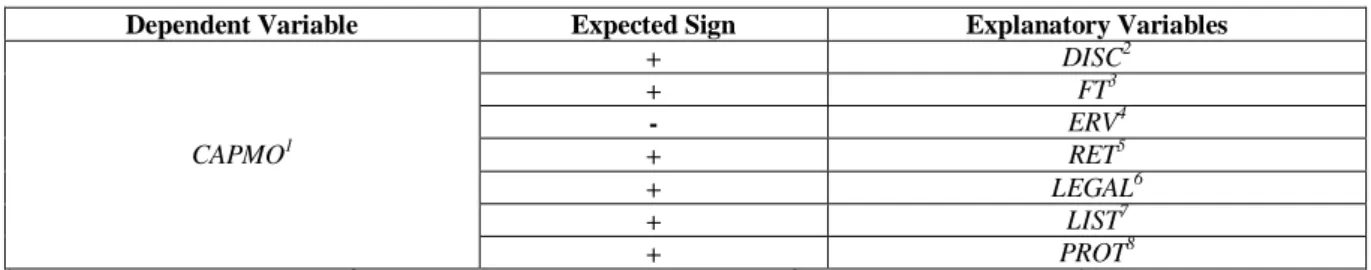
The search for a relationship between international capital mobility and the measures of relevance of information accounting was controlled by a set of five variables identified in previous studies as being relevant in co-explaining international capital mobility. We computed the Pearson’s and the Spearman’s correlation coefficients between the capital mobility factor, the measures of relevance of accounting information and the five control variables in order to assess whether the signs of the correlation coefficients are according to expected, as well as to assess which explanatory variables present high correlation with the dependent variable. The expected signs of the correlations are shown in Table 5. We found that the correlations between the explanatory variables and the capital mobility variable (CAPMO) are according to theory except for shareholder protection, which showed a weak and negative correlation. With respect to the variables linked to the relevance of accounting information, the Degree of Disclosure of Accounting Information of 2001 (DISC_01) showed to be more strongly correlated to CAPMO. Among the control variables, the exchange rate variability (ERV) and the risk-adjusted stock market return (RET) presented the strongest correlations.
Table 5: Expected Signs for the Correlations between CAPMO and the Explanatory Variables
Dependent Variable Expected Sign Explanatory Variables
+ DISC2
+ FT3
- ERV4
CAPMO1 + RET5
+ LEGAL6
+ LIST7
+ PROT8
1
International capital mobility; 2 Disclosure of Accounting Information; 3 Financial tax alignment; 4 Exchange rate
variability; 5 Risk-adjusted stock market return; 6 Law system; 7 Number of listed firms per capita; 8 Shareholder protection.
Tables 6, 7 and 8 present the results of these regressions. Both the coefficients of DISC and of the control variable exchange rate variability (ERV) were found to be significant. In the regressions involving DISC_93 and DISC_M, three countries had to be removed since their corresponding residuals were found to be outliers: Denmark, Sweden and Mexico. The 1 coefficients obtained from
the three regressions, having as explanatory variables DISC_93, DISC_01 and DISC_M, respectively, are positive and significant at the 1% level, according to expected, indicating that the higher the degree of disclosure of relevant accounting information, the higher is international capital mobility. The 2
coefficients obtained for the three regressions, associated with the control variable ERV are negative and significant at the 1% level, which is also coherent with theory. The three regressions presented Adjusted R2s of 0.5728, 0.4694 and 0.6092, respectively. For these three regressions, the diagnostic tests (Durbin-Watson, Bera-Jarque, and White) do not indicate signs of serial correlation, non-normality, and heteroscedasticity, respectively, at the 5% significance level.
The results show that the level of disclosure across countries in 2001 (DISC_01) presents a better relationship with capital mobility, as can be seen by the absence of outliers.
Table 6: Regression Results for DISC_93
Coefficients t-Statistics p-value
-0.1748 -0.4053 0.6906
1 (DISC_93) 0.1163 2.9866 0.0087
2 (ERV) -10.0009 -6.5068 0.0000
3 (dummy – Denmark) -1.2961 -6.7096 0.0000
4 (dummy – Sweden) 1.5931 6.5690 0.0000
5 (dummy – Mexico) 1.5007 8.0734 0.0000
Statistics
F 6.6307 0.0016
Adj. R2 0.5728
DW 2.0948
BJ 1.9467 0.3778
W 3.6258 0.8217
Table 7: Regression Results for DISC_01
Coefficients t-Statistics p-value
-0.8037 -1.1661 0.2580
1 (DISC_01) 0.1613 2.8142 0.0111
2 (ERV) -9.5857 -8.9187 0.0000
Statistics
F 10.2875 0.0009
Adj. R2 0.4694
DW 2.3718
BJ 0.3927 0.8217
Table 8: Regression Results for DISC_M
Coefficients t-Statistics p-value
-0.6780 -1.2735 0.2210
1 (DISC_M) 0.1559 3.3045 0.0045
2 (ERV) -9.8135 -6.3002 0.0000
3 (dummy – Denmark) -1.3251 -7.2821 0.0000
4(dummy – Sweden) 1.5677 7.0854 0.0000
5 (dummy - Mexico) 1.3176 8.8911 0.0000
Statistics
F 7.5479 0.0008
Adj. R2 0.6092
DW 2.1493
BJ 1.1197 0.5713
W 3.5362 0.8314
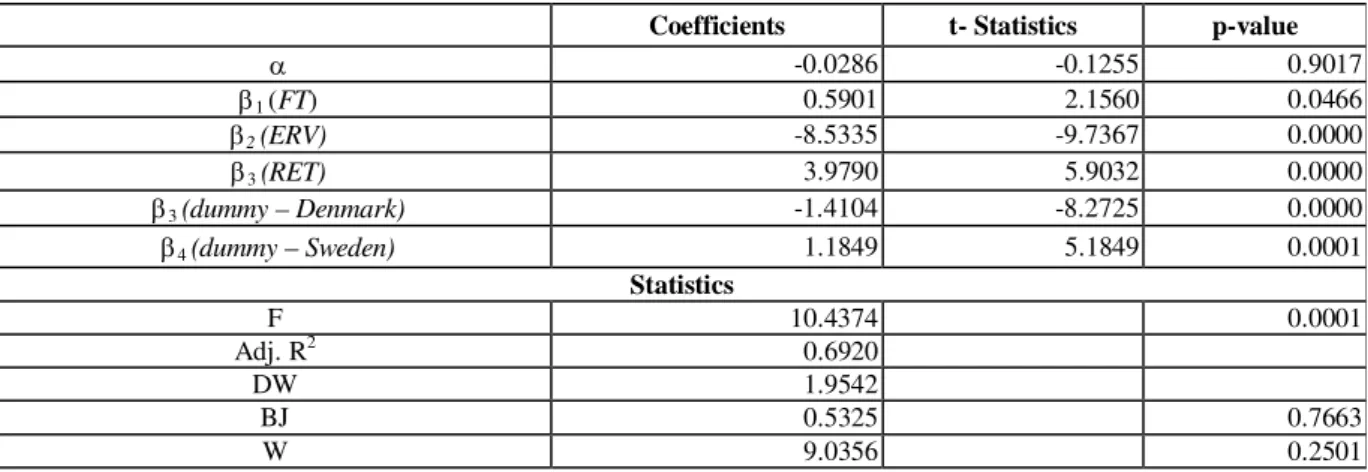
The second test was devised to assess whether the conformity of tax accounting and financial accounting (FT) affects international capital mobility across countries. With this purpose, equation (2) was submitted to regression by OLS and its results are shown in Table 9. Besides FT’s coefficient, we found that both control variables, exchange rate variability (ERV) and the risk-adjusted stock market return (RET) have significant coefficients. In this regression, Denmark and Sweden were removed from the sample since their residuals were found to be outliers. The regression’s coefficient 1,
associated to FT, is significant at the 5% level and positive as expected. The regression coefficients 2
and 3, associated with the control variables ERV and RET, respectively, are significant at the 1%
level. 2 is negative, whereas 3 is positive, which are both according to expected. The regression’s
Adjusted R2 is equal to 0.6920. The diagnostic tests (F, Durbin-Watson, Bera-Jarque, and White) indicate that the results are statistically robust and consistent with respect to the underlying hypothesis.
Table 9: Regression Results for FT
Coefficients t- Statistics p-value
-0.0286 -0.1255 0.9017
1 (FT) 0.5901 2.1560 0.0466
2 (ERV) -8.5335 -9.7367 0.0000
3 (RET) 3.9790 5.9032 0.0000
3 (dummy – Denmark) -1.4104 -8.2725 0.0000
4 (dummy – Sweden) 1.1849 5.1849 0.0001
Statistics
F 10.4374 0.0001
Adj. R2 0.6920
DW 1.9542
BJ 0.5325 0.7663
W 9.0356 0.2501
C
C
C
C
ONONONONCLUSIONSCLUSIONSCLUSIONSCLUSIONSAttempting to fill this void, our study aims to contribute to the literature on the relationship between capital mobility and financial accounting regulations in Latin-American countries and assessing how these countries fit into the more general global picture.
In general, we confirm previous findings that capital mobility is positively influenced by the degree of disclosure of accounting information across countries, as expected. We also find that the conformity of financial and tax accounting has a negative impact on capital mobility, as previously documented. Therefore, both hypotheses Ha and Hb set previously in this study are confirmed.
Regarding the three Latin-American countries investigated, Mexico, Brazil and Argentina appear respectively as 15th, 17th and 18th with respect to the degree of disclosure of accounting information, among the 22 countries. With respect to capital mobility, Mexico, Argentina and Brazil are ranked as 3rd, 13th, and 22nd, respectively. So it seems that apart from Mexico, the low levels of disclosure are more or less consistent with the poor performance in terms of international capital mobility. Possibly, Mexico’s high rank in capital mobility despite its weak disclosure position can be explained by the country’s proximity to the US and its participation in the NAFTA, which certainly boosts its capital mobility, regardless of its low disclosure standing.
With respect to the conformity between financial and tax accounting, Argentina and Mexico appear among the group with low conformity, whereas Brazil belongs to the high conformity group. Brazil also has the highest exchange-rate variability among all countries, whereas Mexico and Argentina rank as 5th and 19th, respectively. Since this variable has a negative effect on capital mobility, Brazil and Mexico do not stand very well in this aspect. In terms of risk-adjusted market return, the ranks are 16th for Mexico, 17th for Brazil, and 21st for Argentina, which are also poor performances. Regarding the rankings of listed firms per capita, Argentina, Brazil and Mexico are in the three last positions, respectively. Finally, with regard to shareholder protection, Argentina is within the 2nd best group, Brazil is within the middle group, and Mexico is within the group with the lowest shareholder protection level.
The overall picture seems to point out that the standings of the three largest Latin-American countries in terms of disclosure of financial accounting information are not very bright. However, although Argentina and Brazil suffer the effects of these lower standings on capital mobility, Mexico appears as an exception, possibly as a result of spillover effects from the US and NAFTA.
Finally, we recognize that the paper has several limitations, such as: a) small sample size; b) omission of other potentially relevant control variables, e.g. country risk, political and social instability, interest rate level and volatility, corruption level, tax burden, infrastructure and institutional factors, etc; and c) the fact the two sources of information on accounting disclosure across countries used are discontinuous and available only for 1993 and 2001.
R
R
R
R
EFERENCESEFERENCESEFERENCESEFERENCESAhearne, A., Griever, W. L., & Warnock, F. E. (2004). Information costs and home bias: an analysis of US holdings of foreign equities. Journal of International Economics, 62(2), 313-336.
Ali, A., & Hwang, L. (2000). Country-specific factors related to financial reporting and the value relevance of accounting data. Journal of Accounting Research, 38(1), 1-21.
Backus, D. K., Kehoe, P. J., & Kydland, F. E. (1994). Dynamics of the trade balance and the terms of trade: the J-Curve? American Economic Review, 84(1), 84-103.
Baxter, M., & Crucini, M. J. (1993). Explaining saving-investment correlations. American Economic Review, 83(3), 416-436.
Bayoumi, T. (1997). Financial integration and real activity. Ann Arbor, MI: University of Michigan Press.
Bushman, R., Piotroski, J., & Smith, A. (2004). What determines corporate transparency? Journal of Accounting Research, 42(2), 207-252.
Cooper, I., & Kaplanis, E. (1994). Home bias in equity portfolios, inflation hedging, and international capital market equilibrium. Review of Financial Studies, 7(1), 45-60.
Coopers & Lybrand. (1993). International accounting summaries – a guide for interpretation and comparison (2nded.). New York: John Wiley & Sons, Inc.
Diamond, D. W. (1985). Optimal release of information by firms. Journal of Finance, 40(4), 1071-1094.
Durnev, A., & Kim, E. H. (2007). Explaining differences in the quality of governance among companies: evidence from emerging markets. Journal of Applied Corporate Finance, 19(1), 29-37.
Gehrig, T. (1993). An information based explanation of the domestic bias in international equity investment. The Scandinavian Journal of Economics, 95(1), 97-109.
Gordon, R. H., & Bovenberg, A. L. (1996). Why is capital so immobile internationally? Possible explanations and implications for capital income taxation. The American Economic Review, 86(5), 1057-1075.
Hair, J. F., Jr., Anderson, R. E., Tatham, R. L., & Black, W. C. (1998). Multivariate data analysis (5th ed.). New Jersey: Prentice Hall.
Harris, R. S., & Havenscraft, D. (1991). The role of acquisitions in foreign direct investment: evidence from the U.S stock market. The Journal of Finance, 46(3), 825-844.
Hung, M. (2001). Accounting standards and value relevance of financial statements: an international analysis. Journal of Accounting and Economics, 30(3), 401-420.
International Monetary Fund. (various years). International financial statistics. Washington, DC: International Monetary Fund.
Korajczyk, R. A., & Viallet, C. J. (1989). An empirical investigation of international asset pricing. The Review of Financial Studies, 2(4), 553-585.
La Porta, R., Lopes-De-Sillanes, F., Shleifer, A., & Vishny, R.W. (1997). Legal determinants of external finance. The Journal of Finance, 52(3), 1131-1150.
Larson, R. K., & Kenny, S. Y. (1995). An empirical analysis of international accounting standards, equity markets, and economic growth in developing countries. Journal of International Financial Management and Accounting, 6(2), 130-157.
Lev, B. (1988). Toward a theory of equitable and efficient accounting policy. TheAccounting Review, 63(1), 1-22.
Lundholm, R. J. (1991). Public signals and the equilibrium allocation of private information. Journal of Accounting Research, 29(2), 322-349.
Mace, B. J. (1991). Full insurance in the presence of aggregate uncertainty. Journal of Political Economy, 99(5), 928-956.
Messitte, P. J. (1999). Sistemas de direito comum x sistemas de direito civil. U.S. Department of State,
Issues of Democracy. Retrieved March 15, 2004, from
http://usinfo.state.gov/journals/itdhr/0999/ijdp/messitte.htm
Moffett, M., Stonehill, A., & Eiteman, D. (2002). Fundamentals of multinational business finance. New York: Addison-Wesley.
Shukla, R. K., & Inwegen, G. B. van (1995). Do locals perform better than foreigners? An analysis of UK and US mutual fund managers. Journal of Economics and Business, 47(3), 241-254.
Tesar, L. L., & Werner, I. M. (1995). Home bias and high turnover. Journal of International Money and Finance, 14(4), 467-492.
The World Bank. (2005). World development indicators. Washington, DC: Author.
Verrecchia, R. E. (1982). Information acquisition in a noisy rational expectations economy.
Econometrica, 50(6), 1415-1430.