BRAZILIAN JOURNAL OF PUBLIC ADMINISTRATION | Rio de Janeiro 51(4):653-688, July - Aug. 2017
Brazilian chief executives of governments
Ivan Filipe de Almeida Lopes Fernandes
Universidade Federal do ABC / Centro de Engenharia, Modelagem e Ciências Sociais Aplicadas São Bernardo do Campo / SP — Brazil
Gustavo Andrey de Almeida Lopes Fernandes
Fundação Getulio Vargas / Escola de Administração de Empresas de São Paulo, Departamento de Gestão Pública São Paulo / SP — Brazil
he motives for choosing the government’s chief executive are of vital importance in a democratic society. In this article, evidence is presented of how local economic growth in the last year of government has a positive impact on the percentage of votes obtained by the incumbent in a population sample of Brazilian municipalities, with data of the presidential and municipal elections of 2000 to 2010. Real GDP growth of the city is used as a measure of local economic growth to test the hypothesis that voters in a municipality tend to reward incumbents and their candidates, if they had good economic performance in the last year of their mandate. he hypothesis is based on the economic theory of voting, suggesting that incumbents are more likely to win re-election, or elect their successor, when the economy is good. Panel and Multilevel models are used to detail the efects and the impact of economic growth in the proportion of votes obtained by the incumbent. he multilevel analysis was used in order to better explore existing heterogeneity in the economic voting phenomenon and thereby infer how economic growth efects may vary among parties, the federation units, constituency and other variables.
Keywords: accountability; economic vote; public expenditure.
A importância do crescimento econômico local na escolha do chefe do Executivo no Brasil
A investigação dos fatores que inluenciam a escolha do chefe do Executivo no Brasil é uma questão de vital im-portância. Neste artigo, apresentam-se evidências de que o crescimento econômico local no último ano de governo possui impacto positivo na porcentagem de votos obtidos pelo incumbente em uma amostra da população dos municípios brasileiros, com dados das eleições presidenciais e municipais de 2000 a 2010. Usamos a expansão real do PIB municipal como medida do crescimento econômico local e testamos a hipótese de que os eleitores em um município premiam os incumbentes, ou seus respectivos candidatos, que tiveram bom desempenho econômico no último ano de mandato. A hipótese se baseia na teoria econômica do voto que sugere que os incumbentes têm mais chances de vencerem uma reeleição, ou elegerem o seu sucessor, quando a economia está em um bom mo-mento. Na análise utilizamos as abordagens para dados em painel, além de análise multinível, de modo a melhor explorar a heterogeneidade existente no fenômeno do voto econômico e com isso inferir a existência de efeitos do crescimento econômico na proporção de votos obtidos pelo incumbente e como estes efeitos podem variar em relação a partidos, unidades da federação, circunscrição eleitoral e outras variáveis.
Palavras-chave: accountability; voto econômico; gasto público.
La importancia del crecimiento económico local en la elección del jefe del Ejecutivo en Brasil
La investigación de los factores que inluyen en la elección del jefe del Ejecutivo en Brasil es un asunto de vital impor-tancia en la literatura. En este artículo, presentamos evidencia de que el crecimiento económico local en el último año del gobierno tiene un impacto positivo en el porcentaje de votos obtenidos por el incumbente en una muestra de los municipios brasileños, con datos relativos a las elecciones presidenciales y municipales de 2000 a 2010. Utilizamos el crecimiento real del PIB municipal como medida de crecimiento económico local para poner a prueba la hipótesis de que los votantes en una ciudad tienden a recompensar el titular, y sus candidatos, que tuvieron un buen desempeño económico en el último año mandato. La hipótesis se base en la teoría económica de la votación que sugiere que los titulares tienen más probabilidades de ganar la reelección, o elegir a su sucesor, cuando la economía está en un buen momento. En el análisis se utiliza los métodos de datos de panel y el análisis multinivel con el in de aprovechar mejor la heterogeneidad existente en el fenómeno del voto económico y con ello inferir la existencia de efectos del crecimiento económico sobre la proporción de votos obtenidos por el incumbente y cómo estos efectos pueden variar em relación a partidos, las unidades de la federación, circunscripción electoral y otras variables.
Palabras clave: accountability; voto económico; gasto público.
DOI:http://dx.doi.org/10.1590/0034-7612146091
Article received on February 16, 2015 and accepted on June 30, 2017.
1. INTRODUCTION
Voting is an essential mechanism for controlling public administration and is a fundamental condition for democracy. Elections are the main form of vertical accountability, allowing citizens to evaluate the government’s performance, as well as the attractiveness of alternative proposals — on the most diverse matters — put forward by incumbent groups or by those in the opposition. he control of elected politicians by voters is a central theme of Political Science (Samuels, 2004). he very idea of democracy is closely related to the ability of voters to impose some kind of control over their elected representatives. he vast literature on economic voting takes as a normative assumption the capacity of the voter to punish or reward political parties and leaders, controlling democratic governments (Anderson, 2007). Not surprisingly, with the sequence of democratic governments ater the end of the military dictatorship, the analysis of the determinants of the votes received by incumbent candidates in Brazil started to gain attention (Hunter and Power, 2007; Singer, 2009; Zucco, 2008).
Among the various issues about the public sector, economic management can be considered central in the analysis of government performance. However, most research on economic voting focus on how national conditions, or the individuals’ well-being, afect voting decision. Only sparse studies analyze how local economic conditions afect election choice, which raise concerns because the theoretical component of the literature on economic voting considers local economic conditions as relevant. In addition, the estimated response for most of the widely used levels of analysis — the individual or national levels — may be spurious if the response to the local variables is substantial (Elinder, 2010; Ansolabehere, Meredith and Snowberg, 2014).
his article presents evidence that local economic growth positively afects the percentage of votes obtained by the incumbent candidate, taking into account the efects of regional economic growth — measured by the state’s GDP growth — and national economic growth. he results are obtained from the analysis of the presidential and municipal elections from 2000 to 2010, in all Brazilian munici-palities. he main hypothesis is based on the economic voting theory that suggests that incumbent candidates get the largest share of votes when the economy is good (Anderson and Morgan, 2011; Duch and Stevenson, 2008; Lewis-Beck and Paldam, 2000; Paldam, 1994). In this regard, the study contributes to the literature by exploring how the expansion of the local economy — ‘local’ deined by the Brazilian municipal division — tends to beneit the incumbent candidate both at the local level (running for mayor) and at the national level (running for president).
he starting point of the study is that local economic factors tend to be perceived by voters in a more intense way than the growth of the economy as a whole. hus, the Brazilian experience is important because of the large territory and the size of population, where the huge distances make economic expansion a phenomenon necessarily local. For example, the growth of an industrial cluster in the Northeast may be the result of the closure of industrial plants in the South or Southeast. At the national level, the aggregate impact can be positive or negative, but in a disaggregated way, these are very diferent economic experiences. In summary, this study seeks to explore the economic efects voters feel more intensely.
elections, which allows to see whether these efects are diferent, coinciding with the attributions of
each level of power.1
he article is structured into six sections, including this brief introduction. he second section describes the economic voting theory, which ofers the basis for the analysis. he third section de-scribes the study’s approach and methodology, which includes the use of panel data and multilevel analysis. he next section presents the data obtained and the ith the analysis conducted, followed by the inal section with the conclusions.
2. VERTICAL ACCOUNTABILITY PROCESS: DETERMINANTS OF THE VOTE
Attempts to explain the rationale behind individuals’ vote decision have stimulated a strong ield of studies seeking to understand the motivation and origins of voting throughout the democratized world. In particular, one of the main schools of thought in this ield is the economic school, which analyzes voters’ behavior from the point of view of rational choice theory. Research on the determinants of voting originates in the irst mass surveys conducted by Berelson and partners (1954) and Camp-bell and partners (1960), but the debate on the relationship between economics and voting gained strength with the seminal studies of Downs (1957), Key (1964, 1966) and Kramer (1971). Downs (1957) introduced the notion that individuals make choices based on comparison of expected utility towards competing parties; citizens would behave as consumers in a political market and compare prospectively the proposals of diferent parties and candidates as goods to be consumed.
he studies from Kramer (1971), Goodhart and Bhansali (1970) and Mueller (1970) were aimed at testing Downs’ hypothesis in the US and UK, inspiring a broad research program. Key (1964, 1966) proposed an alternative perspective on economic voting, which would relect the analysis of past facts and not expectations about the future. Economic voting would work as a referendum about the incumbent candidate’s ability to manage the economy, giving a ‘retrospective’ characteristic to the vote decision. Fiorina (1981) updated the argument by analyzing how voters rationally act when face information scarcity. he main point is that voters, regardless of their level of information, are sensitive to the impact of government activities aimed at improving their well-being and use their view on these activities in order to guide their vote. hus, future expectations are, for the most part, extrapolations of current trends.
Economic voting theory suggests that retrospective voting, based on past economic outcomes, allows voters to demand responsiveness of elected politicians in managing the economy. he mech-anisms linking economic performance to voting behavior can either be a sanctioning process for poor economic performance (Kramer, 1971; Fair, 1978) or a way to assess how potential partisan competitors can perform in the future (Downs, 1957; Stigler, 1973).
A key assumption of both prospective and retrospective voting theories is that the government has a direct inluence on the country’s economic performance. hus, an improvement in economic conditions increases the probability of voting in the party that is perceived as responsible for this
1 he analysis of votes for state governor was excluded because the state government elections are carried out simultaneously with the
outcome. In addition, a better economic performance tends to indicate a greater administrative ca-pacity, as well as positively afecting the voters who do not identify with any party (Virmani, 2004; Anderson, 1995; Anderson and Morgan, 2011).
he electoral process, therefore, would be related to a calculation made by the voter in accordance with the diferences in the expectations towards political parties, comparing what the government in power ofers with what would supposedly be obtained if the opposition won the elections. Fair (1978), for example, when analyzing the presidential election in the US, found that electoral behavior largely depends on the economic events of the year before the election. he author’s main conclusions are that US presidents tend to be re-elected when there is economic growth, federal spending is controlled and a major war has been avoided. In a later study, Fair (1996a) showed that voters react positively to real GDP growth per capita in the election year.
he literature on economic voting was developed based on the American case study. hree di-mensions of the economic evaluation dominated the literature: a) time of reference when it comes to calculate the evaluation (retrospective or prospective vote); b) context of economic policy or the degree of authority the incumbent has to make decisions over policies that afect economic outcomes; and c) whether the object of evaluation is personal or social welfare. he voter who judges the incumbent from national conditions is regarded as a sociotropic voter and the voter who judges from his
indi-vidual conditions is an egotropic voter (Lewis-Beck and Stegmaier, 2000; Kinder and Kiewiet, 1981).2
An important part of the studies on economic voting has focused on analyzing the relationship between economics and politics at the national level. Some of these studies have advanced in the debate about the diferences of the economic voting among democratic regimes. Duch and Steven-son (2008) conducted a detailed study of 18 democracies, inding a signiicant relationship between economic perceptions and voting choices, especially in systems that concentrate the power of politi-cal decision-making. Powell and Whitten (1993) observed that models of conventional sanctions by economic voting oten explain the variations in the behavior of electoral punishment. his behavior is conditioned by how clear is the attribution of responsibility towards the political incumbents, which may remove the efect of economic variables on election results and stresses the importance of the context as a variable to understanding the relation between economy and politics when it comes to voting. For Powell and Whitten (1993) the context of the vote is given by the ‘clarity of responsibil-ity’ i.e. to which measure it is possible to say the incumbent politician is responsible for economic conditions. his contribution was crucial to help explaining the reasons why studies such as Paldam’s (1991) — who analyzed the relation of interest in developed and democratic countries — did not ind (when comparing in a transnational context) similar results to those presented at the national level.
2.1 LOCAL ECONOMIC VOTING
Results found in the empirical literature still present several puzzles, especially due to the great di-vergence between the conclusions obtained in diferent countries and over time (Lewis-Beck and Paldam, 2000; Dorussen and Taylor, 2002). Nevertheless, the vast majority of studies that investigate the efects of economic voting only observe regional or national data, as well as surveys conducted
directly with the voter (Brug, Cees and Franklin, 2007). On the other hand, studies using municipal data are generally concerned with the efects of iscal manipulation and they did not focus on under-standing the efects of economic performance.
Sakurai and Menezes (2008), for example, using panel data from more than 2,000 Brazilian municipalities, indicate the existence of a positive inluence of public spending on the probability of mayors to be re-elected. Veiga and Veiga (2007), with data from municipalities in Portugal, show that the increase in public spending related to investment, as well as changes in the composition of spending favoring items with greater visibility, are positively associated with the percentage of mayors seeking re-election. Levitt and Snyder (1997) show that the results of the election for the American Lower House are inluenced by federal spending in the counties. Jordahl (2002) shows the electoral response in Sweden for national government funds earmarked for speciic municipalities. Brender (2003) inds evidence that the iscal performance of local governments in Israel positively impacts the chances of re-election only in some of the elections. Finally, Drazen and Eslava (2010), examining forms of electoral manipulation of municipal expenditures using data from all Colombian munici-palities, verify that national economic growth afects the elections.
Other works show the connection between local economic conditions and the support of the incumbent or opposition. Lindbeck and Weibull (1993) as well as Dixit and Londregan (1996) show that governments redistribute resources to regions with greater potential for attracting votes, while Cox and McCubbins (1986) verify redistribution to regions where there is greater support for the incumbent.
hus, very few studies test the efect of municipal (or local) economy performance on national elections. Some of the few exceptions found are the studies conducted by Martins and Veiga (2014), Oliver and Ha (2007), Pattie and Johnston (2001) and Elinder (2010). In the irst, the researchers found a positive relationship between the local and national efects of economic performance on the percentage of votes obtained by the party of the current mayor in Portugal. Oliver and Ha (2007), using survey data from more than 1,400 voters in 30 diferent suburban communities in the United States, concluded that better local government performance is positively related to incumbent support.
Pattie and Johnston (2001) analyzed the 1997 general elections in the United Kingdom and showed the importance of the local economy in understanding voters’ electoral behavior. Using survey data on individuals’ perceptions about the economy, they found evidence that voters are less inluenced by perception of changes in national economic prosperity than of changes in local economic prosperity. In addition, they also found evidence that local economic prosperity plays a greater role in choice of vote than the improvement in the individuals’ economic well-being. Finally, Elinder (2010) analyzes how local economic conditions — such as economic growth and unemployment — afect the electoral performance of candidates in local counties and regions in Sweden.
3. THEORY AND METHODOLOGY
rationale — they evaluate whether the vote and the past results punish or reward the political party for its previous performance — and a prospective rationale — in which past economic performance is used as a proxy for forecasting future performance.
In addition, assuming that individuals are risk averse, it is natural that they choose to reward an incumbent group that has produced favorable results, since there is a degree of uncertainty regard-ing the vote for the opposition (unlike the incumbent who is known by all voters, the opposition’s capacity is yet unclear). Against this backdrop, it is expected that the best economic performance, including the efects on the local economy, will afect the performance of the incumbent in the dif-ferent electoral regions.
A fundamental contribution of this research is to prioritize the analysis of local economic condi-tions. his adds value to indings already disseminated in the literature, which are essentially based on the efects that national economic results or that individual’s well-being have on voters decisions. he omission of local variables, however, can produce poorly speciied models, leading to biased estimates of the impact of national growth or individual well-being (Elinder, 2010).
When choosing to use municipalities as the basic unit of analysis, this research addresses several fundamental issues in the literature on economic voting. Among these issues is the control for insti-tutional variability, because by always deining the same context in all municipalities (the coalitional presidentialism, in which mayors and presidents compete for the voters’ direct preference), inluences from the institutional context (clarity of responsibility) are eliminated when it comes to estimate the impact of the economy on elections. he choice of an objective measure of economic performance — such as the growth of municipal GDP — removes problems concerning the economic perception of each individual about their situation and the situation of their region.
In addition, the estimation strategy based on panel data using ixed efects and year dummies, allows controlling general impacts on elections — including national and international economic conditions and other relevant sociopolitical phenomena, such as ideology, president’s proile and external conditions. Obviously, this strategy also allows controlling the idiosyncratic characteristics of municipalities. his facilitates the proper estimation of the true efect of the local economy on the electoral performance of the incumbents by reducing the possibility of confounding variables
afecting the relation of interest.3
On the other hand, the research design establishes some limits to our indings. In choosing the municipality as the unit of analysis, it is not possible to draw any kind of conclusion about the behavior of individuals — which would be a typical case of ecological fallacy — preventing the evaluation of the results regarding the mental frame of the vote decision: prospective or retro-spective voting and sociotropic or egotropic voting. hus, the observed results are analyzed from the perspective of the incumbent candidate, not the voter, since the study works with aggregates and the candidates actually do their electoral calculations, keeping in mind the potential reactions of the voter groups.
3 Although it is interesting to estimate the efects of the national economy, the few years available in the database (only 6 elections),
herefore, the study analyzed the efect of local aggregate variables on incumbent electoral per-formance. hus, the hypothesis of traditional research on economic voting was reformulated, not from the decision of the voter, but from the logic of the incumbent candidate. he incumbent has a
better electoral performance the better are the economic results at the local level.4
he research used the incumbent’s share of votes as the dependent variable. An alternative way would be to use a variable that captures whether the incumbent won the election or not. However, the irst strategy was chosen since the use of a dummy for victory implies not only a good performance, but also a positive result in the elections i.e. electoral success. In this case, the research would be measuring if the economic performance allows exceeding a minimum number of votes, a number that would represent the victory in the election, which is always conditioned at the speciics of each election. Using the share of the votes allow us to have a more sensitive ‘thermometer’, able to better capture the impact of economic performance, which may or may not have been enough to give the incumbent the victory at the polls.
In addition, by using a dichotomous variable, much variation is lost, which is costly from the statistical point of view. herefore, the use of the fraction of the votes is more advantageous from a methodological and theoretical point of view, eliminating probable confounding factors that afect
the likelihood of electoral victory.5
he study of the incumbent electoral performance was conducted in two stages. In the irst, we analyzed the economic vote through panel data, which allows to control for unobservable
idiosyn-crasies (ci) of the municipalities, for exogenous shocks, as well as it increases the estimates precision
(Hsio, 1986). he relationship is estimated through panel data techniques that allow analyzing whether unobservable idiosyncrasies afect or not the estimation. For this, we used the three traditional static panel models: polled panel data, random efects (RE) and ixed efects (FE). It is worth remember-ing that the ixed efects analysis (FE) assumes that the speciic efect is treated as a parameter to be
estimated and, thus, the ci can be correlated with the other regressors.6
Ater analyzing the main relation of interest in the panel study, the second stage was to relax the hypothesis of the absence of heterogeneity in the impact of the several variables on the incumbent share of votes. For example, one option was to estimate separately panel models for municipal and presidential elections. However, even considering the existence of a diferent impact, if assumed that there is a correlation between both elections, the information of the dataset is better managed by estimating the regressions through multilevel models (Gelman and Hill, 2007). hat is, the efect of economic growth on incumbent voting through the multiple-level approach allows estimating and
4 Tucker (2006) used the same research strategy in his analysis about the efects of the local economic aggregates during the
post-commu-nist transition in Eastern European countries and in Russian national elections. However, both in Tucker as in this study, the theoretical justiication for economic voting is elaborated from the assumption of the voter rationality and the strategic action of the politician seeking this rational voter’s support.
5 Victory is deined here as the incumbent’s election or when the incumbent wins a position in the runof, since the study used data from
the results of the irst round of municipal and presidential elections. Considering this deinition, the models were estimated only for municipal elections, because there is no variation in the dependent variable for the presidential elections — in the three elections, the incumbent candidate was elected in the runof. However, despite all the caveats made above, the variable ‘victory’ was tested in linear models and using logistic regression. Results were irrelevant in all models regarding local economic growth, and negative and irrelevant in the ixed efects models for regional growth. Results were negative and meaningful for national economic growth. hese indings are available in the appendix 2.
6 Ater the estimations, the Breush-Pagan test was conducted in order to verify the presence of speciic heterogeneity. In addition, the
thereby testing coeicients for federation unit, political party, election year and election type. his approach allows to explore in depth the data, because makes it possible to study the variation of the economic efects along these diferent dimensions. Categories deined by the size of economic growth and the size of municipal GDP were included. Ten categories were established in each of these vari-ables, according to each decile of the distribution of growth and the size of GDP in each speciic year. hus, it is possible to understand how diferent groups respond diferently to economic efects and how economic voting can operate diferently within the same socioeconomic and institutional reality. he inclusion of the analysis of heterogeneous efects relativizes the essentially economistic view portrayed in the literature on economic voting, allowing to identify more clearly the conditions through which economics and politics are mutually dependent. his leads to answering a fundamen-tal question of the research: is the efect of economic growth stronger for the municipal or federal incumbent?
For multilevel estimation, six separate models are created and each one of them present the levels mentioned above. he models presenting the most relevant results from the statistical point of view were identiied. It is important to say that the multilevel models used here have random intercept and slope.
3.1 MODEL OF ECONOMIC VOTING IN BRAZIL
he sample analyzed in this article covers 5,565 Brazilian municipalities and the elections happened
between 2000 and 2010.7 As described below, the database included ive types of variables: political,
economic, iscal, demographic and geographic. he last three are used as controls in the estimation. he basic equation to be estimated is:
fracaovotos it = α + ci + β1 cresc it + β3 control variables it + λ1 dummies it + εit ; (1)
where i refers to the municipality, t to the year and α, ci andεit are, respectively, the constant, the
municipal ixed efect and the idiosyncratic error; cresc is the independent variable of interest and
fracaovotos the dependent variable. he variable fracaovotos indicates the percentage of valid votes
(total votes minus null and blank votes) that the incumbent candidate obtained. he regressor cresc is
the growth rate of real municipal GDP that, according to the theoretical-methodological framework adopted, is used to measure the economic growth during the year of the presidential and municipal elections. As for the multilevel models, the basic equation estimated is slightly diferent, including dummies for the levels:
fracaovotos i = αi[j] + β1(j) cresci[j]+ β2 control variablesi + λ1 dummiesi + εit[j] ; (2)
where i refers to the municipality, αi[j]andβ1[j] are, respectively, the intercept and the random
coei-cient of interest, and [j] is the group subscript indicative. Finally, εit[j]is the idiosyncratic error.
7 he selection of the municipalities was conducted based on availability of the data for the variables established. he research aimed to
4. DATA
Electoral data was obtained from the Superior Electoral Tribunal (TSE), covering information for 5,565 Brazilian municipalities, referring to the municipal elections of 2000, 2004 and 2008 and to the presidential elections of 2002, 2006 and 2010. he last year analyzed is 2010 because the main independent variable — municipal economic growth — is available from the Brazilian Institute of Geography and Statistics (IBGE) only until 2011. Consequently, it is impossible to estimate the relation of interest in the municipal elections of 2012 and in the 2014 presidential elections.
For the presidential election in the years 2002, 2006 and 2010, it was possible to clearly deine the incumbent candidates in all municipalities (obviously, the incumbent candidates for all munic-ipalities were those running for presidency in each of the years). In 2002, the incumbent was José Serra, from PSDB; in 2006, Luiz Inácio da Silva (PT); and in 2010, Dilma Roussef (PT). As for the municipal elections, identifying the incumbent candidates presented a challenge that was dealt by assuming that the incumbent was the candidate that had the same name as the current mayor at the year of the election, or is the candidate from the same party. When there were two candidates itting the two conditions, the irst was considered the incumbent. he number of municipalities with incumbent candidates in the sample per year was as follows: in the year 2000 there were 4,423 municipalities with incumbent candidates; In the year 2002, 5,563 municipalities; In the year 2004, 3776 municipalities; In the year 2006 were 5,565; In the year of 2008, 4,123; And, inally, in the year 2010, 5,495 municipalities. In this way, the sample analyzed was composed of more than 5,000 Brazilian municipalities in six subsequent electoral periods, constituting an unbalanced panel, but quite abundant in information.
his strategy of incumbent identiication generates a measurement error by not identifying the candidate for the succession of a mayor who does not run for reelection and has changed party and/or has launched a successor from another party. We preferred to adopt a more conservative metric of incumbent identiication, understanding that this diference does not compromise the indings, as there is no link in literature connecting politicians changing parties with local economic performance. More importantly, when incumbent candidate in a municipality is not a politician running for reelection and is a politician belonging to another party (diferent from the current mayor’s party), but representing a party coalition that is currently in government, the municipality was excluded of the analysis in that year. his explains why there are fewer cases analyzed in years of municipal elections
Control variables regarding politics, economy, geography and municipal public spending were considered. Economic and demographic variables were obtained from IBGE, including the population of the municipality and the real municipal GDP. he variables that measure municipal expenditures were obtained from the National Treasury Secretariat, and Datasus ofered data on the percentage of municipal budget applied in health in all Brazilian municipalities.
In addition to iscal, demographic and economic information, the study explored the po-tential role played by the mayor-president relationship in the election. To this end, we built a binary variable that indicates whether the mayor had political connections with the president. In years of presidential election, we observed if the mayor belonged to any party in the electoral coalition formed around the incumbent candidate to presidency. In years of municipal election, the research observed if the incumbent candidate’s party was in the political coalition ruling the federal government. he choice to use electoral coalition in years of presidential elections was made because the coalition indicates more clearly the coordination of electoral eforts between the parties that are capable of afecting the political-economic dynamics analyzed here. As for the years of municipal election, the study used the government’s political coalition data elaborated by Figueiredo (2007). he electoral and political coalitions are as follows: 2000 — PSDB, PFL, PMDB, PPB; 2002 — PSDB, PMDB; 2004 — PT, PMDB, PL, PPS, PSB, PCdoB, PTB, PV; 2006 — PT and PCdoB; 2008 — PT, PMDB, PL, PP, PSB, PCdoB, PTB. hus, for the analysis of political connec-tions between mayor and president, the research was based on the party’s alliances at the federal level. Data on the mayor’s party was collected from the municipal elections result, immediately preceding the presidential election.
CHART 1 DESCRIPTION OF VARIABLES
fracaovotos proportion of valid votes obtained by the incumbent (0-100)
cresc real municipal GDP’s growth rate
lpibreal log of real municipal GDP
crescuf real state GDP’s growth rate
lpibuf log of real state GDP
crescbr real national GDP’s growth rate
lpibbr log of real national GDP
prefeitobase dummy related to mayor belonging to the electoral coalition of the incumbent candidate to presidency (1-belongs; 0-does not belong)
persaude percentage of the budget spent in health (%)
lpop log of the municipality’s population
ldesporc log of the municipal budget spending in electoral year (R$)
linvest log of the municipal spending on investment in electoral year (R$)
ldespcor log of the municipal current spending in electoral year (R$)
laseps log of the municipal spending on social services and social security in electoral year (R$)
leec log of the municipal spending on education and culture in electoral year (R$)
lheu log of the municipal spending on housing and urban development in electoral year (R$)
lses log of the municipal spending on health and sanitation in electoral year (R$)
ldespes log of the municipal spending on personnel in electoral year (R$)
municipal dummy related to the type of election (1-municipal; 0-presidential)
- federal units dummies
- candidate’s political party dummies
a2000-a2010 year dummies
deciscresc deciles of the municipalities’ real economic growth
decispib deciles of log of the real municipal GDP
Source: Elaborated by the authors.
In addition, possible macroeconomic shocks were controlled by year dummies and dummies indicating the federation units, the incumbent’s political parties and the type of election (presidential or municipal). Group variables were created, indicating the levels that will be used in the second step of the analysis. here are six levels: party of the candidate; federation unity; type of election; election year; real municipal GDP; and decile of the municipalities’ real economic growth. he description of the variables is shown in chart 1 and their respective descriptive statistics in tables 1 and 2.
5. RESULTS
his section presents the main results obtained with the application of panel and multilevel methods. he results of the estimations using panel data techniques are presented in table 3. he estimates ob-tained with the multilevel model were analyzed in order to verify if the results of the coeicients of
interest were signiicant (the intercept and the estimated slope of the cresc variable), when analyzed
at the six diferent levels.
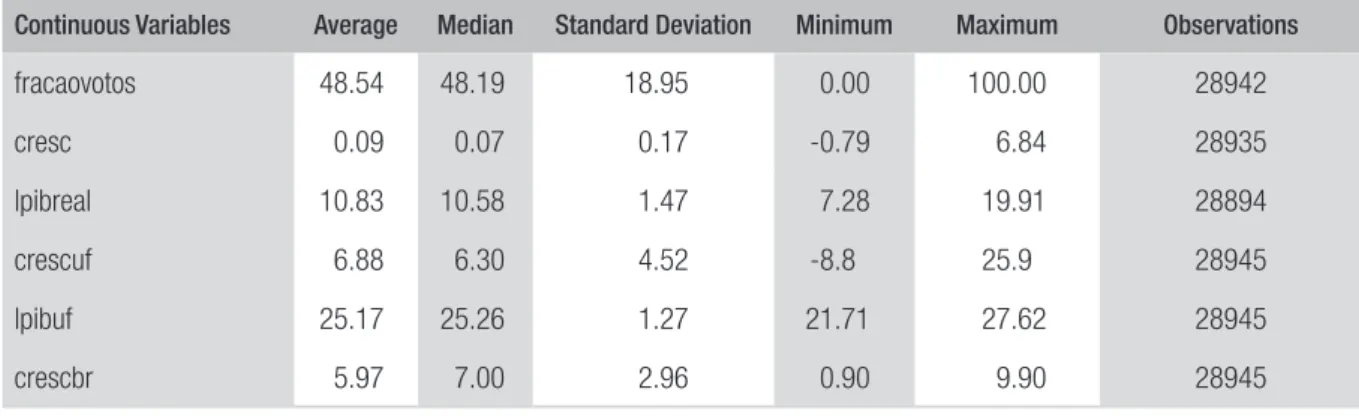
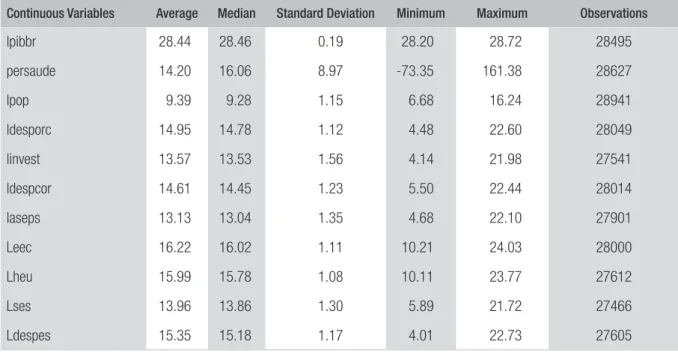
TABLE 1 DESCRIPTIVE STATISTICS OF CONTINUOUS VARIABLES
Continuous Variables Average Median Standard Deviation Minimum Maximum Observations
fracaovotos 48.54 48.19 18.95 0.00 100.00 28942
cresc 0.09 0.07 0.17 -0.79 6.84 28935
lpibreal 10.83 10.58 1.47 7.28 19.91 28894
crescuf 6.88 6.30 4.52 -8.8 25.9 28945
lpibuf 25.17 25.26 1.27 21.71 27.62 28945
crescbr 5.97 7.00 2.96 0.90 9.90 28945
Continuous Variables Average Median Standard Deviation Minimum Maximum Observations
lpibbr 28.44 28.46 0.19 28.20 28.72 28495
persaude 14.20 16.06 8.97 -73.35 161.38 28627
lpop 9.39 9.28 1.15 6.68 16.24 28941
ldesporc 14.95 14.78 1.12 4.48 22.60 28049
linvest 13.57 13.53 1.56 4.14 21.98 27541
ldespcor 14.61 14.45 1.23 5.50 22.44 28014
laseps 13.13 13.04 1.35 4.68 22.10 27901
Leec 16.22 16.02 1.11 10.21 24.03 28000
Lheu 15.99 15.78 1.08 10.11 23.77 27612
Lses 13.96 13.86 1.30 5.89 21.72 27466
Ldespes 15.35 15.18 1.17 4.01 22.73 27605
Source: Elaborated by the authors.
TABLE 2 DESCRIPTIVE STATISTICS OF CATEGORICAL VARIABLES
Binary and Categorical Variables 0 1
Prefeitobase 16,138 12,791
Municipal 16,623 12,322
2000 2002 2004 2006 2008 2010
Year 4423 5563 3776 5565 4123 5495
Categories of income and
municipal growth 1 2 3 4 5 6 7 8 9 10
Deciscresc 2893 2892 2898 2895 2886 2887 2891 2905 2898 2900
Decispib 2883 2885 2887 2892 2889 2882 2898 2901 2885 2943
Other Categorical Variables
Federal unit dummies for each state and variables for all the states
dummies of candidate’s political party dummies for each political party and variables for all the parties
Source: Elaborated by the authors.
5.1 RESULTS OF PANEL DATA ANALYSIS
president. As expected, the Hausman Speciication Test (1978) indicates that the ixed efects model
is preferable.8 In addition to the year dummies, in columns 4 to 6, the variable on the type of election,
presidential or municipal, is included.
he main conclusion points to the existence of a positive relationship between municipal eco-nomic growth and the vote obtained by the incumbent in the municipality, since in all models, statistical signiicance cannot be rejected with the inclusion of additional controls. In fact, the six columns of coeicients in table 3 indicate that the growth in the real GDP of the municipality
(cresc) has a positive and signiicant relation with the percentage of votes obtained by the
in-cumbent. he results of columns 04 to 06 bring further evidence in favor of the hypothesis of the existence of an economic vote, since in the three models analyzed here the growth coeicient is positive and statistically signiicant. his is true even ater including innumerable control variables that are capable of capturing a good part of the temporal variation of the sample (year dummies and the type of election), as well as the variables that capture the variation and the level of state and national GDPs. In the model with all controls the ratio between the 1% growth of real local prod-uct increases between 1.01 and 1.15 percentage points in the fraction of votes obtained by the incumbent candidate.
As expected, the coeicients of the estimates with more controls are slightly smaller and have less statistical signiicance than the coeicients of the estimates of the reduced models. However, the empirical analysis clearly shows that one cannot reject the local economic vote in the Brazilian presidential and municipal elections. he results show that the incumbent tends to be rewarded in the elections when the local economy presents economic growth, being punished otherwise. he investigation of the non-linearity of the efects of the economy on the proportion of votes obtained by the incumbent is shown in the next section.
In addition to the evidence on the relationship between local economic growth and the votes obtained by the incumbent, table 4 presents a number of relevant implications. Among them, it is important to notice that in almost all models the coeicient of real GDP (lpibreal) inluences in terms of diiculties for the candidates in municipalities of larger economy, indicating that the greater the wealth of the municipality, the worse the incumbent’s electoral conditions are. he number of inhabitants (lpop) was also relevant, pointing to the strengthening of the opposition vote in cities with a larger population, despite the signs reversed in the models of random and polled efects of columns (1) and (2). However, in the ixed efects model and with all the controls, the hypothesis of a negative relation is not rejected. As expected, electoral competition seems to be more intense in the largest cities in the country, whereas, in smaller localities, the incumbent tends to receive more votes.
As for the pattern of public spending, it was observed that the expenditure on education and cul-ture (leec) positively afects the number of votes achieved by the incumbent. his conclusion veriied in all models tested and with substantive efects, indicates the importance given by voters to this type of expense, and can be considered a basic need to be met in the locality. he models indicate that the growth of 1% of public spending in this sector tends to increase the proportion of votes obtained by
the incumbent from 1.5 to 6.5 percentage points, of which 1.54 percentage points in the ixed efect model with controls.
Regarding the other sectors of public administration, some results are surprising. Social services and social security (laseps) expenditures are always positive, although not statistically signiicant in the models with ixed efects with all controls. Indeed, spending on aid to people in sensitive social situations and retirees seems to reward the incumbent.
As for the electoral efects of spending on health and sanitation (lses) are unstable. In the ran-dom efects models with all controls, the indings are positive and signiicant, while in the ixed efect model it is always negative, although insigniicant ater inserting the year dummies. his is not surprising, given that health and sanitation are two categories of expenditure of a distinct nature, despite being grouped in the same function. Sanitation, for example, is a medium and long-term public expenditure, while spending on health can be immediately tangible as a vacci-nation policy or less visible as the deepening of the Family Health Program. When looking only at the percentage spent on health (persaude), the signal is positive and statistically signiicant in all models.
In any case, the trinomial composed of health, education and social services seems to be positively related to the incumbent’s vote, even though the indings on health and sanitation (lses) are more uncertain. As a result, the Brazilian electoral system seems to work in the direction of stimulating greater eforts in social policies at the local level.
he other municipal iscal variables aggregated, had diferent efects, altering the signal of the respective coeicient, with the addition of larger controls. In the ixed-efects model, spending on personnel and investments were positively related to the votes obtained by the incumbent. On the other hand, spending on housing and urban development (leu) was quite unstable, and always signiicant, positive in random and polled models and negative in ixed efect models, an outcome that does not allow securely argue about the efects. his result for housing and urban development, considering that further investigation is needed, is not surprising given that this area receives investments from diferent levels of government, which could justify the hypothesis of less identiication of the voter with the person in charge of spending.
An example of the diiculty of voter identiication is the existence of programs related to housing and urban development from diferent levels of government (federal, state and municipalities), coex-isting under the management of the municipal authorities. As an example, municipalities of the state of São Paulo are beneited with a program conducted by the State Secretariat of Housing, through the state owned company CDHU. Moreover, the cities are beneited by initiatives from the federal
government such as Minha Casa Minha Vida program (housing program to stimulate low-income
irst time buyers). Despite happening in the municipalities, these programs from diferent govern-ment levels are not easily connected by voters with a speciic politician or group in governgovern-ment. An
extreme case is the capital of the state, São Paulo city, where there are federal (Minha Casa Minha
Vida), state (CDHU), and municipal (Cohab) housing programs (Marques and Rodrigues, 2013). In
TABLE 3 PANEL ANALYSIS OF ECONOMIC VOTES IN BRAZILIAN MUNICIPALITIES
Fracaovotos POLS RE FF POLS RE FF
Cresc 1.59 1.545 1.761 1.136 1.09 1.148
(0.614)*** (0.609)** (0.627)*** (0.603)* (0.600)* (0.624)*
crescuf 0.099 0.105 -0.016 0.08 0.086 -0.058
(0.029)*** (0.029)*** (0.034) (0.029)*** (0.029)*** (0.034)*
crescbr 3.842 3.881 4.546 3.857 3.927 2.278
(0.078)*** (0.077)*** (0.085)*** (0.076)*** (0.201)*** (0.593)***
lpibreal -0.469 -0.459 -0.157 -0.487 -0.478 -0.186
(0.070)*** (0.069)*** (0.095) (0.069)*** (0.069)*** (0.095)*
Lpibuf -1.818 -1.854 40.269 -1.946 -1.992 44.867
(0.105)*** (0.106)*** (2.670)*** (0.105)*** (0.105)*** (2.691)***
lpibbrasil -1.617 -3.321 -77.35 -- 4.128 -56.683
-1.535 (1.541)** (3.628)*** -- (0.133)*** (5.666)***
prefeitobase 1.455 1.547 2.091 0.649 0.75 1.289
(0.199)*** (0.200)*** (0.227)*** (0.213)*** (0.213)*** (0.241)***
persaude 0.05 0.051 -0.035 0.121 0.121 0.044
(0.013)*** (0.013)*** (0.017)** (0.021)*** (0.020)*** (0.025)*
Lpop 0.469 0.328 -4.13 -0.206 -0.451 -6.037
(0.278)* (0.277) (1.312)*** (0.287) (0.285) (1.358)***
Leec 6.557 6.067 1.222 6.843 6.405 1.543
(0.540)*** (0.541)*** (0.511)** (0.614)*** (0.623)*** (0.544)***
Lheu 0.306 0.228 -0.579 0.373 0.305 -0.416
(0.108)*** (0.109)** (0.157)*** (0.110)*** (0.111)*** (0.155)***
Lses 0.163 -0.074 -1.803 0.988 0.827 -0.269
(0.290) (0.287) (0.352)*** (0.335)*** (0.329)** (0.353)
laseps 0.504 0.475 0.363 0.464 0.439 0.326
(0.147)*** (0.147)*** (0.207)* (0.151)*** (0.152)*** (0.208)
ldesporc -9.542 -8.484 5.756 -9.954 -8.91 7.717
(0.761)*** (0.767)*** (1.005)*** (0.867)*** (0.882)*** (1.179)***
ldespcor -0.905 -1.735 -4.685 -1.228 -2.139 -5.334
Fracaovotos POLS RE FF POLS RE FF
linvest 2.219 2.202 1.906 2.005 1.977 1.43
(0.140)*** (0.139)*** (0.160)*** (0.143)*** (0.142)*** (0.168)***
ldespes -1.69 -0.875 2.182 -1.133 -0.233 3.304
(0.538)*** (0.541) (0.763)*** (0.565)** (0.577) (0.911)***
municipal 1.797 1.235 -1.093
(0.451)*** (0.451)*** (0.369)***
a2000 4.937 5.444 9.412
(0.812)*** (0.802)*** (0.611)***
a2002 5.749 3.355 -5.477
(1.297)*** (1.308)** (2.739)**
a2004 -2.632 -1.944
--(0.551)*** (0.545)***
--_cons 27.542 17.815 -138.809 115.832 -- 446.511
2.902*** 2.960*** 12.655*** (3.687)*** -- (140.218)***
N 26352 26352 26352 26352 26352 26352
Municipalities 5549 5549 5549 5549 5549
r2 0.120 0.210 0.330 0.370
Breusch-Pagan’s test: χ2 = 107.15 probability > χ2 = 0.0000
Hausman’s specification test: χ2 = 897.68, probability > χ2 = 0.0000.
Note: signiicance: *< 0,1 / **< 0,05 / *** <0,01
Source: Elaborated by the authors.
In the case that the mayor’s party participates in the political coalition ruling at the federal govern-ment, there is positive and statistically signiicance in all models, suggesting that this kind of alliance brings relevant impact on the elections. his is an extremely interesting result given that, despite the importance of involuntary transfers in the municipal budget, which are automatic and unrelated to political relations, electoral proximity is, at least potentially, more relevant between the president and the mayor. In this sense, despite the fact that the economic growth variable is local, it cannot be denied that there is an identiication with the president and a recognition of the federal government’s responsibility in growth policies.
5.2 RESULTS OF MULTILEVEL ANALYSIS
he model chosen to perform the multilevel modeling includes all variables of the models presented in the irst three columns of table 3, since the variables included in columns (4), (5) and (6) — mu-nicipal (indicator of the type of election) and years — area analyzed at diferent levels. In addition,
for parsimony, it is assumed that only the coeicient of interest (cresc) is random, in addition to the
intercept. All others are modeled as ixed coeicients. Six models are proposed, each with a diferent type of level.
he irst level analyzed is composed of the 10 groups of the economic growth band, formed from
the division of the distribution of the variable cresc in 10 distinct deciles in each year. hat is, the size
of economic growth was separated into 10 distinct groups in each election year.
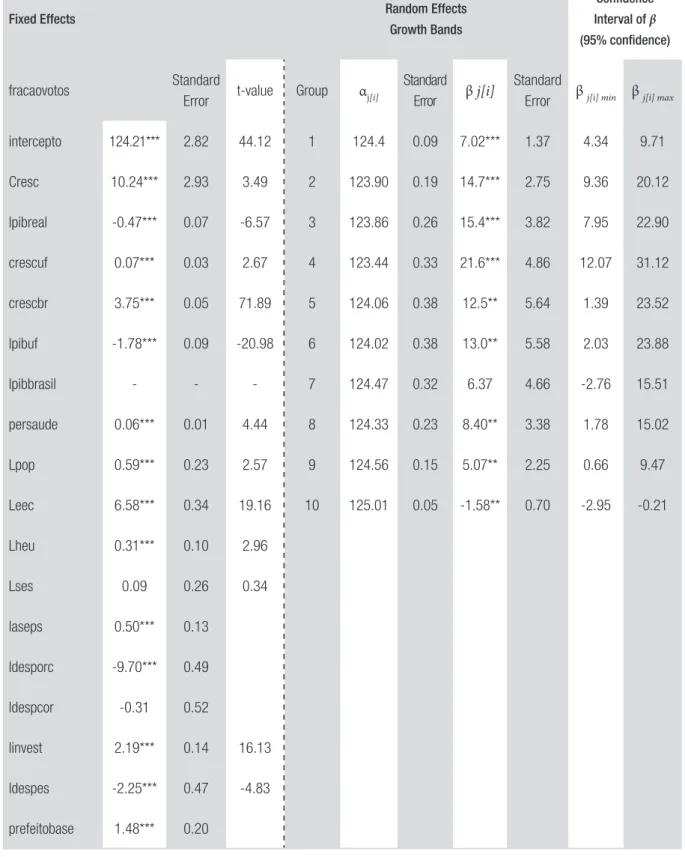
he results are presented in table 4 and in graph 1, where the variation of βj [i] is shown with its respective conidence interval over the 10 groups sorted in ascending order. In table 4, the let side shows the result of the ixed coeicients and the right side the random coeicients. Fixed coeicients corroborate the previous analysis, showing a positive and signiicant efect of local
economic growth (cresc), alliance between mayor and president (prefeitobase) and some of the
expenses, while inding negative and signiicant efect of municipal GDP size and positive efect of population. he right side of table 4 shows the random coeicients for both the intercept and
the efect of economic growth.9
Graph 1 presents the results demonstrating more clearly the information found in the estimation
of the random coeicients.10 his graph indicates the existence of an inverted U-shaped relationship
between the efect of economic growth on incumbent voting and growth bands.
Hence, a probable non-linearity of the efects of the economy on the proportion of votes obtained by the incumbent, as anticipated in the previous section, is pointed out, which shows the importance of the use of methodologies sensitive to the identiication of heterogeneous efects. here is an in-tensiication of the growth efect that peaks in the fourth decile, gradually losing strength. hus, the bands that are in the irst and last deciles, presented a smaller achievement of the economic growth on the incumbent’s vote, becoming negative in the 10th decile. Moreover, with the exception of the negative coeicients of the 10th decile, almost all others are positive and statistically diferent from zero, which corroborates the previous analysis and expose potential heterogeneities of the efects not
speciied in the literature on economic voting.11
9 In this model, the independent variable real national GDP was eliminated because there is not enough freedom to assure the
estimator convergence. he same happened with the model with deciles of real GDP (graph 2 — Income Band), when the national macroeconomic variables (economic growth and real national GDP) were eliminated. In the other multilevel models, all variables listed in table 4 were used.
10 Large part of the multilevel analysis repeated the indings of the previous section, therefore, we are not discussing in the next paragraphs
the information related to the ixed coeicient estimations. We will only analyze graphically the variation of the random coeicients of growth. In case the reader is interested in checking the details of the multilevel analysis, the indings on ixed and random efects of each one of the models estimated in the research are available in the appendix.
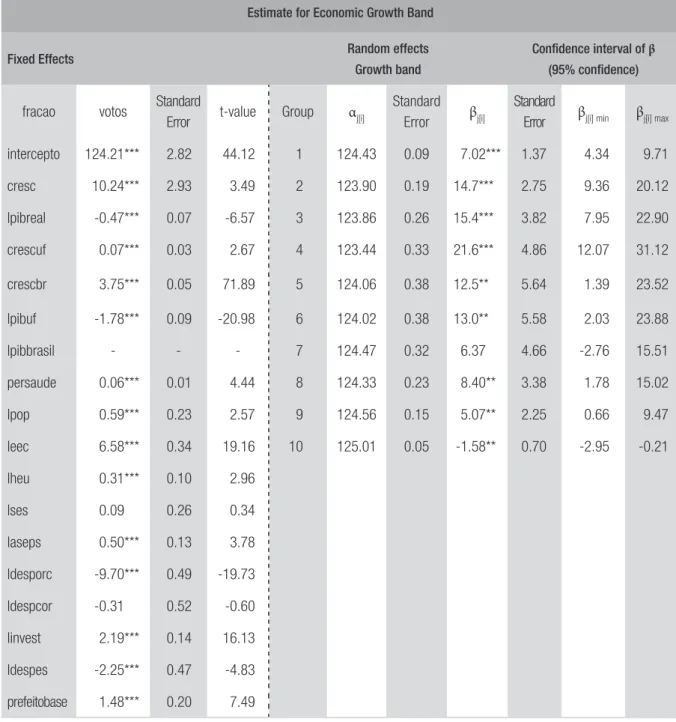
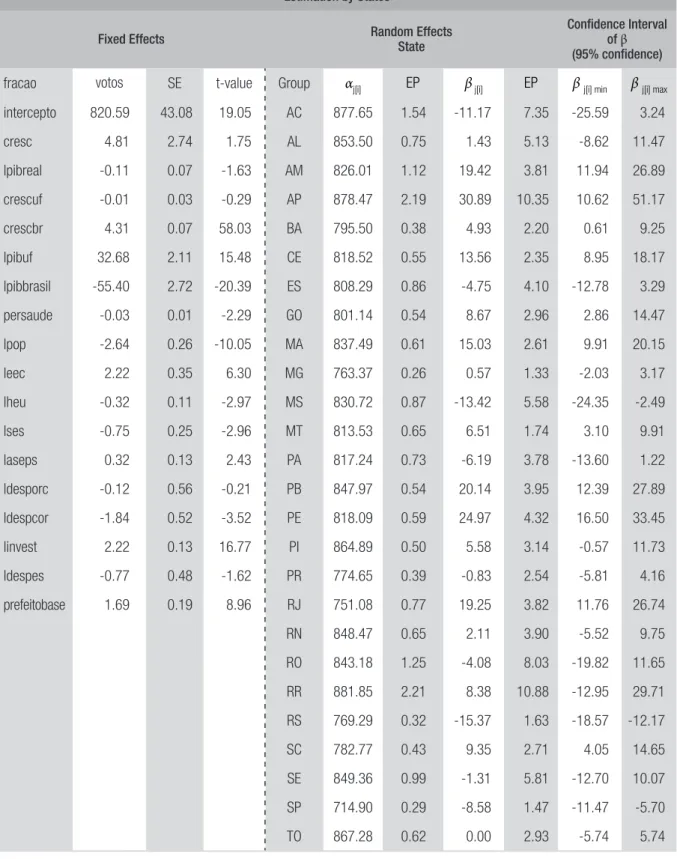
TABLE 4 ESTIMATION BY ECONOMIC GROWTH BANDS
Fixed Effects Random Effects
Growth Bands
Conidence Interval of β (95% conidence)
fracaovotos Standard
Error t-value Group αj[i]
Standard Error β j[i]
Standard
Error βj[i] min βj[i] max
intercepto 124.21*** 2.82 44.12 1 124.4 0.09 7.02*** 1.37 4.34 9.71
Cresc 10.24*** 2.93 3.49 2 123.90 0.19 14.7*** 2.75 9.36 20.12
lpibreal -0.47*** 0.07 -6.57 3 123.86 0.26 15.4*** 3.82 7.95 22.90
crescuf 0.07*** 0.03 2.67 4 123.44 0.33 21.6*** 4.86 12.07 31.12
crescbr 3.75*** 0.05 71.89 5 124.06 0.38 12.5** 5.64 1.39 23.52
lpibuf -1.78*** 0.09 -20.98 6 124.02 0.38 13.0** 5.58 2.03 23.88
lpibbrasil - - - 7 124.47 0.32 6.37 4.66 -2.76 15.51
persaude 0.06*** 0.01 4.44 8 124.33 0.23 8.40** 3.38 1.78 15.02
Lpop 0.59*** 0.23 2.57 9 124.56 0.15 5.07** 2.25 0.66 9.47
Leec 6.58*** 0.34 19.16 10 125.01 0.05 -1.58** 0.70 -2.95 -0.21
Lheu 0.31*** 0.10 2.96
Lses 0.09 0.26 0.34
laseps 0.50*** 0.13
ldesporc -9.70*** 0.49
ldespcor -0.31 0.52
linvest 2.19*** 0.14 16.13
ldespes -2.25*** 0.47 -4.83
prefeitobase 1.48*** 0.20
Source: Elaborated by the authors.
GRAPH 1 CI OF GROWTH EFFECT(βJ[I]) PER GROWTH BANDS (95%)
Growth Deciles
Estimated Random effects
Source: Elaborated by the authors.
Graph 2 presents the results when the municipalities are divided into ten groups, according
to the deciles of the distribution of the logarithm of municipal real GDP, (lpibreal), in each year.
Estimates indicate that there is a negative relationship between the size of the random growth
efect and the logarithm of real GDP,12 as the efect on the expected voting continuously decreases
as one moves to a decile of higher real GDP. hat is, the efect of growth on incumbent voting is greater in municipalities with smaller economy. hat said, the larger the municipality — which is the case of large metropolises and capital cities in Brazil — the smaller the efect of the economy on the choice of vote. In addition, from the 7th decile there is a reversal of the efects, and eco-nomic growth negatively afects the number of votes for the incumbent, a result that needs more research to be clariied. One possible explanation is that accelerated growth is usually accompa-nied by widening inequality, in a process known in regional economics literature as Williamson’s curve (1965) and when applied on people’s individual income, known as Kuznets’s (1955) curve. hus, the negative efect may be due to the growth of inequality, a point that deserves further empirical investigation.
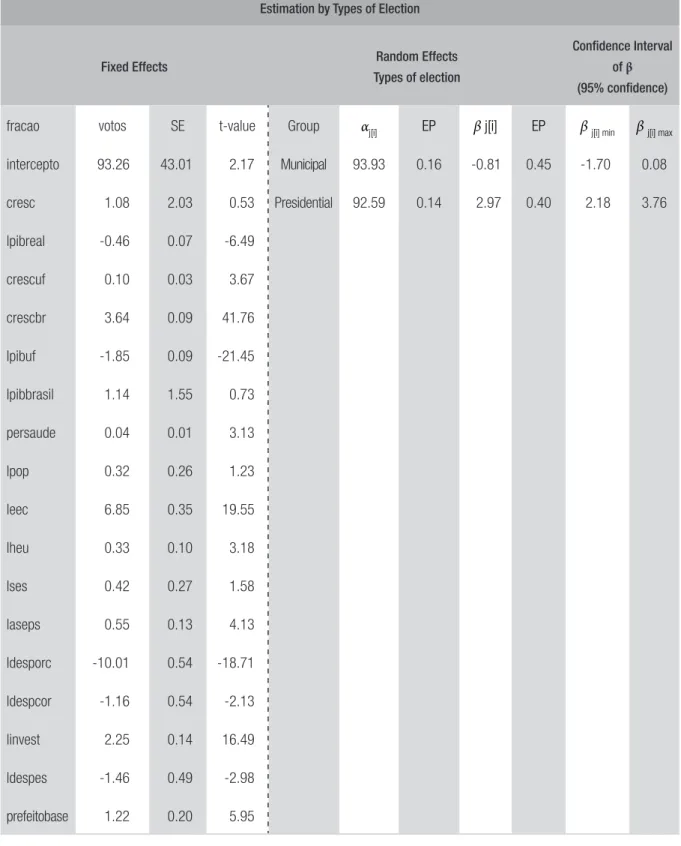
he third level is an exercise to check which election is more afected by the economic vote. At
this level, analysis discovers whether the slope of βj[i] is diferent in presidential and municipal
elec-tions, that is, whether there is greater sensitivity to the efects of the economy on incumbent voting. he previous section found that incumbent mayor candidates on average tend to have fewer votes
than incumbent president candidates. In the ixed-efect model13 there is information showing that
12 he ixed coeicient results are presented in the appendix.
incumbent candidates in municipalities have on average 1.1 percentage points less than president candidates. In this exercise, it is identiied whether there is a diference in how the economy afects policy for incumbent candidates running for mayor or the presidency.
GRAPH 2 CI OF GROWTH EFFECT (βJ[I]) PER INCOME BAND (95%)
Deciles of the municipal GDP´s size
Estimated Random effects
Source: Elaborated by the authors.
In graph 3 it is clear that the slope coeicient is substantially larger in the presidential elections, given the huge diference between the respective conidence intervals. he economic vote seems to be much more important in the presidential elections, which indicates a greater degree of responsibility attributed by voters to the president than to the mayors. he efect found in the municipal elections has negative but insigniicant coeicient.
GRAPH 3 CI OF GROWTH EFFECT(βJ[I]) PER ELECTION TYPE (95%)
Type of Election
Estimated Random effects
Municipal Presidential
Source: Elaborated by the authors.
GRAPH 4 CI OF GROWTH EFFECT(βJ[I]) PER ELECTORAL YEAR (95%)
Electoral years
Estimated Random effects
In the ith level, we analyze the model with the inclusion of the level incumbent candidates’ political parties. As the sample has 26 parties that presented incumbent candidates, graph 5 presents
only the conidence intervals of the estimated βj[i], aiming for clearer exposure. he horizontal axis
is ordered in a crescent in order to provide a clear view of which parties are more eicient at turning economic growth into votes.
GRAPH 5 CI OF GROWTH EFFECT (βJ[I]) PER POLITICAL PARTY (95%)
Political Parties
Estimated Random effects
PP PDT PTB
DEM PSB PTC PC do B PSDB
PTN PV PSD PMDB PST
PR
PSDC PSC
PT do B
PRB PL PPS PHS PRP PRTB PMN PSL PT
Source: Elaborated by the authors.
In graph 5 it is clear that the parties that present the least relevance are PP and PDT, but their conidence intervals are large, which makes the results meaningless. he most accurate indings are the results of PSDB and PT. he efect of economic growth is apparently zero for PSDB, since the estimated value is very close to zero. On the other hand, PT has a consistently positive efect of growth on the incumbent’s vote. Moreover, there seems to be no clear ideological ordering of these efects, since we ind let-wing parties with negative and positive efects (PDT and PT, respec-tively). On the other hand, the big parties in the center and Brazilian right wing do not indicate that they are eicient in transforming economic growth into votes, since they are concentrated in the negative part (or very close to zero efect) of the graph. he parties winning the economic vote are, in addition to PT itself, the small parties with a tendency towards systematic political adhesion in coalitions.
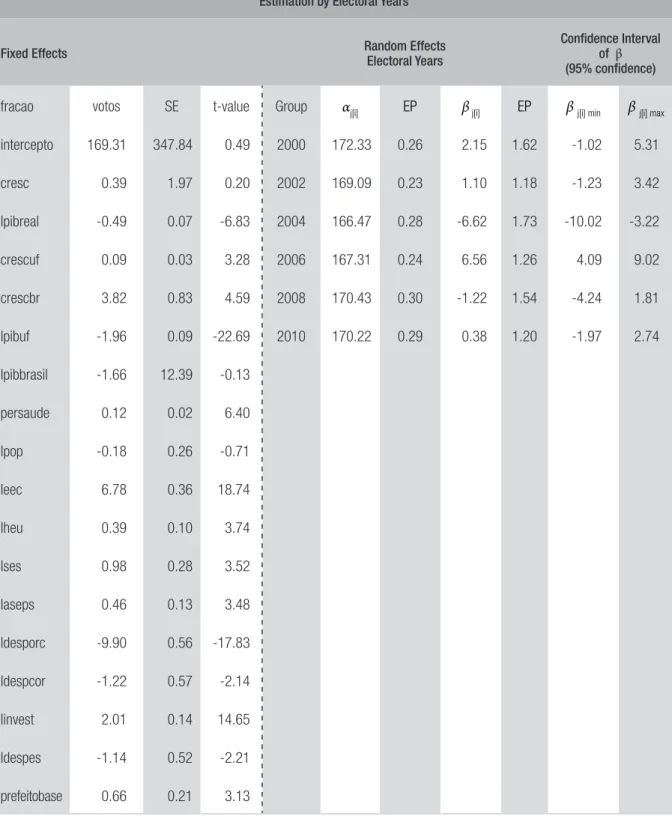
with the greatest impact of the economic vote are Pernambuco and Amapá, and those with the lowest impact are Rio Grande do Sul and Mato Grosso do Sul. he horizontal axis is presented in a crescent order, according to the degree of electoral “economism” observed in the elections of 2000 to 2010 in each state. On one hand, in Rio Grande do Sul and São Paulo, states with very diversiied economy, the efect of local economic growth is smaller, negative and signiicant, while the estimated efect for Paraná is negative, but not diferent from zero. In Minas Gerais, the estimated efect was positive, but not signiicant. Of the ive largest Brazilian states, only Rio de Janeiro presented a positive, relevant
and signiicant coeicient of economic vote.14
In regions with greater economic complexity, the limits of economic expansion tend to exceed municipal boundaries, weakening its efect. Other issues may be connected, such as environmental conditions and unplanned growth, which may explain this result. However, further studies are needed. he states that have positive and signiicant efects are Mato Grosso, Goiás, Santa Catarina, Ceará, Maranhão, Rio de Janeiro, Amazonas, Paraíba, Pernambuco and Amapá.
GRAPH 6 CI (βJ[I]) OF GROWTH EFFECT PER FEDERAL UNIT (95%)
RS MS AC SP PA ES RO SE PR TO MG AL RN BA PI MT RR GO SC CE MA RJ AM PB PE AP
60
50
40
30
20
10
0
-10
-20
-30
Federation Units
Estima
ted Randon Effects
Source: Elaborated by the authors.
he results in multilevel models clearly show the need for studies seeking to better understand the factors associated with the efects of economic growth on incumbent voting. Programmatic
is-14 Such diferentiation can be explained by the peculiarity of Rio de Janeiro’s economy, centered on the oil industry and federal
sues, the complexity of the regional economy, the absence of regional governments, for example, are some of the factors that require further investigation. herefore, studies that use models centered on averages tend to lose the diversity present in the dynamics of the economic vote, a diverse that is captured when using lexible models such as the multilevel approach. Future research should deepen the analysis of the existing heterogeneity of the economic vote in Brazil.
6. CONCLUSION
he objective of this study was to verify the impact of local economic growth on the percentage of votes obtained by the incumbent in a sample of the Brazilian municipalities using econometric techniques for panel and multilevel data in presidential and municipal elections from 2000 to 2010. In order to measure local economic growth, the real GDP growth rate was used. In addition, other variables of interest related to relations between mayors and presidents, demographics, iscal, timing and macro-economic variables that measure GDP and macro-economic growth in other geographic circumscriptions of the nation (states and union) were also analyzed.
he main results conirm evidence that there is a strong relationship between local economic growth and the vote obtained by the incumbent in all panel estimated models. In addition, munic-ipal spending on health, education and culture, in addition to the volume of investments, were also positively associated with a greater proportion of incumbent votes. Another important inding was that the connection between the political parties of mayors and presidents has a positive efect on incumbent performance.
Moreover, in panel models strong evidence suggested that municipalities with greater economic potential and larger population tend to be less likely to vote for the government, since the variable that measured the wealth of the municipality was negatively associated with the votes obtained by the incumbent. Even in the multilevel models, the efect of the wealth of the municipality was always negatively associated with the vote of the incumbent, repeating this pattern in the multilevel models
with groups, being the deciles the income bands and the federal units.15 Evidence has also been found
showing a greater responsiveness to the efects of the economy on the voting of incumbent candidates in the federal executive power than in the local executive branch.
he research has provided evidence favorable to the hypothesis of the economic vote in the Brazilian presidential and municipal elections, indicating a positive and signiicant impact between local economic growth and the vote obtained by the incumbent. Obviously, the methodology ad-opted does not allow an interpretation in terms of causality. However, it is clear that the hypothesis of the economic vote cannot be rejected. In view of the positive impact found, new questions arise opening perspectives for research. For example, in the face of the positive relationship of economic growth, it is important to investigate the nature of this expansion of local wealth. Would growth with more equality generate greater returns than expansion worsening economic inequality in the municipality?
REFERENCES
ANDERSON, Cameron. D.; MORGAN, J. Economic
voting and incumbent mayoral elections in Canada: 1997:2010. In: ANNUAL METTING OF THE CA-NADIAN POLITICAL SCIENCE ASSOCIATION, Wilfrid Laurier University, 2011, Waterloo.
ANDERSON, Christopher J. Blaming the
govern-ment: citizens and the economy in ive European
democracies. Armonk, New York: M. E. Sharp, 1995.
ANDERSON, Christopher J. he end of economic voting? Contingency dilemmas and the limits of
democratic accountability. Annu. Rev. Polit. Sci.,
v. 10, p. 271-296, 2007.
ANSOLABEHERE, Stephen; MEREDITH, Marc; SNOWBERG, Erik. Mecro economic voting: local information and micro perceptions of the macro‐
economy. Economics & Politics, v. 26, n. 3, p.
380-410, 2014.
BERELSON, Bernard R.; LAZARSFELD, Paul F.;
MCPHEE, William N. Voting: a study of opinion
formation in a presidential campaign. Chicago: University of Chicago Press, 1954.
BRENDER, Adi. he efect of iscal performance on local government election results in Israel:
1989-1998. Journal of Public Economics, v. 87, n. 9-10,
p. 2187-2205, 2003.
CAMPBELL, Angus et al. he American voter. New
York: Wiley Press, 1960.
COX, Gary W.; MCCUBBINS, Mathew D. Electoral
politics as a redistributive game. he Journal of
Poli-tics, v. 48, n. 2, p. 370-389, 1986.
DIXIT, Avinash; LONDREGAN, John. he determi-nants of success of special interests in redistributive
politics. he Journal of Politics, v. 58, n. 4, p.
1132-1155, 1996.
DORUSSEN, Han; TAYLOR, Michaell. Economic
voting. London: Routledge, 2002
DOWNS, Anthony. An economic theory of
democra-cy. New York: Harper, 1957.
DRAZEN, Allan; ESLAVA, Marcela. Electoral ma-nipulation via voter-friendly spending: theory and
evidence. Journal of Development Economics, v. 92,
n. 1, p. 39-52, 2010.
DUCH, Raymond M.; STEVENSON, Randolph T.
he economic vote. New York: Cambridge University Press, 2008.
ELINDER, Mikael. Local economies and general elections: the inluence of municipal and regional economic conditions on voting in Sweden 1985–
2002. European Journal of Political Economy, v. 26,
n. 2, p. 279-292, 2010.
FAIR, Ray C. he efect of economic events on votes
for president: 1992 update. Political Behavior, v. 18,
n. 2, p. 119-139, 1996a.
FAIR, Ray C. Econometrics and presidential
elec-tions. Journal of Economic Perspectives, v. 10, n. 3,
p. 89-102, 1996.
FAIR, Ray C. he efect of economic events on votes
for president. Review of Economics and Statistics,
v. 60, n. 2, p. 159-173, 1978.
FERNANDES, Ivan F.; FERNANDES, Gustavo A. Economic voting at Brazilians elections: when local power plays the most important role. In: ANNU-AL METTING OF THE MIDWEST POLITICANNU-AL SCIENCE ASSOCIATION CONFERENCE, 2014, Chicago.
FIGUEIREDO, Argelina C. Government coalitions
in Brazilian democracy. Brazilian Political Science
Review, v. 1, n. 2, p. 182-216, 2007.
FIORINA, Morris P. Retrospective voting in
Ameri-can national elections. New Heaven: Yale University Press, 1981.
GELMAN, Andrew; HILL, Jennifer. Data analysis
using regression and multilevel/hierarchical models.
New York: Cambridge University Press, 2007.
GOODHART, Charles A. E.; BHANSALI, Rajendra
J. Political economy. Political Studies, v. 18, n. 1,
p. 43-106. 1970.
HAUSMAN, Jerry A. Speciication tests in
econome-trics. Econometrica, v. 46, n. 6, p. 1251-1271, 1978.
HSIAO, Cheng. Analysis of panel data. Cambridge:
Cambridge University Press, 1986.
HUNTER, Wendy; POWER, Timothy J. Rewarding Lula: Executive Power, social policy and the Brazilian
elections of 2006. Latin American Politics & Society,
JORDAHL, Henrik. An economic analysis of voting
in Sweden. Public Choice, v. 127, n. 3-4, p. 251-265,
2006.
KEY, Valdimer Orlando. Parties, politics and pressure
groups. New York: Crowell, 1964.
KEY, Valdimer Orlando. he responsible electorate.
New York: Belknap Press of Harvard University Press, 1966.
KINDER, Donald R.; KIEWIET, D. Roderick.
Socio-tropic politics: the American case. BritishJournal of
Political Science, v. 11, n. 2, p. 129-161, 1981.
KRAMER, Gerald H. Short-term luctuations in
U.S. voting behavior, 1896-1964. American Political
Science Review, v. 65, n. 1, p. 131-143, 1971.
KUZNETS, Simon. Economic growth and income
inequality. he American Economic Review, v. 45,
n. 1, p. 1-28, 1955.
LAZARSFELD, Paul F.; BERELSON, Bernard R.;
GAUDET, Hazel. he people’s choice: how the voter
makes up in a presidential campaign. New York:
Columbia University Press, 1944.
LEVITT, Steven D.; SNYDER JR., James M. he impact of federal spending on House election
ou-tcomes. he Journal of Political Economy, v. 105,
n. 1, p. 30-53, 1997.
LEWIS-BECK, Michael S.; PALDAM, Martin.
Eco-nomic voting: an introduction. Electoral Studies,
v. 19, n. 2, p. 113-121, 2000.
LEWIS-BECK, Michael S.; STEGMAIER, Mary.
Eco-nomic determinants of electoral outcomes. Annual
Review of Political Science, v. 3, n. 1, p. 183-219, 2000.
LINDBECK, Assar; WEIBULL, Jörgen W. A mo-del of political equilibrium in a representative
democracy. Journal of Public Economics, v. 51, n. 2,
p. 195-209, 1993.
MARQUES, Eduardo; RODRIGUES, Leandro. O Programa Minha Casa Minha Vida na metrópole paulistana: atendimento habitacional e padrões de
segregação. Revista Brasileira de Estudos Urbanos e
Regionais, v. 15, n. 2, p. 159-177, 2013.
MARTINS, Rodrigo; VEIGA, Francisco J. Does voter turnout afect the votes for the incumbent
govern-ment? European Journal of Political Economy, v. 36,
p. 274-286, 2014.
MUELLER, John E. Presidential popularity from
Truman to Johnson. American Political Science
Re-view, v. 64, n. 1, p. 18-34, 1970.
NANNESTAD, Peter; PALDAM, Martin. he VP-function: a survey of the literature on vote and
popularity functions ater 25 years. Public Choice,
v. 79, n. 3-4, p. 213-245, 1994.
NIE, Norman H.; VERBA, Sidney; PETROCIK, John R. he changing American voter. New York: Harvard Press, 1976.
OLIVER, J. Eric; HA, Shang E. Vote choice in
su-burban elections. American Political Science Review,
v. 101, n. 3, p. 393-408, 2007.
PALDAM, Martin. How robust is the vote function? A study of seventeen nations over four decades. In: NORPOTH, Helmut; LEWIS-BECK, Michael S.;
LAFAY, Jean-Dominique. Economics and politics:
the calculus of support.Ann Arbor: he University
of Michigan Press,1991. cap. 1, p. 9-31.
PATTIE, Charles; JOHNSTON, Ron. A low turnout landslide: abstention at the British general election
of 1997. Political Studies, v. 49, n. 2, p. 286-305, 2001.
POWELL JR., G. Bingham; WHITTEN, Guy D. A cross-national analysis of economic voting: taking
account of the political context. American Journal of
Political Science, v. 37, n. 2, p. 391-414, 1993.
SAKURAI, Sergio N.; MENEZES-FILHO, Naercio A. Fiscal policy and reelection in Brazilian
munici-palities. Public Choice, v. 137, n. 1, p. 301-314, 2008.
SAMUELS, David. Presidentialism and accoun-tability for the economy in comparative perspec-tive. American Political Science Review, v. 98, n. 3, p. 425-436, 2004.
SINGER, André. As raízes sociais do lulismo.
Cader-no de Novos Estudos — Cebrap, n. 85, p. 83-102, 2009.
STIGLER, George J. General economic conditions
and national elections. American Economic Review,
v. 63, n. 2, p. 160-167, 1973.
TUCKER, Joshua Aaron et al. Regional economic
voting: Russia, Poland, Hungary, Slovakia, and the Czech Republic, 1990-1999. Cambridge: Cambridge University Press, 2006.
VAN DER BRUG, Wouter; VAN DER EIJK, Cees;