R&D, STRUCTURAL CHANGE AND PRODUCTIVITY:
THE ROLE OF HIGH AND MEDIUM-HIGH
TECHNOLOGY INDUSTRIES
Celeste Amorim Varum* Bruno Cibrão† António Morgado‡
Joana Costa§
Resumo
Este artigo investiga o potencial impacto do aumento de I&D e de mu-danças estruturais na produtividade do trabalho em Portugal. Com base na literatura sobre a relação entre despesas em I&D, mudança estrutural e produtividade, avaliamos a contribuição da I&D e das indústrias de alta tecnologia neste cenário durante os últimos 30 anos. Os resultados obti-dos confirmam a importância obti-dos investimentos em I&D das empresas de indústrias de alta e média-alta tecnologia e I&D público no crescimento da produtividade. Não obstante, não podemos afirmar que este fenômeno tenha como esteio principal o crescente relevo destas indústrias.
Palavras-chave:I&D, Mudança Estrutural, Produtividade.
Abstract
This paper investigates the potential impact of increased R&D efforts
and structural change in Portugal on labour productivity. Based on ex-isting literature on the relation between R&D expenditures, structural change and productivity, we evaluate the contribution of R&D and high-tech industries to productivity over the last 30 years. Our results confirm the importance of business R&D in the medium to high-tech sectors and of public R&D, as they stimulate productivity growth. However, we can-not support the hypothosis that productivity growth was primarily rooted in the development of medium-high technology industries.
Keywords:R&D, Structural Change, Productivity
JEL classification:O30, O40
*
Department of Economics, Management and Industrial Engineering, University of Aveiro. Ad-dress: Universidade de Aveiro, DEGEI, 3810-193 Aveiro, Portugal. Email: [email protected] †[email protected]
1
Introduction
The economic competitiveness of economies may be broadly analysed on the basis of a set of indicators, that is, production performance, productivity, in-novation and international trade performance. Recent data on these indica-tors has given rise to serious concerns over the comparative performance of Portugal (and even Europe1) over the last 15 years or so.
The data for Portugal reveal that after the high-growth “new-economy” years of the second half of the last decade, growth has been considerably be-low the average of the European Union (EU hereafter)2. By 2005, Portuguese
GDP per capita and real GDP per hour worked amounted to just 75 and 68 percent of the EU average respectively. Increasing productivity emerged as the main economic challenge for Europe and for Portugal in particular.
Conscious of the gap, and in line with the European directives, in 2005 Portugal launched the Technological Plan with the goal of fostering growth and competitiveness. The overall goal has been embedded in a set of policy guidelines that include the following axes:
1. Knowledge – To qualify the Portuguese as a knowledge society, fostering structural measures which aim at enhancing the average qualification level of the population, implementing a broad and diversified lifelong learning system and mobilizing the Portuguese to be an Information So-ciety;
2. Technology – To overcome the scientific and technological gap, reinforc-ing public and private scientific and technological competencies and recognizing the role played by enterprises in the process of the creation of qualified jobs and Research & Development (R&D) related activities;
3. Innovation – To boost Innovation, helping the production chain to adapt to the challenges of Globalization by means of the diffusion and
devel-opment of new procedures, organizational systems, services and goods.
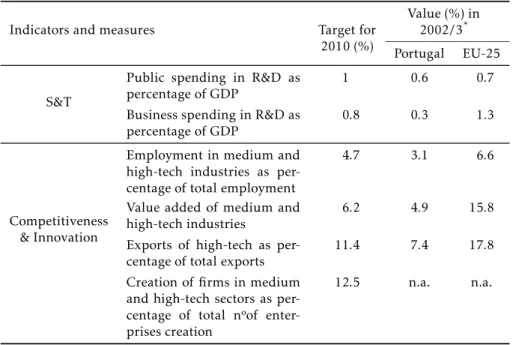
Within the specific objectives and targets, the attention diverted towards the need to increase the value added per employee, and thus to reducing the gap with the EU, is notable. The increase of public and business R&D is also a priority and a specific objective of the plan. Medium and high-tech industries deserve particular emphasis in the Technological Plan. The data from the year base and of the Portuguese targets related to R&D and industrial structural change are reflected in Table1.
These aims and targets of the plan are clearly understood within a context of generalized acceptance of the nexus between innovation, structural change
1Motivating the Lisbon Strategy in 2000 and its 2005 refocus on the objectives of jobs and growth.
Table 1: Selected targets of the Portuguese Technological Plan
Indicators and measures Target for
2010 (%)
Value (%) in 2002/3* Portugal EU-25
S&T
Public spending in R&D as percentage of GDP
1 0.6 0.7
Business spending in R&D as percentage of GDP
0.8 0.3 1.3
Competitiveness & Innovation
Employment in medium and high-tech industries as per-centage of total employment
4.7 3.1 6.6
Value added of medium and high-tech industries
6.2 4.9 15.8
Exports of high-tech as per-centage of total exports
11.4 7.4 17.8
Creation of firms in medium and high-tech sectors as per-centage of total nºof enter-prises creation
12.5 n.a. n.a.
aSource: Technological Plan (2006).
*Data for S&T refers to the year 2002. Data for competitiveness refers to 2003.
and productivity. It is often argued that R&D and high-tech industries drive growth processes, and that they are the sources of growth in output, em-ployment and productivity in the knowledge economy. Following Kaloudis & Smith(2005), a broad set of hypotheses are implied in these R&D-biased explanations of growth. We highlight the following:
1. Innovation accounts for a significant part of modern economies’ growth;
2. There should be a significant correlation between shares of high-tech in total output and levels/growth rates of productivity and GDP.
Regarding the first hypotheses, the relation between R&D and produc-tivity is strongly accepted in the literature. Even still, Griliches (1995) ar-gues that the scientific and quantitative support for the relationship between the two aspects is rather limited. As for the impact of changes in industrial structure, it is widely recognized that the most technologically developed in-dustries are more productive than the remainder (Aiginger 2001). However, empirical evidence on the contribution of structural change within manufac-turing to productivity is rather scarce and far from consensual (Kaloudis & Smith 2005).
R&D and business R&D in medium to high-tech sectors. Second, an attempt is made to evaluate the impact of the increasing weight of medium to high-tech industries in manufacturing employment. The results are intended to provide insights into the following:
1. The contribution of public research to productivity growth;
2. The contribution of business R&D in high-tech sectors to productivity growth;
3. The importance of structural transformation on innovation intensive sectors to productivity growth.
The article is organized as follows. In the next section we provide the theo-retical background to analyse the relationship between R&D and productivity and then between structural change and productivity. In section 3 we point to the critical aspects of Portuguese competitiveness and present a brief charac-terization of the manufacturing industry over the period 1980-2003. We also present our empirical study. Finally section 4 derives policy implications and further research avenues.
2
Productivity, R&D and industrial structure
In this section we discuss the relationships between productivity, R&D and industrial structure. These are used to define the hypotheses to be tested in the context of the Portuguese economy.
2.1 R&D and productivity
“It is now well-known that both the governments of and private firms in most industrialised countries have devoted an increas-ing amount of resources to R&D. One of the main objectives of economic analysis is to evaluate whether the returns on this in-vestment justify the initial expenditure. To this end, the relation-ship between R&D and productivity growth has been investigated at different levels of aggregation: economy, sector, industry and
firm.” (Aiginger 2001)
The relationship between R&D and the productivity of a country is com-monly accepted in the literature. R&D resulting in new goods, new pro-cesses and new knowledge, is generally accepted as a major source of techni-cal change. As defined by theFrascati Manual(OECD 1994), R&D “comprises creative work undertaken on a systematic basis in order to increase the stock of knowledge and the use of this stock of knowledge to devise new applica-tions”.
The relationship between R&D and innovation is a complex and a non-linear one. In order to capture the links between R&D and productivity it is necessary to take several aspects into account. First, there are different types
of R&D, and the effects of R&D on productivity may work through various
R&D (e.g. changes in the organization of business related to the use of infor-mation and communication technology).
However, it is also recognized that it is difficult to incur substantial
ad-vances in technology without work undertaken on a systematic basis and R&D is a good indicator of this broader phenomenon.
There is major evidence that links R&D to productivity. In modern growth economies, it is clear that the inputs of capital and labour alone cannot ac-count for a large part of output growth (Solow 1957). In the rich empirical tradition of work on productivity growth, the total productivity growth fac-tor has been related to the accumulation of “knowledge stock”, which is not accounted for in the measurement of the conventional stock of capital, but increases output via innovation and technological change. Economic theory (Solow 1957,Romer 1990) points to technical change as the major source of productivity growth in the long run. R&D expenditures have been suggested as a way of measuring this knowledge stock, giving rise to a range of works relating R&D expenditures and productivity.
InGriliches(1979) discussed issues in assessing the contribution of R&D to productivity growth, and in 1980 he evaluated the returns of R&D expendi-tures in the private sector, using cross-sectional data from a set of companies over the period 1957-1963. The results reveal a positive correlation between R&D expenditure and the productivity achieved by the companies, which is given by a positive coefficient of the R&D of about 0.07. In a later work,
Griliches (1995) discussed the econometric results and measurement issues in the relationship between R&D and productivity. In his review, he refers to the co-existence of three alternatives to analyse the relationship: case studies, econometric studies and the statistical analysis of patents. He concludes that the economic literature placed particular emphasis on econometric studies, mainly the Cobb-Douglas production functions and the CDM3model.
Guellec & Van-Pottelsberge(2001) studied different types of R&D and
an-alyzed their long-term effects on multifactor productivity growth. Using a
sample of 16 OECD countries over the period 1980-98, they found that an increase of 1% in business R&D leads to a rise of productivity in 0.13%. The effect is larger in countries where the share of defense-related government
funding is smaller. If, on the other hand, foreign R&D increases by 1%, then productivity will rise by 0.46%. Finally, an increase of 1% in public R&D generates an increase of 0.17% in productivity growth. The effect is larger in
countries where the share of universities (as opposed to government labs) is higher and in countries where the share of defence R&D is smaller. They also concluded that the effects of R&D are higher in countries with higher business
R&D intensity.
Mairesse(2004) presents a model which quantifies the links between R&D, innovation and productivity on a panel of 4164 firms. According to his re-sults, firms with a 20% share of innovative sales would be 15% more pro-ductive than firms with just 5% in innovative sales. In the same vein, the productivity of a firm that has filed two European patents would be nearly 10% higher than that of a firm having filed a single patent.
Like Mairesse,Wieser(2001) investigated the contribution of R&D to pro-ductivity performance at the micro level. Wieser’s study presents a review of the literature which demonstrates a significant impact of R&D on firm
formance, but reveals that the extent of the impact differs widely. Based on
his own empirical work for a sample of 2167 large, publicly traded firms in Europe and the US, he also confirms the positive and significant contribution of R&D to productivity growth, once that his results point to a private rate of return on R&D of about 12%.
These papers also discuss the fact that the impact of R&D on the economy goes well beyond the direct private returns to the innovator or to the industry where it occurs. Indeed, early work on R&D concentrated only on the returns to firms and industries. However, more recently, spurred by comments in
Griliches(1979,1992), attention shifted towards spillovers effects. Since then
a number of empirical studies demonstrate the existence of positive spillovers, identifying a private return as well as a social return from privately funded R&D investment.Fraumeni & Okubo(2005) as well asSveikauskas(2007) re-view the literature on R&D and productivity growth, showing that the overall rate of return to R&D is very large – about 25% for private return and 65% for social return. These two articles selected nine studies to determine the rate of return on privately funded R&D.
Most studies suggest that the private return from R&D represents only a third of the social return from R&D4. Therefore,Wieser(2001) asserts that the
incentives for the private sector to invest in R&D do not properly reflect the value that society receives from that research5. This is one argument for the
participation of government in national R&D activities. Hence, the greater the divergence between the private and social returns of R&D, the stronger is the argument for the involvement of government in these activities (Wieser 2001).
Government and university research has direct effect on scientific
knowl-edge and public missions, once it generates basic knowlknowl-edge (Adams 1990,
Brooks 1994). In many cases, the effect of government research on
produc-tivity is not measured, either because it is indirect or because its results are not integrated into existing measures of GDP (Health-related research allows improving the length and quality of life, which are not taken into account in GDP measures). Basic research, performed mainly by universities, enhances the stock of knowledge of the society. New knowledge is not considered as an output in the current system of national accounts (contrary to physical invest-ment and software, for instance), and as such it is not included in GDP mea-sures, hence the direct outcome of basic research is overlooked. However, ba-sic research may open new opportunities for business research, which in turn affects productivity (Adams 1990,Brooks 1994,Guellec & Van-Pottelsberge
2001).
It is therefore not surprising that there have been very few studies on the effects of public research on productivity. Only some components of
pub-lic research have been used in empirical frameworks. For instance, Adams
(1990) finds that fundamental stocks of knowledge, proxied by accumulated academic scientific papers, significantly contributed to productivity growth in US manufacturing industries. Another example is provided by Poole & Bernard(1992) for military innovations in Canada, who present evidence that
4In most of these studies, “private” returns reflect industry returns, not the traditional re-turns to firms. Sveikauskas (2007) discusses how the different studies addressed this issue.
a defense-related stock of innovation has a negative and significant effect on
the total productivity growth factor of four industries over the period 1961-85.
As seen previously, the idea that innovation stimulated by R&D expendi-ture makes an important contribution to productivity growth has been demon-strated by several authors. However, the relationship between innovative ac-tivities, innovation itself and productivity is rather complex and far from con-sensual. In fact, other authors suggest the existence of a negative correlation between innovation and productivity in the short runYoung(1991),Utterback
(1994),Jovanovic & Nuarko (1996),Christensen (1997),Ahn (1999),Bessen
(2002).
Due to the rapid progress in the number and quality of studies focused on the relation between R&D and productivity, our knowledge concerning these issues has seriously improved in the last two decades. Nevertheless, it remains rather modest because of the substantial difficulties in measurement
and in the statistical inference of causal relationships from non-experimental data (Mairesse 2004).
2.2 Structural change and productivity
The relationship between the economic structure of a country and its produc-tivity growth has received more attention in recent decades.Salter(1960) was the first to emphasize the importance that a structural change (modifications in the sectoral localization of labour, or possibly in the production factors in general) can have in boosting productivity.
Since then, several authors have studied the relocation of inputs in the manufacturing industry, because although there is no doubt as to the produc-tivity gains resultant from the shift of inputs from agriculture to manufac-turing (Syrquin 1988), the consequences of movements that occur inside the manufacturing industry are not very clear (Rocha 2005).
WhileSalter(1960) presents significantly strong results about the benefits of structural changes in the UK economy between 1924 and 1950, more recent studies (Fagerberg 2000,Timmer & Szirmai 2000,Carree 2002,Kiliçaslan & Taymaz 2004,Singh 2004) as we shall see below show more limited results. Some studies present a negligible or even a negative contribution of struc-tural change to productivity growth (Singh 2004,Kiliçaslan & Taymaz 2004,
Kaloudis & Smith 2005).
Fagerberg (2000) focused on the impact of specialization and structural changes on productivity growth in manufacturing, using a sample of 39 coun-tries and 24 induscoun-tries over the period 1973-1990. The results reported in his study indicate that structural change still matters, but in a different way
experienced higher productivity growth in their manufacturing sectors than other countries, due to important spill-over effects.
Similar evidence to that of Fagerberg (2000) is presented by Timmer & Szirmai(2000), but in this case on four Asian countries6and 13 subsectors of
the manufacturing industry over the period 1963-1993.
Adding toFagerberg(2000),Carree(2002) seeks to complement the anal-ysis by estimating the impact of the employment share of technologically pro-gressive industries using a different methodology. Fagerberg claims that an
in-crease in the “electronics” industry in total employment will generate higher productivity growth in the manufacturing sector. However, the size of the im-pact, and as a consequence the extent of spillover, is found to be much smaller than estimated by Fagerberg.
The relationship between structural changes and productivity growth in the manufacturing sector is also investigated bySingh(2004) in his study on South Korea over the period 1970-2000. The results show that in the 1970s a structural bonus occurred (productivity gains due to the structural change). However, between 1980 and 2000 the relocation of inputs in the manufactur-ing sector has not ensured benefits in productivity.
Kiliçaslan & Taymaz (2004) found similar results in their study on the relationship between industrial structure, productivity and competitiveness in manufacturing industries for a sample of MENA7 and Asian8 countries from 1965 to 1999. This study shows that the impact of the structural change in the productivity growth of the manufacturing sector is negligible for most countries, especially since the 1980s. In this period, countries like Jordan and Korea present a negative correlation between structural change and the productivity growth.
Using simple correlation analysis, Kaloudis & Smith(2005) study of 11 OECD economies for a 23-year period (1980-2002) with data from the OECD’s STAN database, concluded that structural change (share of the electronics and other high-tech industries) within manufacturing was not the direct cause of the growth in advanced OECD economies. They did not find evidence sup-porting the argument that the high-tech economies are also the high growth economies. They assert that different economies can follow different paths of
economic growth. Countries play different roles in the differentiated
interna-tional economic system with clear patterns of division of labour among the highly developed economies.
Kaloudis & Smith(2005) show that the higher the share of high-tech in-dustries in manufacturing value added, the higher is GDP per inhabitant. Looking at income levels first, there is indeed a relationship between tech-nological intensity and the level of income across national economies. How-ever, they did not find any positive relationship when we compare the high-tech share in manufacturing value added with the rate of growth of GDP per inhabitant. They cannot conclude, therefore, that high-tech economies are also high growth economies. Moreover, an additional important point is the absence of any convincing evidence for the hypothesis that low-tech economies are low growth economies. If anything, there is weak evidence in
6India, Indonesia, South Korea and Taiwan.
7Middle East and North Africa (MENA): Egypt, Iran, Jordan, Kuwait, Malta, CityMarocco, Tunisia and Turkey.
Table 2: Real GPD growth, and real GPD per capita (EU25=100)
Annual GDP Growth (%) GDPpc 2005 1990-1995 1995-2000 2000-2005 (EU25=100) Portugal 1.7 4.1 0.6 75
EU-25 1.7 3.0 1.8 100 USA 2.5 4.1 2.4 152
aSource: European Commission (2006a), Table 2.1.
the data that low-tech economies are higher growth economies than the high-tech economies. This evidence suggests that growth does not rest on high-high-tech driven structural change.
Another fundamental question raised by Kaloudis & Smith (2005) is in which way the causality runs, since high-tech industries have in practice been created via significant government support, and have invariably been initi-ated by substantial publicly-supported R&D infrastructures (Mowery & Rosen-berg(1989), as well asBruland & Mowery(2004) provide good overviews of this discussion). There may therefore be a pattern of causality that runs from high levels of income, to government budgetary positions, to the creation of industries – that is, some R&D-intensive industries may be a consequence of high income, not a cause of it.
3
Productivity, R&D and structural change: an analysis of the
Portuguese manufacturing industry
3.1 Overview of the Portuguese competitiveness
We selected Portugal to test our hypotheses because it is a good example of a country urgently catching-up with developed economies and currently has a clear policy and concern for R&D and structural change. The Portuguese experience can also be valuable for other economies facing similar challenges. We shall now briefly summarize some of the significant aspects with re-spect to Portuguese competitiveness. We consider what recent data tells us about the EU in general and the Portuguese economy in particular. The data for Portugal reveal that after the high-growth “new-economy” years of the second half of the last decade, growth has been considerably below the aver-age of the EU-25. By 2005, Portuguese GDP per capita amounted to just 75 percent of the EU-25 average, as we can see in Table2.
Table3presents labour productivity growth rates in Portugal, the EU-25 and the US. The data clearly points towards a loss of competitiveness of the EU-25 as compared with the US from the mid-1990s onwards9. Portugal
reg-istered low labour productivity growth overall. By 2005, real GDP per person employed corresponded to 66 percent of EU-25 labour productivity.
Increas-9In the period of 2000-2005, and by historical standards, TFP growth in the EU was very low. The explanations put forward to explain EU TPF performance vary between those that high-light limited innovation, undeveloped services, issues of regulation and infrastructures (Euro-pean Commission, 2006a). Also, the picture is quite differentiated across EU member states. For
Table 3: Labour productivity per person employed (ppe)
Annual Labour productivity growth (%) Real GDPppe 2005 1990-1995 1995-2000 2000-2005 (EU25=100) Portugal 2.3 2.2 0.3 66
EU-25 2.2 2.0 1.3 100 USA 1.3 2.0 2.2 137
Source: European Commission (2006a), Table 2.3.
Note: Productivity is calculated considering persons employed (ppe)
Japan
USA
EU-25
Portugal
0 0,5 1 1 ,5 2 2,5 3 3,5
%
Business Enterprise Sector Other Institutional Sectors
Source: Science and Technology – Statistics in Focus (2005), Eurostat.
Figure 1: R&D intensity in the EU-25, USA, Portugal and Japan - 2002
ing productivity emerged as the main economic challenge for Europe and Por-tugal in particular.
With regard to innovation indicators, the picture is not very encouraging in spite of considerable advances. Data on R&D intensity (R&D expenditures as a percentage of GDP) reveals that Portugal is well below the EU-25 aver-age. Business expenditures in R&D in particular are relatively smaller than in other European counterparts, while public expenditures represent the largest share of total R&D in the country.
Economies are ranked by The European Innovation Scoreboard (European Commission, 2006c) according to a summary innovation index (SII) that com-bines five different dimensions, grouped in inputs and outputs1011. As far as
Portugal is concerned, it is part of a group (Slovenia, Czech Republic, Lithua-nia, Poland, Latvia, Greece and Bulgaria) of countries catching-up with the leaders SII scores well below the EU-25, albeit with a faster than average im-provement in innovation performance. Public R&D contributed significantly to that end, albeit the data of private R&D intensity in manufacturing overall
10At the innovation inputs level: Innovation drivers (four indicators, measuring the structural conditions of innovation potential), knowledge creation (4 indicators, measuring investments in R&D activities, considered key elements in a successful knowledge-based economy), innovation and entrepreneurship (6 indicators, measuring the efforts towards innovation at the firm level).
Innovation outputs include two dimensions, namely applications (5 indicators, measuring the performance, expressed in terms of labour and business activities, and their value added in inno-vative sectors) and intellectual property (5 indicators, measuring the results achieved in terms of successful know-how).
also shows considerable improvements since 1980.
Developments in manufacturing have an important role in the overall per-formance of the economy. Recall that in Europe (EU-25), manufacturing ac-counts for about a third of employment and value-added (EUROSTAT 2004). In Portugal the share for manufacturing is similar. By 2003, the Portuguese manufacturing (section D)12accounted for 28 percent of the value added and
employment1314. Hence, our empirical analysis focuses on the nexus of R&D,
structural change and productivity within the Portuguese manufacturing in-dustry.
3.2 Empirical analysis
Data
The data considered in this part of the study are mainly based on three ba-sic concepts: R&D expenditures, employment and value added. The National Statistics Institute of Portugal (Instituto Nacional de Estatística) and the R&D Survey from the Science and Higher Education Observatory (Observatório da
Ciência e do Ensino Superior) are our primary data sources to estimate the
econometric model over the period 1980-2003. In this study, we had to over-come the obstacle of a change in methodology by the National Statistics In-stitute of Portugal in 1990 with regard to data collection of employment and value added. Recall that until 1989 the data published by the National Statis-tics Institute of Portugal was obtained through a survey of a sample of firms. Since 1990, the data from INE considers all firms. In order to have a con-sistent series, we calculated the values would corespond to all firms for the years 1980-1989. We started by calculating what would be the 1989 value under the new methodology (Y*), which assumed that the annual growth rate for 1989-1990 was the same of the annual compound growth rate15over the
period 1990-2003,α1990−2003:
α1990−2003=
exp1
t ×(lnY2003−lnY1990)
−1
×100
beingtthe number of years
We assumedαas the annual growth rate for 1989-1990. It follows that
Y∗
1989=(1 +Y1990α 90)
For the remaining years (1980-1988), we had the annual growth rates (βi)
provided by the National Statistics Institute of Portugal. Being:
βi: effective growth in the yeari(i= 1980, . . . ,1989)
12Manufacturing corresponds to section D “Secção D” and is formed by 14 subsections (in-dustries), according to the Portuguese Classification of the Economic Activities “CAE – Rev. 2.1”.
13Manufacturing employed about 1.153.914 employees in 1980 and 886.253 in 2003. 14Authors’ own calculations based on values of “Inquérito Permanente ao Emprego” (1981) from the National Statistics Institute of Portugal.
15Annual compound growth rate =h exp1
t ×(lnYit−lnYi0)−1i×100 Being: t= Number of Years
Yit= Value in the final Year
0,00 0,05 0,10 0,15 0,20 0,25 19 81 19 82 19 83 19 84 19 85 19 86 19 80 19 87 19 88 19 89 19 90 19 91 19 92 19 93 19 94 19 95 19 96 19 97 19 98 19 99 20 00 20 01 20 02 20 03
Value Added of PMI/ Employment of PMI
10 ,0 00 E u ros
Source: Authors’ own calculations based on values of “Estatísticas Industriais” (1980-1989) and “Estatísticas das Empresas” (1990-2003) from the National Statistics Institute of Portugal. Note: Value added of PMI at constant prices (consumer price index – base year 1986).
Figure 2: Labour productivity of the Portuguese manufacturing industry
(1980-2003)
Y∗
i: calculated value for the yeari
Y∗ i =
Y∗ (i+1)
(1+β(i+1)) beingi(year)= 1980, . . . ,1988
Starting with 1988,
Y∗
1988=
Y∗
1989
(1 +β89), Y
∗
1987=
Y∗
1988
(1 +β88), Y
∗
1986=
Y∗
1987
(1 +β87), . . .
Having the values for 1988, we applied the effective annual growth rates and
calculated the Y*ifor the remaining years by backward induction.
Descriptive statistics
Looking in detail at the labour productivity in the PMI over a long time pe-riod, we verify that productivity in manufacturing has increased considerably, as result of both, a decline in employment and an increase in value added.
The period under analysis can be divided in two cycles. The first cycle runs from 1980-1985, and the second from 1985-2003. The first period is characterized by moderate productivity growth.Aguiar & Martins(2004) ex-plain the developments based on the international crisis in the aftermath of the Oil Shocks of 1973 and 1979, internal policies and the austerity implied by the stability plans negotiated with the International Monetary Fund (IMF)16.
From 1985 onwards, industrial productivity accelerated, albeit in a context of “deindustrialization”17.Aguiar & Martins(2004) proposed four main rea-sons for this evolution, namely the macroeconomic results of the stabilization plans, institutional and political stability fostering private initiative, acces-sion to the European Economic Community (EEC) in 1986, and favourable international conditions (depreciation of the USD, decline in interest rates and in the Oil Prices).
0 ,000 0 ,001 0 ,002 0 ,003 0 ,004 0 ,005 0 ,006 0 ,007 0 ,008 0 ,009 0 ,010 1 9 8 0 1 9 8 1 1 9 8 2 1 9 8 3 1 9 8 4 1 9 8 5 1 9 8 6 1 9 8 7 1 9 8 8 1 9 8 9 1 9 9 0 1 9 9 1 1 9 9 2 1 9 9 3 1 9 9 4 1 9 9 5 1 9 9 6 1 9 9 7 1 9 9 8 1 9 9 9 2 0 0 0 2 0 0 1 2 0 0 2 2 0 0 3
R&D of PMI / V alue added of P MI
Source: Own elaboration based on “Estatísticas Industriais” (1980-1989), “Estatísticas das Empresas” (1990-2003), “Anuário Estatístico” (1986-1989) and “Anuário Estatístico de Portugal” (1990-2003) from the National Statistics Institute of Portugal, as well as data from the R&D Survey by the “Observatório da Ciência e do Ensino Superior”.
Figure 3: Private R&D intensity in Portuguese manufacturing industry
Although labour productivity in the PMI and in the Portuguese economy in general has registered a positive evolution in recent decades, it continues to remain significantly below the European average. The above discussion highlights that Portugal has to generate faster productivity growth.
The data also suggest that with a view to competitiveness it is not enough to look at capital per worker, but that innovation and an adequate business environment (factors considered by TFP) are fundamental with a view to com-petitiveness and growth, an issue focused by the Lisbon Agenda. Looking at the data on innovative activities in Graph 3, the positive trend from 1988 onwards is clear, in spite of the slight decline in the early 1990s and 2000s mainly associated with the international crisis (Biscaya et al. 2002). Never-theless, business R&D is still relatively lower than in the EU. The small size of the firms has been advanced as one of the possible explanations for the low levels of R&D in Portuguese industry.
Another set of reasons are related to the industrial structure, namely the strong concentration in low-tech sectors (Gonçalves et al. 2000). Indeed, the importance of medium and high-tech sectors on the innovation performance of country is clear when we look at the distribution of the investments in R&D. For the case of the PMI, Table4shows a concentration in the high-technology and medium-high-technology industries. Machine equipment, electric and optical equipment as well as the transport equipment industries represented in 2003 about 45% of the total expenditure in R&D carried out by the PMI. Coke and petroleum, chemicals and products must also be mentioned on ac-count of their 25% expenditure.
equip-Table 4: Structure of expenditure in R&D (current prices), 2003
Branch of Economic Activity R&D (thousand€)
R&D (%) D Manufacturing 150,957.9 100 DA Food, beverages and tobacco 5,651.0 4 DB Textiles 10,509.9 7 DC Fur and leather 733.3
-DD Wood, cork and products 3,718.0 2
DE Pulp, paper, paper products, publishing and printing
2,987.7 2
DF Coke and petroleum 37,249.0 25
DG Chemicals 11,032.1 7
DH Rubber and plastics 6,830.0 5
DI Non-metallic mineral products 2,833.5 2
DJ Basic metals and metallic products 15,874.7 11 DK Machinery equipment, n.e. c. 44,518.3 29 DL Electric and optical equipment 7,346.8 5 DM Transport equipment 1,673.6 1
Source: Adapted from the R&D Survey (2003) by the “Observatório da Ciência e do Ensino Superior”.
Note: Due to statistical secrecy reasons, the results of subsections DF and DG are presented as a whole.
ment, electric and optical equipment and transport equipment altogether ac-count for only 15 percent of manufacturing employment in 2003.
The analysis of the PMI in terms of value-added reveals once more the weight of textiles, food, beverages and tobacco, with 14 and 13 percent of the PMI value-added in 2003. Machinery equipment, electric and optical equip-ment and transport equipequip-ment, account altogether for 19 percent of the value added in 2003.
Regarding specialization in perspective with Europe, three groups of coun-tries can be identified within the EU-1518. The first one includes countries
specialized in high labour skill sectors (Belgium, France, and Luxembourg) and high to intermediate labour skills (Denmark, Finland, Sweden and to a lesser extent the United Kingdom). The second group includes countries specialized in the two lowest categories of labour skills and includes Portu-gal (apart from Austria, Spain, Greece and Italy). Note that in the study by DG Enterprise of the European Commission (2006), Portugal is characterized as specializing19 in leather and footwear, clothing, textiles, wood and
prod-ucts of wood, financial intermediation, radio and television receivers. Finally, there is a group of countries without a clear specialization profile (Germany,
18The value was calculated for the 15 countries that were members of the European Union up to 2004 for which data was available.
19The indicator for sectoral specialization of EU-15 member states presented here compares a country’s value-added shares across industries with the average EU-15 industry’s shares. The indicator is defined, for country ‘i’ and industry ‘j’, with VA being value added and EU corre-sponding to the EU-15, so as to indicate specialization equal to the EU average if the value is 1 for a given industry. The higher the value of the indicator, the higher the country’s specialization compared with the EU average.Si , j=
V Ai , j/PV Ai , j j /
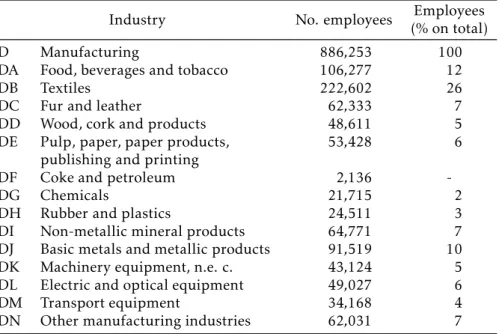
Table 5: Structure of employment, 2003
Industry No. employees (% on total)Employees
D Manufacturing 886,253 100
DA Food, beverages and tobacco 106,277 12
DB Textiles 222,602 26
DC Fur and leather 62,333 7 DD Wood, cork and products 48,611 5 DE Pulp, paper, paper products,
publishing and printing
53,428 6
DF Coke and petroleum 2,136
-DG Chemicals 21,715 2
DH Rubber and plastics 24,511 3
DI Non-metallic mineral products 64,771 7
DJ Basic metals and metallic products 91,519 10
DK Machinery equipment, n.e. c. 43,124 5
DL Electric and optical equipment 49,027 6
DM Transport equipment 34,168 4
DN Other manufacturing industries 62,031 7
Source: Own elaboration based on “Estatísticas das Empresas” (2003), from the National Statistics Institute of Portugal.
the Netherlands and Ireland). This implies that the distribution of value added is very similar to the one of the EU-15 as a whole.
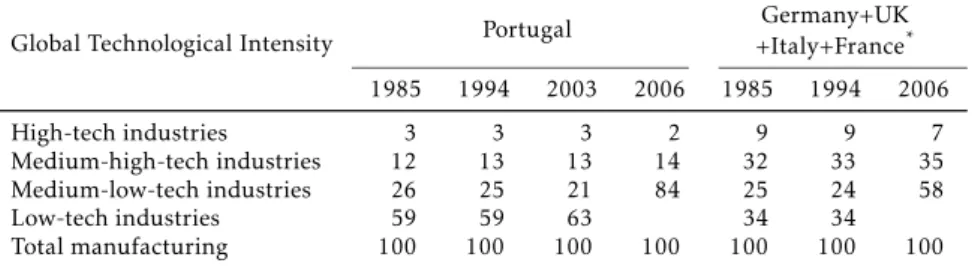
Following the OECD high-tech classification of manufacturing industries20,
we may analyse the PMI’s employment structure at this level. In this re-gard, great stability is verified over the years, where the low-technology and medium-low-technology industries are visibly dominant. These industries as a whole represent in 2006 about 84% of the total employment in the Por-tuguese manufacturing, while in the set of four countries considered in the Table7they don’t represent more than 58%.
As seen, the structure of the PMI clearly shows the weight of low and medium to low technology sectors (Godinho & Mamede 2004). Nevertheless, the relationship between structure and productivity must not disregard the starting level. An increase in the weight of high and medium to high technol-ogy industries of about 1 percent may have a significant impact on economies with a very low starting point (Kaloudis & Smith 2005). Otherwise, even if an industry’s employment share remains constant over time, there may have been a lot of entry and exit of firms and innovation (products and processes) in that industry. As we mentioned before, high and medium to high technology industries are the most highly innovative within Portuguese manufacturing. These aspects need to be considered.
Hence, the emergence of competitors with a broad spectrum of compara-tive advantages in industrial activities has put the issue of the manufacturing industry’s future in industrialized countries on the agenda. The discussion of whether Europe can hold on to manufacturing assumes particular relevance for economies such as the Portuguese one, strongly open and relatively spe-cialized in labour-intensive sectors.
Table 6: Structure of value-added (current prices), 2003
Industry VA (thousand€) VA (%)
D Manufacturing 18,470,272 100
DA Food, beverages and tobacco 2,604,169 13
DB Textiles 2,638,017 14
DC Fur and leather 668,708 4
DD Wood, cork and products 806,520 4
DE Pulp, paper, paper products, publishing and printing
1,803,996 10
DF Coke and petroleum 523,801 3 DG Chemicals 1,049,753 6 DH Rubber and plastics 719,447 4 DI Non-metallic mineral products 1,711,180 9 DJ Basic metals and metallic products 1,719,353 9 DK Machinery equipment, n.e. c. 1,026,060 6
DL Electric and optical equipment 1,346,985 7
DM Transport equipment 1,018,573 6
DN Other manufacturing industries 833,709 5
Source: Own elaboration based on “Estatísticas das Empresas” (2003), from the National Statistics Institute of Portugal.
Table 7: Employment structure in terms of industries by technological intensity (%)
Global Technological Intensity Portugal +Italy+FranceGermany+UK* 1985 1994 2003 2006 1985 1994 2006
High-tech industries 3 3 3 2 9 9 7
Medium-high-tech industries 12 13 13 14 32 33 35 Medium-low-tech industries 26 25 21 84 25 24 58
Low-tech industries 59 59 63 34 34
Total manufacturing 100 100 100 100 100 100 100 Source: Adapted fromGodinho & Mamede(2004) except 2003 (authors’ own
calculations based on values of “Estatísticas das Empresas” (2003) from the National Statistics Institute of Portugal) and 2006 (own calculations based on values of “Science, technology and innovation in Europe” (2008) from Eurostat).
The model and variables
Previously we highlighted the increase in PMI’s productivity as well as the developments regarding innovation and structural change. Following the lit-erature reviewed in section 2, three hypotheses are tested for Portuguese man-ufacturing over the period 1980-2003:
1. Public R&D activity has a positive impact on manufacturing productiv-ity;
2. Business R&D in the high-technology and medium-high-technology in-dustries has a positive impact on manufacturing productivity;
3. An increase in high-technology and medium-high-technology industries on manufacturing employment has a positive impact on the manufac-turing productivity.
If an exact innovation model in all its multiple dimensions was avail-able, we would be able to fully understand the complex nature of innova-tion (Mairesse 2004). However, such a model does not exist. Nevertheless, asMairesse(2004) notes, “it is worth trying to account for innovation diff
er-ences, even in a crude and simplified manner.”
Once we have overcome the problem of the time-coherence of the series, we obtain 24 usable observations. With a small sample size such as ours, the empirical analysis should be kept to a minimum level of complication, since good small-sample properties of estimation methods are generally difficult to
obtain.
Since productivity is, among other things, a result of innovation, and in-novation is, among other things, a result of R&D (Mairesse & Mohnen 2002), we present a multiple regression model that allows us to quantify the re-lation between a dependent variable (Y) and a set of independent variables (X0, X1, X2, . . . , Xn) through the estimation of their parameters (β0, β1, β2, . . . , βn):
Yt=β0+β1Xt1+β2Xt2+...+βnXtn+ut, with X0= 1;t= 1,2..., T (1)
or
Yt=β0+
n X
i=1
βiXti+ut, with X0= 1;i= 1,2..., n;t= 1,2, ...T . (2)
Based on equation (1), we developed an econometric model in order to explain the PMI’s labour productivity.
The econometric model includes public R&D activity by the Portuguese State (H1) and business R&D in medium and high-tech industries so as to an-alyze the relationship between R&D and the PMI’s labour productivity, giving particular emphasis to R&D in medium and high intensive sectors (H2).
To test Hypotheses 3 we included as a variable the weight of medium to high-tech industries on total manufacturing employment, as this group of in-dustries registered a slight increase over the period under analysis. In our study we considered the machine equipment (ME), electric and optical equip-ment (EOE) and transport equipequip-ment (TE) sectors, which are classified by OECD as medium to high-tech intensive sectors.
Yt=β0+β1Xt1+β2Xt2+β3Xt3+ut (3)
Y stands for PMI labour productivity, which is represented by the logarithm of the ratio between the value added of PMI (constant prices: base year 1986) and employment in the PMI;
X1 stands for public R&D intensity which is represented by the logarithm of
the ratio between the Portuguese State’s expenditure in R&D and the value added of PMI;
X2 stands for the private intensity in R&D of ME, EOE and TE, which is
rep-resented by the logarithm of the ratio between private expenditure in R&D by these three industries and the value added relative to ME, EOE and TE;
X3 stands for the proportion that ME, EOE and TE as a whole have in the total
employment of the PMI, which is represented by the logarithm of the ra-tio between employment in these three industries and total employment in the PMI.
We further introduced a number of lags for R&D related variables (X1 and X2). The introduction of lags is based on the fact that R&D expenditures may well take time to affect output. Indeed, investments in R&D do not normally
produce immediate results because time is necessary before new knowledge can be developed, so that it can be disseminated and commercialized in the economy (Griliches 1979).
Seeing that a significant number of studies have demonstrated that this lag varies on average between one and four years (Mansfield et al. 1971,Pakes & Schankerman 1984,Acs & Audretsh 1988), we also estimate our model con-sidering a temporal lag of one, two, three and four years for the variables related to R&D intensity (X1 and X2).
Estimation results
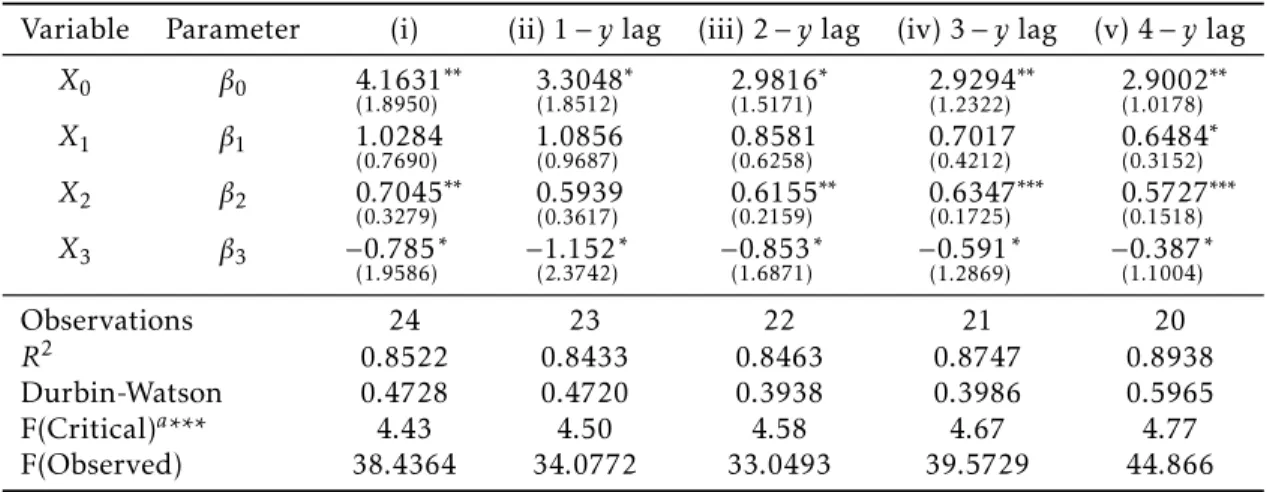
Tables8and9present the values obtained from the estimation of the model through the method of ordinary least squares (OLS). In the original model without any temporal lag for the independent variables (column i) we ob-served a positive autocorrelation21(ρ >0) with the Durbin-Watson’s value (d
= 0.4728) falling in the interval ]0;dL[22. In order to correct eventual
auto-correlation problems, the results presented in the tables were estimated using Newey-West estimators (model a), and 1-year lag for the dependent variable (model b), respectively. As shown in Table8, the autocorrelation persisted in the model a23. The results of Table9demonstrate that the inclusion of a
1-year lag for PMI labour productivity eliminates the positive autocorrelation in the residuals.
We also estimated the models considering a temporal lag of one, two, three and four years for the variables related to R&D intensity (X1andX2).
Our results show that only Hypothesis 2 is partially supported, as the co-efficient of the independent variableX2is the only one statistically significant
21In this situation, an increase in the labour productivity in the period t generates a positive impact on the residue of the following period (period t +1).
22The value of dL with a 5% significance level is given by 1.101.
in both models. Therefore, only X2, the variable measuring the private
in-tensity in R&D of ME, EOE and TE, contributes to the explanation of the PMI labour productivity growth. However, in model b the effect ofX2becomes
sig-nificant after the 3-year lag, suggesting that the effect of intensity in private
intensity of R&D is not immediate.
Hypothesis 1 and 3 on the other hand are not confirmed, as the coefficients
of variables X1 andX3 are not statistically significant. Nevertheless, the
co-efficients of variable X1 are mainly positive, and in model b the signal ofX3
becomes positive with a 4-year lag.
When included in model b, the variableY−1is always statistically
signifi-cant at the 1% level, which means that the last values of productivity in the manufacturing industry exert a positive effect on the productivity values in
the following years.
The independent variables as a whole reflect a good explanatory capacity for the PMI’s labour productivity, when FObserved is higher than FCritical at the 1% significance level. The high R2 reflects a good adjustment of the mod-els. A substantial part of the total variation in the PMI’s labour productivity is explained by the independent variables considered in the models.
4
Discussion and implications
Our model makes many simplifying assumptions, but its main virtue is that it takes into consideration the indirect impact of public R&D as well as of medium and high-tech industries’ R&D in other sectors where the R&D effort
is made. Our results confirm the importance of business R&D in the medium to high-tech sectors, as they stimulate productivity growth. We further reveal that the direct impact and the inherent spillovers from private expenditure in R&D occur in a relatively shorter period of time than that of public invest-ment. R&D is overwhelming important, but, R&D expenditures may be only one part of the story behind the Portuguese backlog. Factors such as absorp-tive capacity, interactions within the S&T system, regulation and stability may be just as important in achieving the TP ambition.
Regarding the role of structural change, the results deserve an in-depth analysis and the conclusions are not straightforward.
In the countries examined byKaloudis & Smith(2005), there was a clear tendency for the share of low-tech industries in manufacturing to decline dur-ing the period 1980-1999, while the share of high-tech industries increased. This applies to both production and employment. However, they concluded that among the OECD countries studied, structural change within manu-facturing is not the direct cause of the growth process in advanced OECD economies. In our case we did not identify a decline (or growth) in the weight of technology intensive industries. Probably for that reason we could not confirm Hypothesis 3. Otherwise, the fact that high-tech sectors are grow-ing faster than medium or low-tech sectors in manufacturgrow-ing output, does not necessarily mean that high-tech contributes more to overall manufactur-ing growth or productivity growth. High-tech sectors are small, so even high growth rates can have a relatively diminutive overall impact.
V
ar
u
m
,
C
ib
rã
o,
M
or
ga
d
o
an
d
C
os
ta
E
co
n
om
ia
A
p
lic
ad
a,
v.1
3
,
n
.4
Table 8: Estimation results (NEWEY-WEST estimation, model a)
Variable Parameter (i) (ii) 1−ylag (iii) 2−ylag (iv) 3−ylag (v) 4−ylag X0 β0 4.1631
(1.8950)
∗∗ 3.3048
(1.8512)
∗ 2.9816
(1.5171)
∗ 2.9294
(1.2322)
∗∗ 2.9002
(1.0178) ∗∗
X1 β1 1.0284
(0.7690) 1(0..08569687) 0(0..85816258) 0(0..70174212) 0(0..64843152)
∗
X2 β2 0.7045 (0.3279)
∗∗ 0.5939
(0.3617) 0(0..61552159)
∗∗ 0.6347
(0.1725)
∗∗∗ 0.5727
(0.1518) ∗∗∗
X3 β3 −0.785
(1.9586)
∗ −1.152
(2.3742)
∗ −0.853
(1.6871)
∗ −0.591
(1.2869)
∗ −0.387
(1.1004) ∗
Observations 24 23 22 21 20
R2 0.8522 0.8433 0.8463 0.8747 0.8938 Durbin-Watson 0.4728 0.4720 0.3938 0.3986 0.5965 F(Critical)a*** 4.43 4.50 4.58 4.67 4.77
F(Observed) 38.4364 34.0772 33.0493 39.5729 44.866
Notes: Standard Errors in brackets. In column (i), the model is estimated without any lag, in column (ii) with a
1-year lag for variablesX1 andX2, in column (iii) with a 2-year lag, in column (iv) with a 3-year lag and in
column (v) with a 4-year.
*Significance at 10%;
**Significance ate 5%;
R&
D
,
st
ru
ct
u
ra
l
ch
an
ge
an
d
p
ro
d
u
ct
iv
ity
41
9
Variable Parameter (i) (ii) 1−ylag (iii) 2−ylag (iv) 3−ylag (v) 4−ylag X0 β0 4.1631
(1.8950)
∗∗ 3.3048
(1.8512)
∗ 2.9816
(1.5171)
∗ 2.9294
(1.2322)
∗∗ 2.9002
(1.0178) ∗∗
X1 β1 1.0284
(0.7690) 1(0..08569687) 0(0..85816258) 0(0..70174212) 0(0..64843152)
∗
X2 β2 0.7045 (0.3279)
∗∗ 0.5939
(0.3617) 0(0..61552159)
∗∗ 0.6347
(0.1725)
∗∗∗ 0.5727
(0.1518) ∗∗∗
X3 β3 −0.785
(1.9586)
∗ −1.152
(2.3742)
∗ −0.853
(1.6871)
∗ −0.591
(1.2869)
∗ −0.387
(1.1004) ∗
Observations 24 23 22 21 20
R2 0.8522 0.8433 0.8463 0.8747 0.8938 Durbin-Watson 0.4728 0.4720 0.3938 0.3986 0.5965 F(Critical)a*** 4.43 4.50 4.58 4.67 4.77
F(Observed) 38.4364 34.0772 33.0493 39.5729 44.866
Notes: Standard Errors in brackets. In column (i), the model is estimated without any lag, in column (ii) with a
1-year lag for variablesX1 andX2, in column (iii) with a 2-year lag, in column (iv) with a 3-year lag and in
column (v) with a 4-year.
*Significance at 10%;
**Significance ate 5%;
been overwhelming important. Hence, one must avoid those views that em-phasize excessively the role of high-tech sectors in economic growth, which often underestimate processes of change and needs in those sectors of the economy with low R&D investments. Finally, there has been structural change at the level of the economy as a whole, with a sustained rise in the share of services. This rise increase not support the high-tech argument, since services in general tend to be considered less R&D intensive than high-tech manufac-turing. Moreover, a developed service sector may well contribute significantly to manufacturing productivity, and this fact was not taken into account in our analysis.
But, as mentioned previously, even if an industry’s employment share re-mains constant over time, there may have been a lot of entry and exit of firms and innovation (products and processes) in that industry. We verified that the innovation developments in the industries under consideration had a positive impact on productivity evolution in the time period analyzed. The dynamiza-tion of business R&D in Portuguese manufacturing relies substantially on the dynamics of medium to high-tech industries, even if they do not gain consid-erable weight in the total employment or value-added.
Finally, from the analysis provided it is possible to derive future research avenues. As demonstrated by several studies, there has been a clear tendency for the share of low-tech industries in manufacturing to decline, while the share of high-tech industries has increased. It is nevertheless important to confront the claims of high-tech approaches with the evidence.
Bibliography
Acs, Z. & Audretsh, D. B. (1988), ‘Innovation in large and small firms: An empirical analysis.’,American Economic Review78, 678–690.
Adams, J. (1990), ‘.fundamental stocks of knowledge and productivity growth’,Journal of Political Economy98, 673–702.
Aguiar, A. & Martins, M. (2004), O crescimento da produtividade da indús-tria portuguesa no século xx, Technical report, Faculdade de Economia da Universidade do Porto.
Ahn, S. (1999), Technology upgrading with learning costs: A solution for two productivity puzzles., Technical report, Paris OECD.
Aiginger, K. (2001), The impact of innovation: Evidence on the macro and sector level, Technical report, Austrian Institute of Economic Research. AND, J. M. (2008), Median-unbiased estimation of higher order autoregres-sive/unit root processes and autocorrelation consistent covariance estima-tion in a money demand model.,in‘XIV ANNUAL CONFERENCE ON COM-PUTING IN ECONOMICS AND FINANCE,’.
Bessen, J. (2002), ‘Technology adoption costs and productivity growth: The transition to information technology.’,Review of Economic Dynamics5, 443– 469.
Brooks, H. (1994), ‘The relationship between science and technology.’,
Re-search Policy23, 477–486.
Bruland, K. & Mowery, D. (2004),Innovation through time, Oxford University Press.
Carree, M. A. (2002), ‘Technological progress, structural change and produc-tivity growth: a comment.’,Structual Change and Economic Dynamics14, 109–
115.
Christensen, C. M. (1997),The Innovator’s Dilemma: When New Technologies
Cause Great Firms to Fail., Harvard Business School Press.
Crépon, B., Duguet, E. & Mairesse, J. (1998), ‘Research, innovation and pro-ductivity: An econometric analysis at the firm level.’,Economics of Innovation
and Technology7, 115–158.
EUROPEANCOMISSION (2006), The european innovation scoreboard – comparative analysis of innovation performance., Technical report, Euro-pean Commission.
EUROSTAT (2004), Eurostat yearbook 2004: The statistical guide to europe., Technical report, Luxembourg: Office for Official Publications of the
Euro-pean Communities.
Fagerberg, J. (2000), ‘Technological progress, structural change and produc-tivity growth: a comparative study.’,Structural Change and Economic Dynam-ics11, 393–411.
Fraumeni, B. & Okubo, S. (2005), R&D in the national income and product accounts: A first look at its effect on GNP,inC. Corrado, J. Haltiwanger &
D. Sichel, eds, ‘Measuring Capital in the New Economy’, The University of Chicago Press.
Godinho, M. & Mamede, R. (2004), Factores de convergência da economia portuguesa,in‘Portugal e a Sociedade do Conhecimento’, Celta Editora.
Gonçalves, F. B., Godinho, M. M. & Caraça, J. (2000), Políticas de c&t e in-ovação em portugal: Trajectória, passado recente e perspectivas, in ‘CON-VERGE PROJECT MEETING’.
Griliches, Z. (1979), ‘Issues in assessing the contribution of research and de-velopment to productivity growth’,Journal of Economics10, 92–116.
Griliches, Z. (1992), ‘The search for R&D spillovers’,The Scandinavian
Jour-nal of Economics94, 29–47.
Griliches, Z. (1995), R&D and productivity: Econometric results and mea-surement,in‘Handbook of the Economics of Innovation and Technological
Change.’, Basil Blackwell.
Guellec, D. & Van-Pottelsberge, B. (2001), ‘R&D and productivity growth: Panel data analysis of 16 oecd countries’,OECD Economic Studies2001, 103–
Jovanovic, B. & Nuarko, Y. (1996), ‘Learning by doing and the choice of tech-nology.’,Econometrica64, 1299–1310.
Kaloudis, A. & Smith, K. (2005), Structural change, growth and innovation: the roles of medium and low tech industries, 1980-2002.,in‘CONFERENCE
LOW-TECH AS MISNOMER: THE ROLE OF NON-RESEARCH-INTENSIVE INDUSTRIES IN THE KNOWLEDGE ECONOMY’.
Kiliçaslan, Y. & Taymaz, E. (2004), Structural change, productivity and com-petitiveness in mena countries., Technical report, Ankara: Middle East Tech-nical University.
Mairesse, J. (2004), Corporate innovation, research and productivity., Tech-nical report, Institut National de la Statistique et des Éstudes Économiques.
Mairesse, J. & Mohnen, P. (2002), Accounting for innovation and produc-tivity: a comparison across four european countries.,in‘DRUID SUMMER
CONFERENCE 2002 ON INDUSTRIAL DYNAMICS OF THE NEW AND OLD ECONOMY – WHO IS EMBRACING WHOM?’.
Mansfield, E., Rapoport, J., Schnee, J., Wagner, S. & Hamburger, M. (1971),
Research and Innovation in the Modern Corporation., MacMillan.
Mowery, D. & Rosenberg, N. (1989), Technology and the pursuit of economic
growth, Cambridge University Press.
OECD (1994),The measurement of scientific and technological activities : pro-posed standard practice for surveys on research and experimental development :
Frascati manual 1994, [5th ed.] edn, Organization for Economic Co-operation
and Development.
Pakes, A. & Schankerman, M. (1984), The rate of obsolescence of patents, re-search gestation lags, and the private returns to rere-search resources.,in‘R&D, Patents, and Productivity’, University of Chicago Press.
Poole, E. & Bernard, J. T. (1992), ‘Defence innovation stock and total factor productivity.’,Canadian Journal of Economics25, 438–452.
Rocha, F. (2005), Mudança estrutural na indústria brasileira: 1970-2001, in ‘Indústria, Trabalho e Tecnologia: Subsídios à Política Pública.’, EITT/PUCSP.
Romer, P. (1990), ‘Endogenous technological change.’, Journal of Political
Economy98, 71–102.
Salter, W. (1960), Productivity and Technical Change., Cambridge University
Press.
Singh, L. (2004), ‘Technological progress, structural change and productivity growth in manufacturing sector of south korea.’, World Review of Science,
Technology and Sustainable Development1, 37–49.
Solow, R. (1957), ‘Technical change and the aggregate production function’,
Sveikauskas, L. (2007), R&D and productivity growth: A review of the liter-ature, Technical report, U.S. Bureau Of Labor Statistics.
Syrquin, M. (1988), Patterns of structural change.,in‘Handbook of
Develop-ment Economics’, Elsevier.
Timmer, M. P. & Szirmai, A. (2000), ‘Productivity growth in asian manu-facturing: the structural bonus hypothesis examined.’,Structual Change and
Economic Dynamics11, 371–392.
Utterback, J. (1994),Mastering the Dynamics of Innovation, Harvard Business School Press.
Wieser, R. (2001), The impact of research and development on output and productivity: Firm level evidence.,in‘Innovation and productivity of Euro-pean manufacturing’.
Young, A. (1991), ‘Learning by doing and the dynamic effects of international
Appendix A
High-tech classification of manufacturing industries
Global Technological
Intensity
Economic Activity Average R&D
Intensity (%)
High-technology
Aeronautics and aerospacial
7.7 – 13.3 Pharmaceutic products
Office equipment and computing
Radio, TV and communication equipment Medical instruments and optical
Medium-high technology
Machinery and electric equipment
2.1 – 3.9 Motorvehicles
Chemicals, except pharmaceutical industry Rail and transport equipment n.e.
Other machinery and equipment
Medium-low technology
Construction and naval repair
0.6 – 1 Coke, Petrol and nucler
Non-metallic mineral products Basic metals and metallic products Metallic products (except machinery and
equipment)
Low-technology
Recycling
0.3 – 0.5 Pulp, paper, paper products, publishing and
printing
Food, beverages and tobacco Textiles
Fur and leather