of Chemical
Engineering
ISSN 0104-6632 Printed in Brazil www.abeq.org.br/bjche
Vol. 34, No. 02, pp. 541 - 555, April - June, 2017 dx.doi.org/10.1590/0104-6632.20170342s20150520
CFD SIMULATION OF AN INDUSTRIAL
REACTOR FOR THERMAL CRACKING OF
1,2-DICHLOROETHANE
T. C. L. de Oliveira
1*, A. T. Pereira Neto
1,
J. J. N. Alves
1and A. A. de Morais Júnior
21Laboratory of Numerical Experimentation of Processes, Chemical Engineering Department, Federal University of Campina Grande, Avenue Aprígio Veloso, 882, 58429-100, Campina Grande, Paraíba, Brazil.
Phone: +55 83 9616 9580, +55 83 2101 1518 Email: [email protected]
Mailing address: Rua Maria de Lurdes Crispim 521, Apartment 04 58429-090, Universitário, Campina Grande, Paraíba, Brazil 2Federal University of Paraíba, Chemical Engineering Department,
58051-900, João Pessoa, Paraíba, Brazil
(Submitted: August 21, 2015; Revised: January 19, 2016; Accepted: February 28, 2016)
Abstract – The vinyl chloride monomer (VCM) is commercially produced on a large scale by thermal cracking
of 1,2-dichloroethane (EDC) in a tubular reactor immersed in a furnace. Computational luid dynamics (CFD)
was used to simulate and predict the performance of an industrial reactor. The reactor conversion as well as the behavior of several process variables such as pressure, temperature, velocity and concentration of components through the reactor were predicted in this work.The results were compared with industrial data and are in agreement with them.
Keywords: Thermal Cracking, CFD, 1,2-Dichloroethane, Tubular Reactor.
INTRODUCTION
The vinyl chloride monomer (VCM) is the basic feedstock for the manufacture of polyvinyl chloride (PVC) used for a variety of purposes in industry. VCM is commercially produced on a large scale by pyrolysis of 1,2-dichloroethane (EDC) in industrial furnaces, producing anhydrous hydrogen chloride as byproduct, according to the following reaction:
C
2H
4Cl
2(g)→ C
2H
3Cl
(g)+ HCl
(g)The typical range of operational conditions of these reactors are: residence time of 10-30 s, pressure of 1.01325-2.0265 MPa, and gas temperature at around 773.15 K,
resulting in an EDC conversion of 50-60% (Borsa , 1999). A pyrolysis process for EDC cracking is illustrated in Figure 1. The fuel gas feeds a large isolated furnace lined with refractory bricks. Burners are mounted on the side walls to achieve the desired operating temperature. The EDC stream passes through stainless steel tubes inmersed inside the furnace where the reactions producing VCM, HCl
and by-products occur. The eluent gas has its temperature
reduced to minimize the formation of byproducts.
Several works performing 1-D modeling and simulation of cracking reactors have been reported in the literature. Sundaram and Froment (1979) performed simulation of
thermal cracking of ethane aiming to investigate the efect
( )
=
0
⋅
∇
+
∂
∂
v
t
ρ
ρ
pyrolysis of propane. Ranzi et al. (1992) studied the efect
of coke deposition on the pyrolysis of EDC also using an unidimensional reactor model.
Li et al. (2013) used modeling and simulation of an EDC pyrolysis furnace aiming to study two important aspects: adding CCl4 as cracking promoter and the allocation of fuel gas injection in the combustion chamber in order to
understand its beneits on the cracking process. The results
showed that the addition of CCl4 causes a signiicant increase in EDC conversion; however, it increases the coke
formation, decreasing the eiciency of the furnace and
shortening the operation time. The authors concluded that,
for economic beneits, the optimal concentration of CCl4 is 100 ppm, and the optimal fuel gas allocation factor 0.36 to guarantee a long campaign and a high average conversion.
The 1-D model has the limitation of not considering the radial gradients, which means a perfect radial dispersion,
resulting in an ideal plug low reactor model. More
accurate predictions can be obtained by using 2-D or full 3-D models for simulating industrial furnaces, for which several works in the literature have used CFD techniques.
Yang and Cao (2002) performed a two-dimensional modeling of EDC thermal cracking. The results showed
a signiicant variation of temperature and reaction rate in
the radial direction. The model could satisfactorily predict the EDC conversion, VCM selectivity, pressure, and
temperature proiles at the outlet of the reactor coil.
Oprins et al. (2003) simulated a cracking furnace by using a 3D CFD model with the aim of studying the
pressure and low ields in the combustion chamber, and it was concluded that the reactor has little efect on the low ields inside the combustion chamber.
Xingying (2004) simulated the furnace radiation zone for the cracking of ethylene by using CFD.
Li et al. (2012) performed a 1-D model simulation of the reactor using the Lobo-Evans method. The 1-D model was used for analysis and optimization of the reactor outlet temperature and fuel gas allocation. CFD simulations of the
furnace-reactor were used to validate the results obtained. CFD simulations provided information on process variable such as turbulence, temperature and mass concentration distributionin the combustion chamber of the furnace.
Zhang et al. (2013) simulated the thermal cracking of propane using CFD techniques in order to investigate the behavior of the process variables.
Most of the works on CFD aim to describe the phenomena occurring in the furnace, not approaching in more detail inside the reactor. However, the pyrolysis reaction inside
the reactor directly afects important process variables such
as yield, cost, and quality of cracking products. This work consists in CFD modeling and simulation of the reactor of an industrial EDC cracking furnace in order to obtain the behavior of the main variables involved in the process such as pressure, temperature, concentration and velocity. One
contribution of this work is to link the luid low inside
the reactor to the chamber temperature outside the reactor through the wall boundary condition without needing to include the tube wall itself as being part of the domain, thus eliminating the mesh in the wall reactor, which reduces the size of the system of equations to be solved. The model was validated with industrial data as well as compared
to the 1-D model and can be used to deine new optimal
operational conditions.
MATHEMATICAL MODEL
The mathematical model is based on the mass, momentum, and energy conservation laws (Bird et al. , 2002):
Continuity Equation Figure 1. Pyrolysis Process (reproduced with permission from Panjanpornpon et al., 2012).
Momentum conservation
The standard k-epsilon turbulence model (Jones and Launder, 1972) was used to calculate the turbulent viscosity
of the luid. This model is widely used for industrial
applications due to its good convergence rate, relatively low memory requirements and accuracy. Several works in the literature used the standard k-epsilon for turbulent
lows in pipes (Sugiharto et al., 2013; Zambrano, 2015).
Individual Component Mass Conservation
Energy Conservation
Boundary Conditions
Inlet
All variables were prescribed at this boundary except
the pressure, which was extrapolated from the low domain.
Outlet
The continuity condition was used (derivative null with respect to the normal to the boundary in the direction of
low), except the pressure, which had its value speciied at
this boundary.
Wall
The impermeable, non-slip condition was used for
velocity and species normal mass low. For temperature,
an energy balance at the interface wall/chamber (Equation 6) was used in order to calculate the wall outside tube skin temperature (Incropera, 2007).
where
is the wall conductive resistence.
The right side of Equation 6 can be rewritten in the standard generalized Stefan-Boltzman equation as follows:
where the emissivity function is given by:
Equation 8 is a polynomial function in Ts and can be rewritten as follows:
where b and c are given by:
The skin temperature Ts is then obtained by solving Equation 10 for Ts. As can be seen, Equation 10 is a 4-degree polynomial function having four roots.
It is worth mentioning that Tw, the temperature on the
inner surface of the reactor wall is obtained from the low
domain at the previous iteration.
The only root of the 4-degree polynomial function (Equation 10) having physical meaning (value between the inner surface temperature and wall chamber temperature) is the following:
where:
( ) ( )
v
v
(
v
v
)
g
P
t
T
eff
∇
+
∇
+
−
∇
⋅
∇
=
⋅
∇
+
∂
∂
ρ
ρ
µ
ρ
( ) ( )
Y
iv
Y
i(
iMY
i)
R
it
+
∇
⋅
=
∇
⋅
Γ
∇
+
∂
∂
ρ
ρ
( ) (
c
pT
v
c
pT
) (
effT
)
S
E frt
+
∇
⋅
=
∇
⋅
∇
+
+
Φ
∂
∂
ρ
ρ
λ
�
�− �
��
�=
�
�� �
�4− �
�41
− �
��
�+
�
1
��+
�
�(1
�
�− �
�
���
�
�=
l n(
r
r
sin
�
2
�
k
w�
�
�− �
��
�=
�
���
��� �
�4− �
�4�
=
�
��1
− �
��
�+
�
��
�1 +
�
��1
− �
��
�−1
�
�4+ b
�
�+
�
= 0
b =
k
wr
sl n(
r
r
sin
)
ϵσ
F
psc =
−
T
p4+ bT
w�
�=
−
1
2
2
�
+
1
2
−
2
�
+ 2
�
⁄
2
�
�
=
�
2
16
+
�
464
− �
3 3+
�
2
16
−
�
4Is the real positive root of the auxiliary 3-degree polynomial function:
Thus, from an energy balance at the inner wall surface,
one of the boundaries of the domain, the heat lux at this
boundary is:
where the coeicient of heat transfer by radiation between
the combustion chamber and the external surface of the reactor was calculated from Equation 17 (Incropera, 2007).
The view factor Fps, deined as the fraction of radiation
that leaves the inner sidewall of the irebox and intersects
the outer surface of the reactor, was calculated from Equation 18 (Incropera, 2007), the view factor between an
ininite plate and a cylinder.
It is worth emphasizing that Equation (16) was the one implemented in Ansys® CFX as the wall boundary condition for heat transfer.
Reaction kinetic and Heat Generation Rate
The rates of EDC cracking and heat consumption due to the endothermic cracking reaction are calculated from Equations 19 and 20, respectively.
The kinetic constant and the enthalpy of reaction are functions of temperature according to Equations 21 and 22, respectively (Fogler, 2000).
Although pyrolysis involves hundreds of reactions with molecular compounds and radicals (Borsa, 1999; Choi et al., 2001), in this work only the main cracking reaction has been considered due to the high VCM selectivity with values greater than 99 % (Borsa, 1999). The activation energy and pre-exponential factor for reaction are 120750 J/mol and 1.15107 s-1, respectively (Panjanporon et al., 2012).
Physical Properties
The physical properties of the components used in this study were obtained from Yaws (1999).
Heat Capacity
Thermal Conductivity
Enthalpy of Formation
Dynamic Viscosity
where A, B and C with their respective sub-indices are constant correlations obtained through experimental data for each component.The mixture property is obtained from a mass average of the component properties.
COMPUTATIONAL MODEL
The reactor geometry consists of tubes with straight and curved sections as shown in Figure 2. The 3 points (5.0; 8.5; and 12.5 m) highlighted in Figure 2 represents
locations were the low was analyzed to investigate the
y
3−
cy
−
�
2
8
= 0
−�
�∂�
∂�
�
�=���
=
�
�ℎ
��
�− �
��
�ℎ
�=
є�
��σ �
�+
�
��
�2+
�
�2���= 1− 1− �
�
2 1 2⁄
+ �
� ���−1
�2− �2
�2 1 2⁄
�
���= KC
EDC�
�=
�
�����
�K = A
je
−Eaj⁄ TRΔ
Hr =
ΔHfi
+
�Δ�
����
C
pi= A
Ci+ B
CiT + C
CiT
2K
i=A
ki+ B
kiT + C
kiT
2H
fi= A
Hi+ B
HiT + C
HiT
2μ
i= A
Vi+ B
ViT + C
ViT
2behavior of the variables in the radial direction. Geometry details and operating conditions are shown in Table 1 for the industrial reactor studied in this work. The temperature
of the irebox wall of a typical EDC furnace is equal to
1053.15 K as reported in Schirmeister (2009), and this value was assumed in this work.
Figure 2. Reactor geometry.
Table 1. Typical Industrial Data
Parameter/variable Value
Inlet mass low 8.567 [kg/s]
Inlet pressure 2.07 [MPa]
Outlet pressure 1.93 [MPa]
Inlet temperature 523.15 [K]
Outlet temperature 771.15 [K]
Tube length 348.45 [m]
Curvature radius 0.178 [m]
Length of the bends 0.5 [m]
Number of the bends 22 [-]
Reactor diameter 0.15 [m]
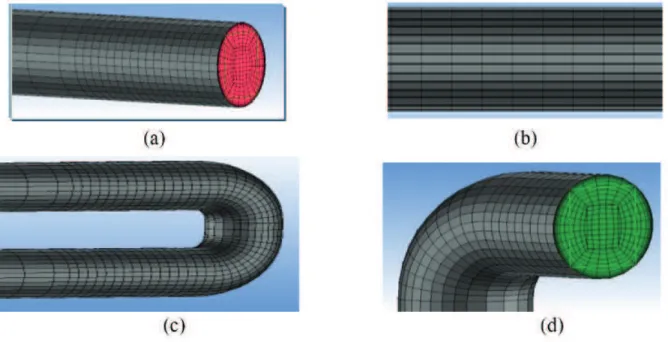
The numerical mesh contains 1,036,408 hexahedral
elements. The Mesh is shown in Figure 3 for diferent regions in the reactor. The inlet, curves and outlet regions were reined to better capture the details of the low.
A mesh independence study was conducted to ensure
that the results are not inluenced by the mesh. Temperature and pressure were evaluated for diferent mesh sizes as shown in Figures 4 and 5, respectively.
Figure 4. Pressure proile as a function of number of elements.
Figure 5. Temperature proile as a function of number of elements.
The simulations were conducted in steady state in Ansys® CFX software. Ansys® CFX software uses a hybrid
inite-element/inite-volume approach for discretizing
the conservation equations (Navier-Stokes, mass, energy,
etc). As a inite volume method, it satisies strict global
conservation by enforcing local conservation over control volumes that are constructed around each mesh vertex or
node. The inite element methodology is used to describe the solution variation (needed for various surface luxes and
source terms) within each element. The SIMPLE algorithm was used for pressure-velocity coupling and a high order hybrid interpolation scheme has been used (ANSYS CFX-Solver Theory Guide,2009).
The simulations were performed on computer servers with an Intel® Xeon® E5-2400 processor with 8 cores.
RESULTS AND DISCUSSION
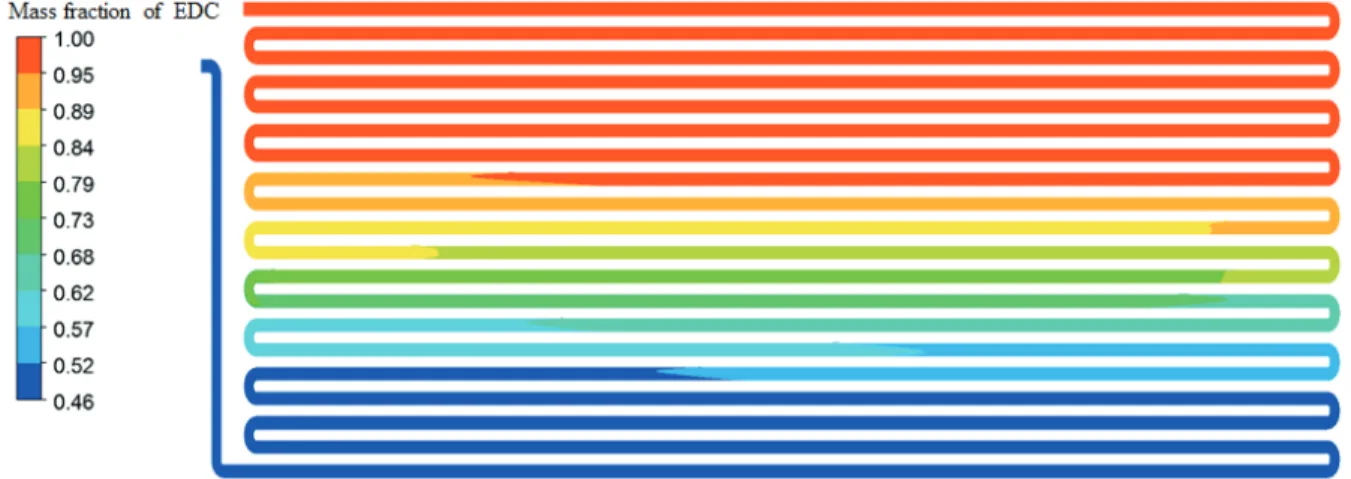
The EDC and VCM mass fraction proiles are shown in
Figures 6 and 7 on a plane that intersects the center of the reactor. Initially, the gas is heated without reaction taking
place in the irst hundred meters of the reactor; the cracking of EDC start efectively after this initial heating length. A
conversion of about 54 wt% of EDC was predicted from Figure 6, for a selectivity of 27wt% of VCM, as can be seen from Figure 7.
Figure 7. Mass fraction of VCM along the reactor.
Figure 6. Mass fraction of EDC along the reactor.
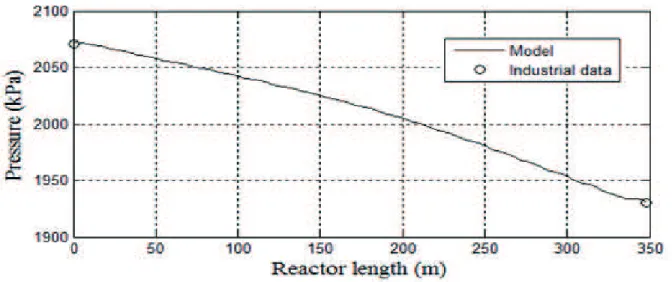
The variation of pressure along the reactor caused by the loss of distributed load (stretch of straight pipe) and localized (curves in U) is illustrated in Figure 8, from which a total pressure drop of about 165 kPa was predicted.
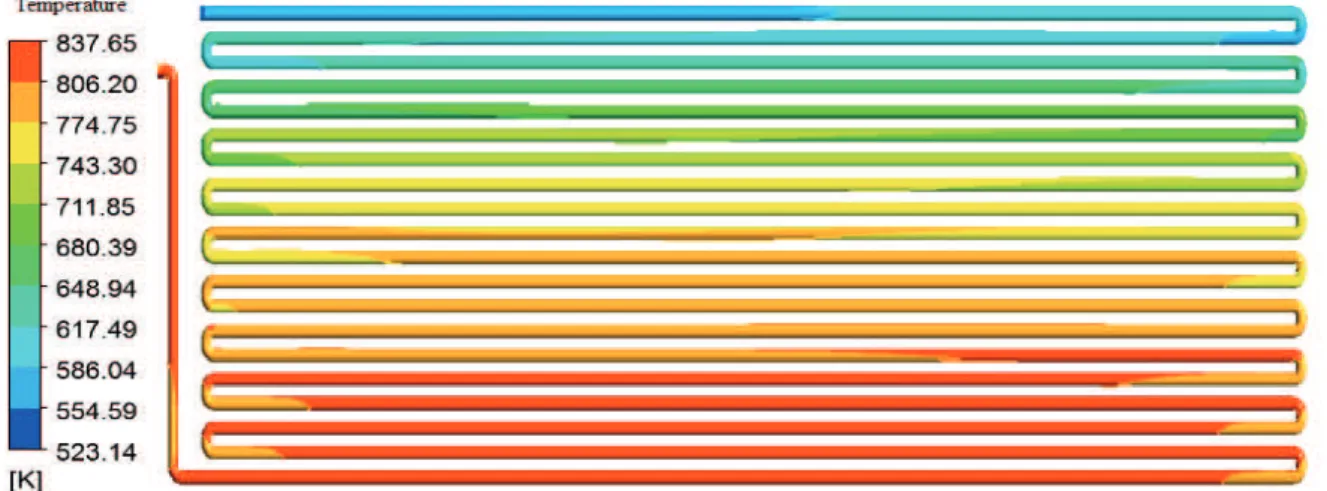
The inner surface temperature along the reactor wall is shown in Figure 9. As can be seen, despite the furnace wall temperature being constant, the predicted results obtained through CFD show a non-uniformity of the temperature on the inner surface of the reactor wall, with variations between nearby regions of approximately 30 K being observed.
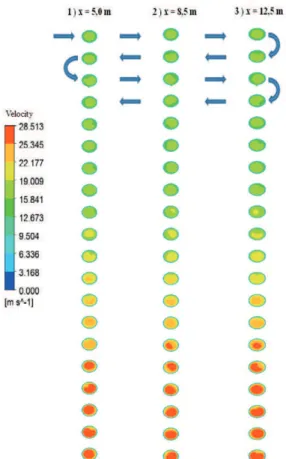
The proiles of mass fraction of EDC and temperature
at 3 cross sections are shown in Figures 10 and 11,
respectively. The arrows in theses igures indicate the direction of low. It can be observed from Figure 10 that
the variation of the mass fraction of EDC in the axial and
radial direction is initially small due to the fact that the
luid has not reached the temperature necessary to initiate
cracking. Relevant reductions of the mass fraction of EDC are observed at the eighth cross section of plane 1 from the top of Figure 10, when the reaction of cracking starts taking place closer to the wall of the reactor, which is subjected to higher temperature than the center of the reactor.
The behavior of the temperature with the radial
direction for the diferent planes analyzed illustrates the
non-uniform heating throughout the cross section of the reactor, and the results have shown, as expected, higher temperatures near the wall and the lowest at the center of the tube according to Figure 11.
The velocity variation with the radial direction is illustrated in Figure 12. The higher velocity gradient close
Figure 8. Pressure along the reactor.
Figure 9. Temperature proile on the inner surface of the reactor.
laminar in a very thin layer close to the wall (the laminar sublayer) and zero on the wall. The velocity increases along the longitudinal direction of the reactor, initially due to the temperature increase causing an expansion of the gaseous mixture along the reactor, and secondly due to the beginning of the cracking reaction that increases the number gas molecules.
Line graphs of the main variables at the center line along the reactor are illustrated in Figures 13 to 17, enabling a quantitative visualization of variables and also a comparison of the results with available industry data. In Figures 13 and 14, the results of the 1-D model for the EDC cracking, based on the model proposed by Plehiers (1990), were included for comparison. As can be seen from
these igures the 1-D model results are in agreement with
the CFD results, suggesting that the 1-D model is suitable for predicting the reactor performance.
During the irst half pass of the reactor, the process
gas temperature (reactants and products) rapidly increases because the absorbed heat is mainly used to increase the process gas temperature, as can be seen from Figure 13. The EDC cracking reaction occurs when the process
gas temperature reaches about 690 K. The process gas temperature slowly increases during the last half pass because most of the absorbed heat is used for the endothermic reaction.
The EDC mass fraction along the center line of the reactor is shown in Figure 14. The initial length of the reactor (about 100 m) where no cracking reactions occurs
due to insuicient temperature can be observed, as well
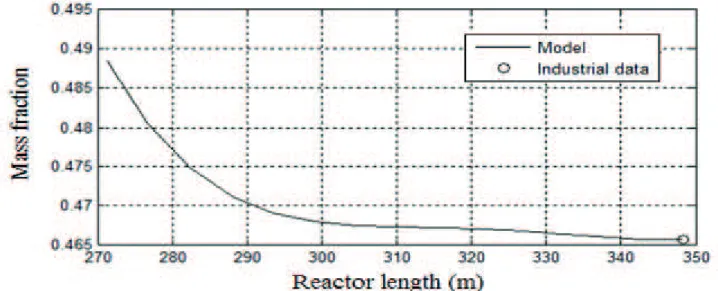
as that at the end of the reactor (about 50 m) where the rate of cracking is slow because reaction equilibrium is reached, as depicted in Figure 15. At the reactor outlet the EDC mass fraction is 0.4763, corresponding to an EDC conversion of 52.37%.
The reactor temperature and EDC mass fraction at the reactor center line from the CFD model are compared to the reactor temperature and EDC mass fraction from the 1-D model in Figures 13 and 14. As can be seen, the 1-D model and CFD models are in good agrement. It is worth
mentioning that the diference between the two proiles is
because the CFD results are those at the center line and not the average value as predicted by the 1-D model.
Figure 10. Proile of mass fraction of EDC in cross section
in diferent planes along the reactor.
because the volume of the gas expands with increasing temperature. As the cracking reaction is initiated there is
an increase in total volumetric low, further increasing the
gas velocity in relation to the heating period, as shown in Figure 16.
The pressure along the reactor center line is shown in Figure 17. The steps observed in Figure 17 correspond to the additional pressure drop due to the bends present in the reactor. It can also be observed that the pressure gradient is
not constant due to additional factors afecting the pressure
drop as, for example, temperature and density changes in the reactor.
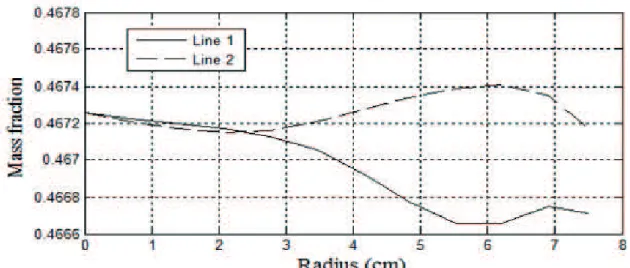
The radial proiles were analyzed quantitatively on two
lines at the outlet of the reactor shown in Figure 18.
The radial proiles of temperature, EDC mass fraction,
and velocity at the outlet of the reactor taking as origin the center of the tube (r = 0) are illustrated in Figures 19 to 21 aiming to evaluate the behavior of such variables.
Temperature diferences between the center and the wall
of the tube were 9K and 6 K for lines 1 and 2 as shown in Figure 19. The EDC mass fraction presents minimal
variation in the radial direction as shown in Figure 20.
A typical velocity proile of turbulent low can be seen
in Figure 21, showing the turbulent core and the laminar sublayer close the wall. Summarizing, from Figures 19 to 21 a low dependence of the process variables with the angular position inside the reactor can be observed. It can also be seen that, in the radial direction, the gradients of
the process variables are signiicant only closer to the wall of the reactor, approaching a plug low behavior in the
turbulent nucleus.
CONCLUSIONS
The modeling and simulation of a cracking reactor using CFD was successfully performed. The variables of the process were obtained, enabling a better understanding of the EDC cracking process. The results are in agreement with industrial data from an EDC plant in Brazil. The CFD results are also in good agreement with the 1-D model. Hence, for the previous reactor analysis and optimization,
Figure 11. Temperature proile in cross-section in diferent
Figure 12. Velocity proile in cross-section in diferent planes along the reactor.
Figure 14. Mass fraction of EDC along the reactor.
Figure 15. Mass fraction of EDC at the end of the reactor.
Figure 17. Pressure drop along the reactor (CFD model).
Figure 18. Radial lines at the exit of the reactor.
Figure 21. Velocity proile in the radial direction. Figure 20. Radial mass fraction of EDC proile.
the 1-D model can be used because it has the advantage of fast response, while the CFD is more suitable for reactor design where the understanding of the detailed behaviour of the reactor might improve the reactor performance.
The results show an increase in the velocity along the reactor, which reduces the residence time, causing a reduction in EDC conversion.
A velocity proile at the reactor outlet is identical to a power law model as expected for turbulent low in pipes
(Re = 3.6180×10⁶).
The results show that the radial gradients are important only close to the wall, sugesting that an 1-D model could be suitable for modeling the reactor of an EDC furnace,
even though it is not an ideal plug low reactor. This is
corroborated by comparing the results from CFD to the results from the 1-D model.
As a contribution of this work, a new treatment for the wall boundary condition was proposed and successfully implemented in order to eliminate the mesh in the tube wall. The heat transfer model used to represent the heat supplied by the furnace, implemented as a wall boundary condition, has been shown to be adequate for modeling the EDC cracking reactor with the advantage of low computational cost.
NOMENCLATURE
Aj Pre-exponential factor (s-1)
As External surface area of the reactor (m2) Ap Furnace wall area (m2)
CEDC Molar concentration of EDC (mol/m3) Cpi Heat capacity at constant pressure (kJ/kgK) D Internal diameter of the reactor (m) Ea Activation energy (kJ/kmol)
Fps View factor of the furnace wall to the outer surface of the reactor (-)
Fsp View factor of the outer surface of the reactor to the furnace wall (-)
g Gravity (m/s2)
hr Coeicient of heat transfer by radiation (W/m2K)
Hf Enthalpy of formation (kJ/mol) K kinetic constant (s-1)
kM Thermal conductivity of the luid misture (W/mK )
kw Thermal conductivity of the reactor wall (W/mK )
P Pressure (N/m2)
q Heat lux (W/m2)
rs External radius of the reactor (m) rin Internal radius of the reactor (m) Re Reynolds number (-)
Ri Reaction rate per unit volume of the component i (kg/m3s)
R Ideal gas constant (J/molK)
Rw Thermal resistance of the wall (K/W) S Distance between tubes (m)
SE Source of energy chemical reactions (J/m3s) t Time (s)
T Process gas temperature (K) Tp Temperature of the irebox wall (K)
Ts Temperature of the outer surface of the reactor (K)
Tw Temperature of the inner surface of the reactor (K)
v
Velocity vector (m/s)Yi Mass fraction of component A (-)
Greek letters
ΔCp Variation of heat capacity (kJ/kmol)
ΔHi Variation of the enthalpy of formation (kJ/kmol)
ΔHr Variation of the enthalpy of reaction (kJ/kmol)
є Emissivity function (-)
εs Emissivity of the surface of the reactor (-)
εp Furnace wall emissivity (-)
μef Efective viscosity (kg/ms)
ρ speciic mass (kg/m3)
σ Stefan-Boltzmann constant (W/m2K4)
ΓiM Efective mass difusivity of the component
i in the mixture (kg/ms)
Φfr Heat generation due to luid friction (J/m
3s)
λef Efective thermal conductivity (W/mK)
Subscripts
i Component j Reaction
s External surface of the reactor
ef Efective
EDC 1,2-dichloroethane E Energy
in Internal f Formation
w inner surface of the reactor
ACKNOWLEDGMENTS
The authors are grateful to the National Council for
Scientiic and Technological Development of Brazil (CNPq) and Braskem S. A. for their inancial and technical
support, respectively.
REFERENCES
ANSYS CFX-Solver Theory Guide. ANSYS Inc.,Canonsburg, United States (2009).
Bird, R.B., Stewart, W.E. and Lightfoot, E.N. Transport Phenomena. 2nd ed. John Wiley & Sons (2002). Borsa, A. G. Industrial Plant/Laboratory Investigation and
Computer Modeling of 1,2-Dichloroethane Pyrolysis. Ph.D. Dissertation, Colorado School of Mines, Golden, CO (1999).
Choi, B. K.; Oh, S.; Kim, W.; Yi, J. Simulation of the Efect
of CCl4 on the Ethylene Dichloride Pyrolysis Process. Industrial Engineering Chemistry Research; vol. 40, p. 4040-4049 (2001).
Fogler, H. S. Elements of Chemical Reaction Engineering, Prentice Hall International Series, 3rd Edition (2000). Hector Zambrano, Leonardo Di G. Sigalotti, Franklin
Pena-Polo , Leonardo Trujillo, Turbulent models of
oil low in a circular pipe with sudden enlargement,
Applied Mathematical Modelling, vol. 39, s. 6711– 6724, Elsevier (2015).
Incropera, F. P., Dewitt, D. P., Bergman, T. L., Lavine, A. S. Introduction to Heat Transfer, 5th Edition, John Wiley & Sons (2007).
Li, C.; Hu, G. ;Zhong, W. ;He, W.; Du, Wenli; Qian, F.;
Coke Deposition Inluence Based on a Run Length Simulation of a 1,2-Dichloroethane Cracker. Industrial & Engineering Chemistry Research., 52 (49), 17501-17516 2013.
Li, C. ;Hu, G. ;Zhong,W. ;Hui, C.; Qian, F.; Comprehensive Simulation and Optimization of an Ethylene Dichloride
Cracker Based on the 1-D model Lobo−Evans Method
and Computational Fluid Dynamics. Industrial & Engineering Chemistry Research., 52 (49), 17501-17516 (2012).
Oprins, A.J.M. and Heynderickx, G.J., Calculation of
three-dimensional low and pressure ields in cracking
furnaces. Chemical Engineering Science, 58(21),. 4883–4893 (2003).
Panjapornpon, C.; Limpanachaipornkul, P.; Charinpanitkul, T., Control of coupled PDEs–ODEs using input– output linearization: Application to a cracking furnace. Chemical Engineering Science, 75, 144–151 (2012). Plehiers, P. M.; Geert, C.R.; Froment, G. F. Simulation
of the Run Length of an Ethane Cracking Furnace. Industrial Engineering Chemistry Research, 29, 636-641 (1990).
Plehiers, P. M.; Reyniers, G. C.; Froment, G. F. Simulation ofthe Run Length of an Ethane Cracking Furnace. Ind.
Eng. Chem. Res., 29, 636−641 (1990).
Ranzi, E.; Dente, M.; Rovaglio, M.; Faravelli, T.; Karra, S. B.Pyrolysis and Chlorination of Small Hydrocarbons,
Chemical Engineering Communication, 117, 17-39 (1992).
Schirmeister, R.; Kahsnitz, J.; Trager, M., Inluence of
EDC Cracking Severity on the Marginal Costs of Vinyl Chloride Production. Ind. Eng. Chem. Res., 48, 2801– 2809 (2009).
Stegowski, Z., Furman, L., Su’ud, Z., Kurniadi, R., Waris, A., & Abidin, Z. (2013). Dispersion determination in
a turbulent pipe low using radiotracer data and CFD
analysis. Computers & Fluids, 79, 77-81 (2013). Sundaram, K. M.; Froment, G. F. Kinetics of coke
deposition in the thermal cracking of propane.Chemical Engineering Science, 34, 635–644 (1979).
Xingying, L.; Chunming, X.; Jinsen, G.; Hongmei, Z. A New Mathematical Simulation Approach for Thermal Cracking Furnace Studies. Petroleum Science, 2 (2004).
Yaws, C. L.. Chemical Properties Handbook, McGraw-Hill (1999).
Zhang, N., Tong, Q. I. U., and Bingzhen, C., CFD simulation of propane cracking tube using detailed radical kinetic mechanism. Chinese Journal of Chemical Engineering, 21(12), 1319-1331 (2013). Yang, Y. and Cao, B., Two-Dimensional Modeling of